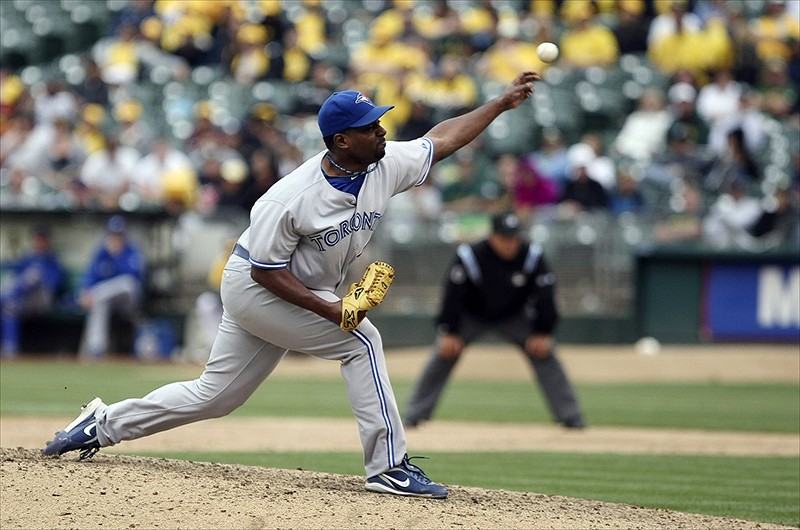
Darren Oliver / Kelley L Cox-USA TODAY Sports
Darren Oliver has re-signed with the Blue Jays for 2013 and he’ll be coming back for his 20th season in the majors. He’ll be 42 on Opening Day.
Perhaps the most incredible thing about Oliver’s career is that he isn’t simply hanging on into old age. His line for the last 5 years (2008-2012) reads like this: 304 games, 1 start, 314.1 IP, 271 H, 79 BB, 274 K, 2.52 ERA, 175 ERA+.
Take a look at that line again. Basically, he’s been an ace reliever.
Oliver’s last bad season was in 2004. He didn’t pitch in the majors in 2005, but since then has rattled off 7 straight years ranging from good to excellent. Over that period, he’s been worth 10 Wins Above Replacement as a middle reliever.
Just to give you an idea of how valuable Oliver has been, here are the leaders in WAR among non-closing relievers:
Oliver himself didn’t qualify for this list since he was primarily a starter before his renaissance.
If we look at just 2006-2012, since Oliver has been reborn as a reliever, here are the top WAR totals among non-closing relievers:
Any way you slice it, this guy is among the best middle relievers going into 2013.

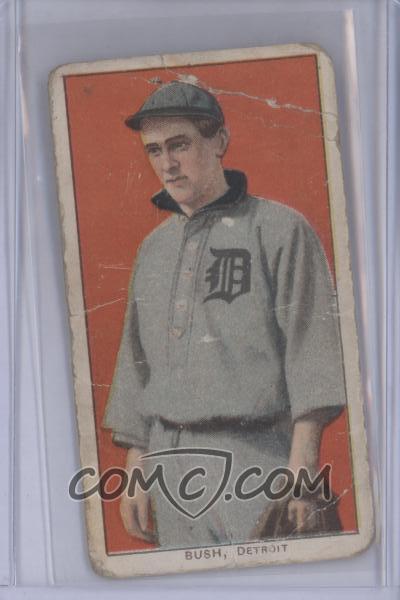 Donie Bush was the regular Tiger shortstop for 12 seasons, from 1909 to 1920. Over his career, Bush compiled totals exceeding 1800 hits, 1200 runs, 1100 walks and 400 stolen bases. Yet, he managed only a 91 career OPS+.