This post is for voting and discussion of the sixth round of voting for the Circle of Greats, which adds players born in 1963. Rules and lists are after the jump. Continue reading
Circle of Greats 1963 Ballot
219 Replies

This post is for voting and discussion of the sixth round of voting for the Circle of Greats, which adds players born in 1963. Rules and lists are after the jump. Continue reading
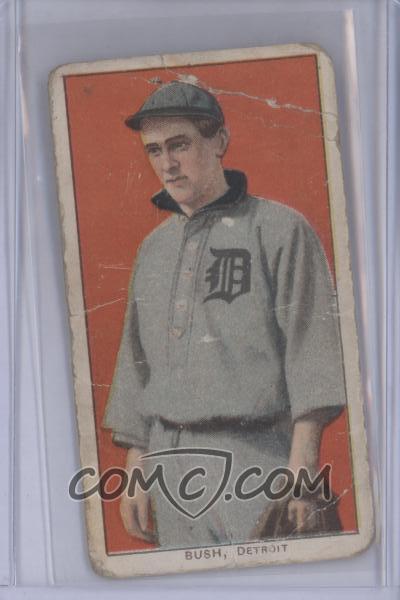 Donie Bush was the regular Tiger shortstop for 12 seasons, from 1909 to 1920. Over his career, Bush compiled totals exceeding 1800 hits, 1200 runs, 1100 walks and 400 stolen bases. Yet, he managed only a 91 career OPS+.
So, I wondered what other players there might be like Donie Bush. Let’s find out.
Although there has already been much discussion in comments to other posts on the passing of Stan Musial and Earl Weaver, a separate thread for these all-time greats is more than appropriate.
Weaver’s teams were a cumulative 420 regular season games over .500 with him as manager. In the history of the American League, only Joe McCarthy was more games over .500 as a manager in the AL as well his for his career as a whole.
A Play Index search that I did produces just three guys: Stan Musial, Joe Carter and Felipe Alou. What did I search? Clue: it was a career, regular season search.
Here’s a pretty good all-time NL everday starting lineup by position:
C: Bench
1B: Musial (played more games there than any other individual position, if you count the three OF positions separately)
2B: Hornsby
SS: Wagner
3B: Schmidt
LF: Bonds
CF: Mays
RF: Aaron
Barry Bonds wins induction as the fifth member of the Circle of Greats, appearing on 55 of 88 ballots. No one else appeared on more than 30 ballots this round. More on Bonds and the voting after the jump. Continue reading
Two rookie phenoms in 2012 had seasons for the ages, joining the very select group of players below.
Since 1901, what single season statistical feat has been accomplished only by these players?
| Player |
|---|
| Luke Appling |
| Rogers Hornsby |
| Barry Bonds |
| Honus Wagner |
| Lou Gehrig |
| Bryce Harper |
| Ted Williams |
| Babe Ruth |
| Carl Yastrzemski |
| Cal Ripken |
| Mike Trout |
| Willie Mays |
Hint: several players on the list did this more than once.
Congratulations to Josh! He correctly identified these players as the record holders for seasonal WAR at each age, with a minimum of 2 WAR. That minimum covers the ages 19 through 42. The record seasons are after the jump, as well the best WAR seasons outside of this age range. Continue reading
(Congratulations to ReliefMan, who answered correctly almost before the words were out of my mouth.)
These 10 players are the all-time leaders in some career batting feat in the form of “the most X without any Y”:
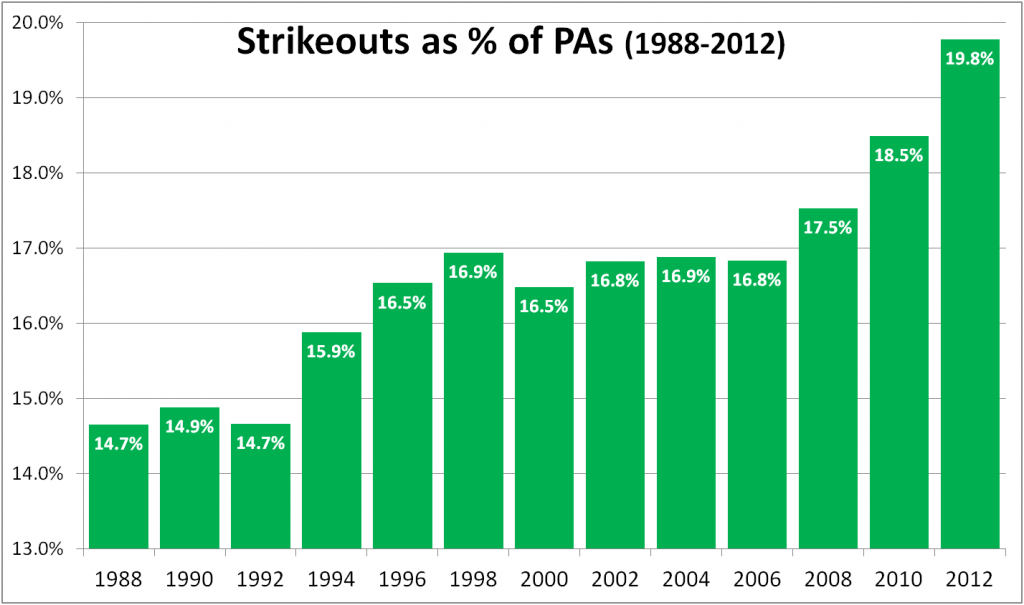
The MLB strikeout rate has risen 35% since 1988, climbing from 14.7% of all PAs to 19.8% in 2012. It’s not all the batters’ doing, and I’m not here to berate them, anyway. I just want to look at two basic parts on their side of the K-rate equation. Let’s show the basic rate before we break it down:
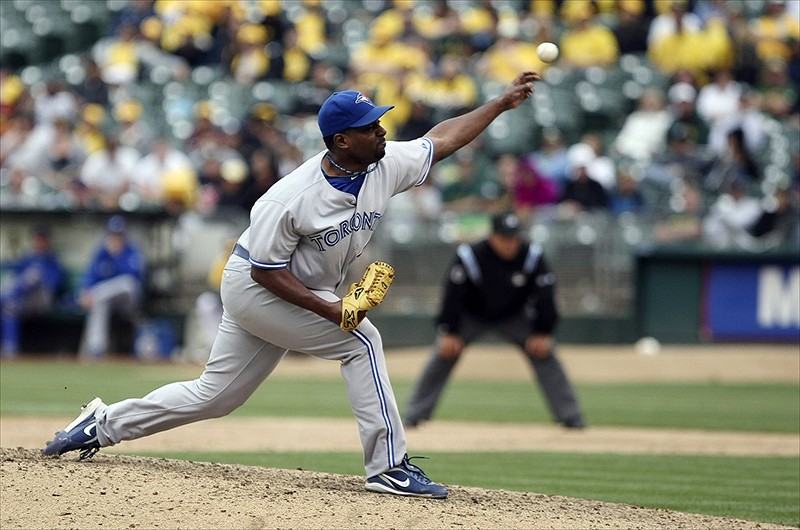
Darren Oliver / Kelley L Cox-USA TODAY Sports
Darren Oliver has re-signed with the Blue Jays for 2013 and he’ll be coming back for his 20th season in the majors. He’ll be 42 on Opening Day.
Perhaps the most incredible thing about Oliver’s career is that he isn’t simply hanging on into old age. His line for the last 5 years (2008-2012) reads like this: 304 games, 1 start, 314.1 IP, 271 H, 79 BB, 274 K, 2.52 ERA, 175 ERA+.
Take a look at that line again. Basically, he’s been an ace reliever.
Oliver’s last bad season was in 2004. He didn’t pitch in the majors in 2005, but since then has rattled off 7 straight years ranging from good to excellent. Over that period, he’s been worth 10 Wins Above Replacement as a middle reliever.
Just to give you an idea of how valuable Oliver has been, here are the leaders in WAR among non-closing relievers:
| Rk | Player | WAR | SV | G | From | To |
|---|---|---|---|---|---|---|
| 1 | Octavio Dotel | 15.4 | 109 | 752 | 1999 | 2012 |
| 2 | LaTroy Hawkins | 14.1 | 88 | 871 | 1995 | 2012 |
| 3 | Rafael Betancourt | 13.6 | 58 | 603 | 2003 | 2012 |
| 4 | Matt Thornton | 10.4 | 23 | 546 | 2004 | 2012 |
| 5 | Scott Downs | 9.9 | 26 | 496 | 2000 | 2012 |
| 6 | Sean Marshall | 9.4 | 16 | 365 | 2006 | 2012 |
| 7 | Mike Adams | 9.3 | 4 | 358 | 2004 | 2012 |
| 8 | Joaquin Benoit | 9.1 | 13 | 475 | 2001 | 2012 |
| 9 | Jesse Crain | 8.5 | 4 | 494 | 2004 | 2012 |
| 10 | Jeremy Affeldt | 8.4 | 28 | 621 | 2002 | 2012 |
Oliver himself didn’t qualify for this list since he was primarily a starter before his renaissance.
If we look at just 2006-2012, since Oliver has been reborn as a reliever, here are the top WAR totals among non-closing relievers:
| Rk | Player | WAR | SV | G | From | To |
|---|---|---|---|---|---|---|
| 1 | Rafael Betancourt | 11.1 | 52 | 448 | 2006 | 2012 |
| 2 | Matt Thornton | 10.1 | 23 | 472 | 2006 | 2012 |
| 3 | Scott Downs | 10.0 | 26 | 438 | 2006 | 2012 |
| 4 | Darren Oliver | 10.0 | 5 | 410 | 2006 | 2012 |
| 5 | Sean Marshall | 9.4 | 16 | 365 | 2006 | 2012 |
| 6 | Mike Adams | 8.0 | 3 | 299 | 2006 | 2012 |
| 7 | Brad Ziegler | 7.3 | 19 | 323 | 2008 | 2012 |
| 8 | Grant Balfour | 7.1 | 34 | 343 | 2007 | 2012 |
| 9 | Darren O’Day | 7.1 | 2 | 255 | 2008 | 2012 |
| 10 | David Robertson | 6.8 | 5 | 269 | 2008 | 2012 |
Any way you slice it, this guy is among the best middle relievers going into 2013.
I posted this list in the comments to an earlier thread, but it really seems to deserve its own post.
Here are the players since 1901 who scored the highest percentage of time once reaching base (including reaching on error) with a minimum of 4000 career plate appearances.
1	Red Rolfe	48.8%
2	Jack Smith	47.2%
3	Pepper Martin	46.9%
4	Earle Combs	46.5%
5	Tommy Leach	45.3%
6	Joe DiMaggio	45.2%
7	C Granderson	45.2%
8	Ian Kinsler	44.4%
9	Lou Gehrig	44.2%
10	Hughie Critz	44.0%
11	Ray Chapman	44.0%
12	Tom Goodwin	43.7%
13	Babe Ruth	43.7%
14	Tommy Henrich	43.7%
15	C Gehringer	43.5%
16	Chuck Klein	43.4%
17	Kenny Lofton	43.3%
18	Earl Averill	43.3%
19	Alex Rodriguez	43.0%
20	Fred Clarke	42.9%
21	Donie Bush	42.8%
22	Vince Coleman	42.7%
23	F Lindstrom	42.7%
24	Kiki Cuyler	42.6%
25	Bobby  Bonds	42.6%
26	Bill Cissell	42.6%
27	Jimmie Foxx	42.6%
28	Pete Fox	42.5%
29	Jimmy Rollins	42.5%
30	Ron Gant	42.5%
This is quite an eclectic group, huh?
The research was sparked by reader kds noticing that Kenny Lofton had a very high percentage, and indeed he clocks in at #17. Some other leadoff-type speedsters make it too, with Bobby Bonds, Vince Coleman, Tom Goodwin(!), Jimmy Rollins, and others. Then there are other guys with a lot of home runs–obviously that’s an automatic 1-for-1 in terms of scoring when reaching base–Babe Ruth, Alex Rodriguez, Jimmy Foxx, etc.
I’m sure there’s a lot more we can glean from this…have at it.
Here’s a pretty simple graph showing the breakdown each year of hits distribution.
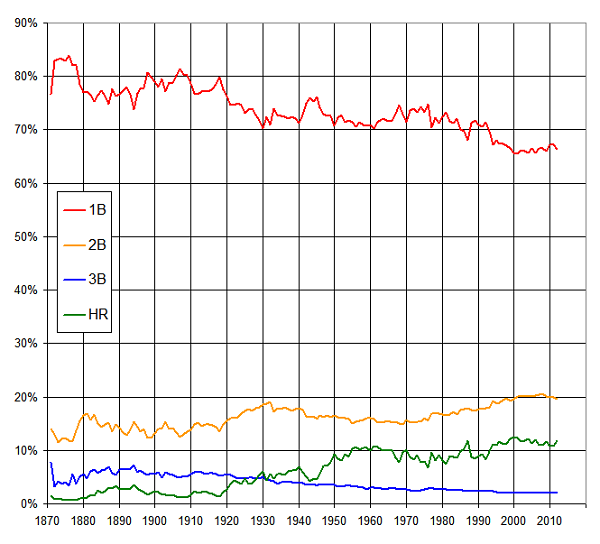
So, for any given year, this shows the percentage of total hits for that year that were singles, doubles, triples, or homers.
Some observations / conclusions:
I wonder what singles will look like 50 years from now. The decline has been remarkably linear so far, losing just about 8/10ths of a percentage point each decade. I’m sure that rate will slow, or else singles will account for fewer than half of all hits by about the year 2206. (Although this is an accurate projection from the data, rest assured that my tongue is planted firmly in my cheek right now.)