Mike Sandlock, catcher and infielder with three NL teams in the 1940s and 1950s, recently passed away at the age of 100. Sandlock is the 17th major-leaguer and first catcher to live 100 years.
After the jump, a look at the majors all-century team.

Mike Sandlock, catcher and infielder with three NL teams in the 1940s and 1950s, recently passed away at the age of 100. Sandlock is the 17th major-leaguer and first catcher to live 100 years.
After the jump, a look at the majors all-century team.
For the April 20-26 issue of USA Today Sports Weekly, Andy analyzed league-wide stats after each team’s first 10 games of the 2016 season. He explains what has made this year unique and how playing style continues to evolve.
Here is the link to the column. High Heat Stats is contributing to the magazine every week this season, so stay tuned for future links or consider picking up a print copy.
Two weeks into the new season and the clubs with the longest current winning streaks are the Braves and Twins. Which is interesting because both those clubs lost their first 9 games, only the second time since 1913 that two teams have stumbled so badly out of the gate.
More quirky tidbits from the young season are after the jump.
Here’s a relatively simple plot showing the percentage of all 18,690 MLB players in history to hit “X” home runs. In other words, about 33% of all players hit at least 1 homer, about 29% hit at least 2 homers, etc. Some other key numbers: 19% hit at least 10, 4.4% hit at least 100, and 0.16% have hit at least 500.
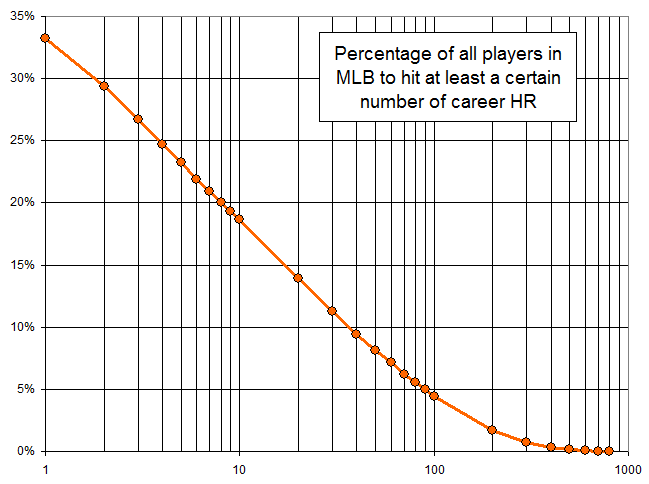
It’s unsurprising that the curve is linear for the middle section–with around 3,000 players to hit 10+ homers, we see a smooth and expected distribution with so many data points. I assume the lower end of the curve at 1 and 2 homers falls off because there is an unusually high number of players to hit very few homers. This includes lots of pitchers and other players who had only a cup of coffee and managed only a dinger or two. The high end of the curve fails to fall off linearly I assume because players who hit a fair number of homers tend to be the ones who are selected to stick around in MLB and therefore hit even more. The hitting of homers isn’t simply a random event distributed over the entire population–certain players are selected to remain in MLB, and the longer a guy sticks around, the more likely it is that he hits homers at an above-average pace.
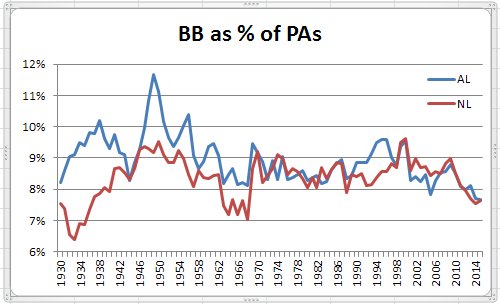
MLB walk rates are at historic lows, another artifact of a declining run scoring environment. Rates below 8% of PAs have been recorded in both leagues for the past two seasons, levels not seen since the 1960s in the NL, and not seen previously in the AL in the live ball era.
More after the jump.
The new “Chase Utley” slide rule was applied in Tuesday’s Jays-Rays game, and raised some immediate controversy, not least because the offending slide was among the most gentlemanly you’re likely to see in an attempt to break up a double play.
After the jump, it’s your turn to weigh in on the new rule.
Here are some game notes for the Opening Day STL/PIT game from yesterday. Continue reading
Opening day is almost here. Every team but the Yankees has named their opening day starter, so here’s a team-by-team look at those selections, with some (hopefully) interesting related tidbits.
More after the jump.
I just ran some numbers to see what they show. I took the 191 players to play at least 324 games (2 seasons’ worth) over the last 3 years and ranked them by their WAR total (ugh, Skip Schumaker!). Then I calculated their WAR per 162 games played. Finally, I sorted the results by ranking difference between their raw WAR total and WAR/162 value. Players at the top of this list jumped up the most places–so mainly these are guys who didn’t quite play 3 full seasons but posted high WAR totals. Players at the bottom of this list fell the most places, and they are mainly guys who played a lot and accumulated decent-but-not-great WAR totals that suffered when normalized to games played.
The full table is after the jump. Continue reading
I’m working on a USA Today Sports Weekly piece, and there sure is a lot of interesting stuff that happens in April.
We know that relievers have tossed an increasingly large fraction of innings over the years. In the 1970s, relievers tossed about 20% of all innings. In recent years, the percentage has been closer to 24%. That may not seem like a lot, but with a little over 43,000 innings last year, that extra 4% represents more than 5000 outs being recorded by relievers instead of starters.
It’s interesting to break down relief pitching even a little further, looking at what happens in all MLB games through the end of April vs the remainder of the regular season after April. Here is the percentage of innings pitched by relievers in those two conditions:
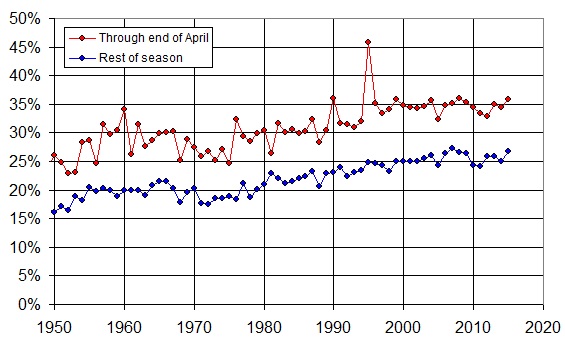
Both lines trending up over the years indicate what we already knew: relievers are throwing more and more innings, and it’s true for both April and the rest of the months. Incidentally, that spike for April in 1995 is due to the delayed start of the season from the 1995 strike–both a small sample size of games, and pitchers who had very little spring training to get ready.
Relievers have tended to be more effective than starters, especially as bullpen specialization (9th-inning closer, 8th-inning setup guy, and LOOGY) has increased. Because relievers roles are better defined, they can warm up more efficiently and not worry about leaving anything in the tank. This leads to harder pitches, more strikeouts, and less offense.
Take a look at the ratio of the two lines in the plot above. This quantifies how much more pitching relievers do in April vs the rest of the season. For example, in a given year, if they threw 30% of April innings and 20% for the rest of the season, that would register as 150% for that year, since they threw 1.5 times as many of the April innings (on a percentage basis).
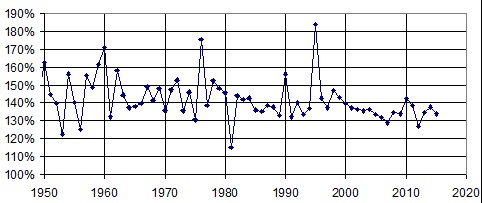
Throughout the 1970s, relievers pitched about 1.45 times as many innings than they did during the rest of the season (again, on a percentage basis). In the 1980s, it was about 1.40. In the 1990s, when offense spiked, so did the relievers’ innings (as starters were getting knocked out like crazy) but over the 2000s the value dipped as low as 1.30, a value it has hovered around in recent innings.
This makes sense for a couple of very different reasons:
Do you realize what this means? It means the notion that “pitchers are ahead of hitters early in the season” is wrong. The more likely explanation is that “relievers were used more frequently in April in years gone by, and were more effective, hence lower April offense, but now that there is much less difference in relief pitcher usage, there is little difference in April offense and that of the other months.”