A Portrait of the Pitcher as a (Cy) Young Man – Part 1

With apologies to James Joyce, here’s a post on the Cy Young Award, to be awarded this season, for the sixtieth time, to the best pitcher in each league, as voted by the Baseball Writers’ Association of America. The idea for this post, and most of the content, are courtesy of commenter No Statistician But. More after the jump.

No Statistician But has been a regular contributor at HHS since this site was established in 2011, and possibly in its earlier incarnation on the BR Blog. He recently sent me a few ideas on Awards related posts, and I’ve chosen to start with this one, in recognition of his frequent contributions to discussions of pitcher performance, a topic of keen interest to him. So, with that introduction, let’s begin.

Suppose the Cy Young Award was restricted to starting pitchers. After all, when the Award was first instituted in 1956, it would have been inconceivable that any pitcher other than a starter could be regarded as the “best” pitcher in the game. Even the name “Cy Young Award” honors the man who is the all-time leader in categories that are the province solely of starting pitchers, categories like Games Started, Complete Games, Innings Pitched, Wins and Wins Above Replacement.

In fact, starting pitchers do account for the large majority of CYA winners. It’s been more than twenty years since a reliever claimed the award, and only nine of the 129 recipients to date have been relief specialists. However, eight of those nine were chosen in a 19 year period (1974-92), amounting to over 20% of the picks for those seasons. What would the choices have been in those seasons if only starting pitchers were eligible for the award?

To answer that question, it is instructive to consider the starting pitchers who have been chosen as CYA winners. In all but the recent past, voters have been guided by traditional, non-sabermetric, statistics and, of these, the most influential have been Wins, Win-Loss %, ERA and Strikeouts. Additionally, voters have strongly favored pitchers on winning teams, presumably on the premise that pitchers on losing teams, however strong their performance may have been, could not have been that valuable, since their teams still lost a majority their games. Thus, in choosing our alternate CYA winners, I will try to emulate how voters at the time might have voted, not how we might vote today with access to an immensity of sabermetric data (that is a topic for another post).

On that topic of sabermetric statistics, it is interesting to note that none of the first seven CYA winners (for 1956 to 1962) led their league in Pitcher WAR, or pWAR. In fact, only one of those first seven honorees even finished in his league’s top 5 in pWAR for the season in question. Instead, six of the seven led their league in Wins (Vern Law being the exception), and six of the seven played on pennant winners (Don Drysdale excepted, and he played on a team that lost a pennant playoff). Even in the “enlightened” times of the present day, it is noteworthy that 34 of the 50 award recipients since 2001 placed first or second in their league in Wins, and a large majority played on teams with 88 or more wins, or fourteen games above .500.

So, who would have been the CYA winners if only starting pitchers were eligible for the award? These are my picks:

  • 2003 NL – Replacing Eric Gagne in his 55 save season is the CubsMark Prior, with an 18-6 record and 2.43 ERA for a Chicago side that possibly came within an outstretched glove of the pennant. Those totals were good for 2nd in Wins and Win-Loss %, and 3rd in ERA and CYA votes. He also placed 1st in the sabermetric categories of pWAR and FIP.
  • 1992 AL – Replacing Dennis Eckersley in his 51 save season is Jack McDowell of the White Sox. He posted a 20-10 record with a career best 3.18 ERA for a Sox team that finished 3rd in the AL West with an 86-76 record. McDowell was one win shy of the league leaders, and he did lead the majors in complete games for the second year in a row. He also finished 2nd in CYA voting that year, and 1st the next season when he led the majors in Wins for a division-winning Sox side.
  • 1989 NL – Replacing Mark Davis in his 44 save season (46% of his career total) is Greg Maddux with a 19-12 record and 2.95 ERA for the surprise NL East champion Cubs in their only .500 season in an eight year span (1985-92). The wins were good for 2nd in the league, but that ERA failed to crack the top ten. Nevertheless, in just his third full season, CYA voters still ranked Maddux 3rd on their ballots.
  • 1987 NL – Replacing Steve Bedrosian in his 40 save season is Rick Sutcliffe of the Cubs, with an 18-10 record and 3.68 ERA. As noted above, the Cubs were a sub-.500 team that year, but started the season strongly, with a 33-24 record after taking a pair of nail-biters from the defending world champion Mets in June. Sutcliffe’s 18 wins led the league, and his career best 6.0 WAR ranked 3rd, good for a runner-up finish in CYA voting for the 1984 honoree.
  • 1984 AL – Replacing Willie Hernandez in his MVP season of 140 relief IP and 1.92 ERA for the world champion Tigers is your choice of Jack Morris, ace of those same Tigers, or the OriolesMike Boddicker. Boddicker’s 20 wins and 2.79 ERA both led the league, but Baltimore finished no higher than 5th in the AL East despite a respectable 85-77 record. Morris was right behind Boddicker with 19 wins for the wire-to-wire AL East champions who, despite their legendary 35-5 start, held just a 3½ game lead after a mini-swoon that dropped their record to only 39-13 (.750) on June 6th.
  • 1981 AL – Replacing Rollie Fingers with his majors-leading 28 saves (remember this was a strike-shortened season) is Steve McCatty of the AL West champion Athletics. McCatty led his league in Wins, ERA and Shutouts and placed 2nd in CYA voting. McCatty and teammate Rick Langford both completed 70% of their starts, as Oakland, for the second year in a row, boasted two such qualified pitchers; those are the only such teams of the integration era.
  • 1979 NL – Replacing Bruce Sutter in his 37 save season is J.R. Richard with an 18-13 record, 2.71 ERA and 313 strikeouts for an Astros team recording a then franchise record 89 wins and 2nd place finish in the NL West. That ERA led the majors as did his strikeouts, FIP and H/9, the last three for the second year in a row. The Astros would finally make it to the post-season the following year, but sadly without Richard, after a stroke in that 1980 season cut short his promising career.
  • 1977 AL – Replacing Sparky Lyle in his 13 win, 26 save season is Jim Palmer with a 20-11 record and 2.91 ERA in a league-leading 319 IP. This was Palmer’s third straight 20 win season, part of a run of eight 20 win seasons in nine years (1970-78) to match Warren Spahn‘s feat in the NL from 1953 to 1961. A CYA in this season would have been Palmer’s fourth, and third in a row, feats matched by only Greg Maddux and Randy Johnson.
  • 1974 NLMike Marshall posted a 15 win season with record-breaking totals of 106 games pitched, all in relief, and 208⅓ IP, the last a total that most starting pitchers no longer reach. In his place goes Phil Niekro with his own league-leading marks of 20 wins, 18 complete games and 302⅓ IP, as well as a second-ranked 2.38 ERA. This was Niekro’s age 35 season and the first of six straight 6 WAR campaigns; his 65.5 WAR aged 35 and older remains the all-time record.

So, those are my picks. What about yours?

In Part 2, I’ll go back in time to the CYA’s first eleven seasons, when just one pitcher was chosen as the best of both leagues. Who might the other winners have been if there had been a CYA for each league in those seasons?

Subscribe
Notify of
guest

53 Comments
Oldest
Newest Most Voted
no statistician but
no statistician but
24 days ago

Which relief pitcher had the best season of all time? After dissing relievers via Doug’s post—and I stand firm in the belief that none of the CY winners who have finished games rather than starting them deserved the award—the question remains, who came closest? Joe Page in 1949 and Jim Konstanty, eccentric MVP choice the following year, certainly inspired the BBWAA with a new awareness of relief pitching before the concept of the Save was understood or codified, and fifty or so years later Mariano Rivera reached a peak of excellence and longevity unlikely to be matched. During the seasons… Read more »

Doug
Doug
24 days ago

Rich Gossage in 1975 or 1977 would give McDaniel a stiff challenge. More innings and GF, better ERA+ and similar appearances and saves. -Gossage’s ERA was 0.72 better than the league leader in ’77, who happened to be his teammate, John Candelaria. McDaniel was 0.65 better than his best qualified teammate, Ernie Broglio, who led the majors with 148 ERA+ (and was only 0.04 behind the league leader in ERA) -McDaniel had better WHIP (0.937) than Gossage (1.193/0.955 in ’75/’77), mainly due to a much lower walk rate (1.9 vs. 4.4 and 3.3), whereas Gossage was better in H/9 with… Read more »

Tom
Tom
24 days ago

Mike Marshall’s 1974 season was truly inhuman. 106 games. 208 1/3 innings in relief. McDaniel and Gossage had much better rate stats, but I would argue that no reliever has ever been more valuable in terms of his team’s pitching strategy. That year, he pitched 92 more innings than 1960 McDaniel, 66 2/3 more than 1977 Gossage. The rest of the 1974 Dodgers staff combined to pitch 182 innings. Marshall was responsible for 53% of his team’s relief innings. And his rate stats were excellent considering his usage: 141 ERA +, 2.59 FIP. And, let’s not forget the context. Marshall… Read more »

no statistician but
no statistician but
23 days ago
Reply to  Tom

Tom: Your arguments are persuasive, and certainly there’s no other relief season like Marshall’s that year, the closest possibly being that of Konstanty in 1950, 74 appearances, 152 IP. The term uniqueness applies. On August 19, 1974, the Dodgers played the Cubs at Wrigley. LA, after threatening to run away with the division, had lost the previous six games. The Cubs took an early 7-2 lead, but the Dodgers scored 3 in the fifth and 2 more in the seventh to tie. Marshall took the mound in the bottom of that inning. In the top of the 12th, game still… Read more »

Doug
Doug
22 days ago

And he pitched in every game of the World Series, including 2, 2, and 3 innings in the final three games played on consecutive days. His only run allowed was a solo home run by Joe Rudi that proved to be the series-winning run in game 5. During the season, Marshall pitched: -5 days in a row – Apr 8-12, Apr 27-May 1 and Aug 28-Sep 1 -6 days in a row – Jun 21-26 and Sep 21-26 -8 days in a row – May 17-24 -8 times in 9 days – Jun 18-26, Jul 2-10 and Sep 18-26 -9… Read more »

Last edited 22 days ago by Doug
Doug
Doug
22 days ago

Another reliever season that should be considered as the best ever is Mark Eichhorn in 1986. His stat line is below. -Combination of 157 IP with 246 ERA+ is unmatched by any reliever. Most IP with a higher ERA+ is 143 IP by Jim Kern in 1979. Highest ERA+ with more IP is 171 by Wilbur Wood in 1968. -166 strikeouts second to Dick Radatz’s 181 in 1964 -2.6 BB/9 with over 30% of BB intentional. Unintentional rate is 1.8 UBB/9. -5.35 SO/UBB ranks 4th in seasons with 100+ relief IP and HR/9 under 0.5. Eichhorn pitched 40+ more IP… Read more »

Mark-Eichhorn-1986
no statistician but
no statistician but
22 days ago
Reply to  Doug

Doug: Eichhorn’s season, to a great degree, is that of a superior middle reliever—Dellin Betances’ in 2014-15 comes to mind as purer in this regard. Eichhorn wasn’t really a closer for his team. Tom Henke held that role, and while Henke’s ERA is somewhat pedestrian, he bested Eichhorn in Saves 27-10, Save % 77-71, and inherited runs scoring % 24-26. And, of course, as befits a closer, the team’s record in his appearances was much more positive, 46-17 to Eichhorn’s 33-35. That difference helps to define Eichhorn’s main role as the guy who’ll keep the score close when the team… Read more »

Doug
Doug
21 days ago

Eichhorn pitched 11 seasons, the first a September call-up and the last an aborted comeback from injury. In between were 9 seasons of 65+ IP. That may not sound especially impressive, except that no pitcher has matched that feat since Eichhorn (something I never would have guessed). Here’s the list for most consecutive 65 IP seasons pitching exclusively in relief. 13 – Kent Tekulve (1976-88) 10 – Sparky Lyle (1972-81), Bruce Sutter (1976-85), Jeff Reardon (1980-89), Lee Smith (1983-92) 9 – Ron Perranoski (1962-70), Bob Locker (1965-73), Rollie Fingers (1974-82), Mark Eichhorn (1986-1994) These pitchers are shown below in order… Read more »

Relievers-with-9-Consecutive-Seasons-of-65-IP
Bob Eno
Bob Eno
22 days ago

I’ve been slow to register that there was a new post — it’s great to see nsb’s award reflections inspire more formal presentation. My initial step in exploring Doug’s post was to look at the first award on his list: 2003 NL. It seems to me that if the task is to emulate the voters of the day, Prior’s priority, which relies heavily on pWAR and FIP, would seem to yield to Jason Schmidt’s case, based on ERA (2.34 vs. Prior’s 2.43), W-L%, and strength of team (bearing in mind that the CYA vote takes place before the playoffs —… Read more »

no statistician but
no statistician but
21 days ago
Reply to  Bob Eno

Bob: Don’t blame Doug for the choices, since he has merely edited into shape the selections I sent him and the putative reasons for them. Part of my unspoken reasoning for picks like Prior and Maddox—see Doom’s argument below— was based on the assumption that, without the reliever in the mix to choose from, the voters would have an entirely different picture to evaluate. Both Prior and Maddox were new to the scene, they were the aces on surprise winners. Another part of my reasoning was to inspire disagreement and stir up interest during what to me is one of… Read more »

Dr. Doom
Dr. Doom
22 days ago

I don’t have a problem with most of these. They basically make sense. And I can understand the preference to not “just” go for the top-vote-getter among starters. But there are a couple I’m confused by: 1989: I don’t think there’s any way Maddux wins that award over Mike Scott. Scott won more (20-19), lost fewer (10-12), was the bigger (established) star, and also played for a winning team. To me, that’s a Mike Scott win, for sure. 1984: I don’t disagree with you on this one, actually. I think Boddicker would’ve been the unquestionable winner; he won the most… Read more »

no statistician but
no statistician but
21 days ago
Reply to  Dr. Doom

Doom: See my reply to Bob Eno above regarding some things. As regards Messersmith over Niekro, or vice versa, I decided to go with the better ERA. Once 17 votes were freed up, some of those were going to go to Sutton, some to Niekro, some to Messersmith.

Dr. Doom
Dr. Doom
21 days ago

Thanks for your point. But I’m going to make another one in Andy Messersmith’s favor. Andy Messersmith was 14 (half-)games over .500 (20-6); Phil Niekro was 7 (20-13). That’s a 7 (half-)game advantage for Messersmith. And I know W-L vs. .500 isn’t everything – we’ll get to it. But let’s look at the Cy Young Award in the two-league-award era, leading up to ’74. 1973 NL: Tom Seaver (+9) defeats Ron Bryant (+12)… but Seaver has a 1.45 ERA advantage. 1973 AL: Jim Palmer (+13) defeats Catfish Hunter (+16)… but Palmer has a 0.94 ERA advantage. 1972 NL: Steve Carlton… Read more »

Dr. Doom
Dr. Doom
20 days ago

In looking into it, the 1989 National League award seems to have gone to Mark Davis because… well, who else were you going to give it to? It’s a tough year. The guy who finished second was Mike Scott. Unlike NSB, I feel quite confident that Scott would’ve won the award, had Davis been ineligible. However… it’s a pretty weak year. Playing in a pretty notable pitcher’s park, Scott’s ERA of 3.10 is pretty pedestrian for a winner (110 ERA+)… but he was the league’s only 20-game winner. His K/9 rates had fallen since 1986: 10.0 to 8.5 to 7.8… Read more »

Bob Eno
Bob Eno
18 days ago
Reply to  Dr. Doom

I really enjoy this type of analysis, and I can’t really dispute anything in it because . . . how would I know what was in the minds of those voters that year? I don’t know, for example, whether they had any information about team run support, which was far higher for Scott than for any other pitchers who received votes — at the extremes: Houston’s 4.86 R/9 vs. Hershiser’s 3.19 R/9 support from the Bums. Scott did indeed pitch in a pitcher-friendly environment (PPf=97), but not because of the Astrodome (PPf=102). That one year the Astrodome was undergoing structural… Read more »

Doug
Doug
18 days ago
Reply to  Dr. Doom

Mark Davis was a surprise CYA winner, not least because he pitched for the Padres. Ordinarily, that would probably disqualify a pitcher from CYA consideration right off the hop, but the ’89 Padres did post an 89-73 record, just 3 games back of the division-leading Giants (though, that finish is somewhat misleading as those 3 games back were the closest the Padres had been since way back at the beginning of June). Anyway, since the voters looked past the San Diego connection to find Davis, presumably they also noticed his teammates, Ed Whitson and Bruce Hurst. I mention them because,… Read more »

Dr. Doom
Dr. Doom
20 days ago

One of the choices of a reliever as MVP that I think is just utterly different than all the others here is Willie Hernandez. In some ways, it’s easy to lump in with the others: it’s an American League Cy Young choice from the era when AL CY voters, for whatever reason(s), liked to pick relievers. Also, it had that age-old narrative for MVPs that you can see all over: a new guy joins a pretty established team, right as they break through to win the pennant… so you’ve got to give all the credit to the new guy, right?… Read more »

Doug
Doug
19 days ago
Reply to  Dr. Doom

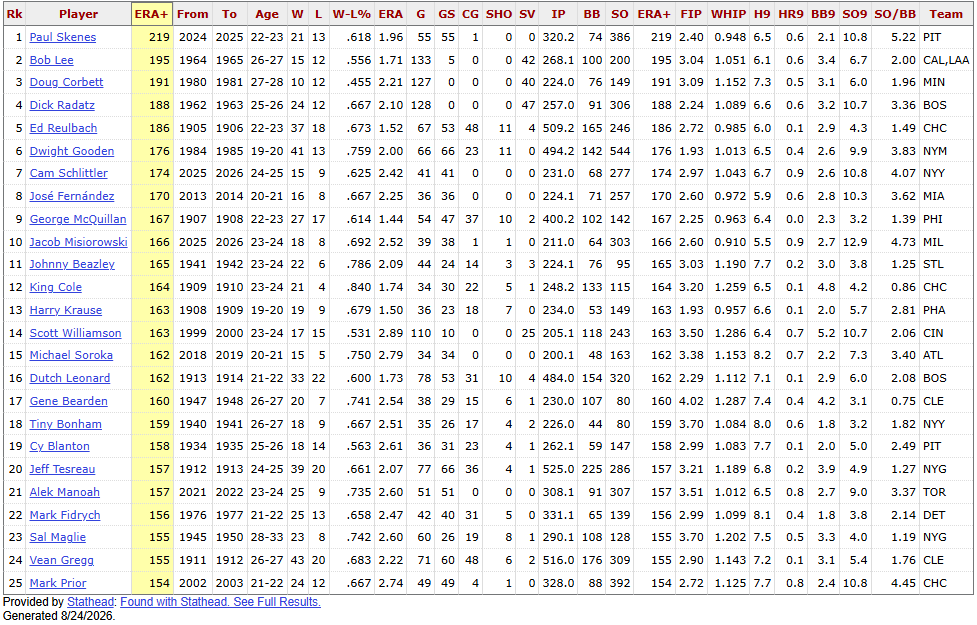
Re: Doug Corbett, he ranks 3rd on this list of the best ERA+ over the first two seasons of a modern era career, with a minimum 200 IP. Check out the two current 2nd year players who make the top ten (as of today).

Highest-ERA-First-Two-Seasons-Min-200-IP-Since-1900
no statistician but
no statistician but
19 days ago
Reply to  Doug

Doug: What I see on this list is something I was getting at in my series of comments on Rookie of the Year Awards last fall. First of all, the list has only one name on it whose career even approaches Hall of Fame status, and that is Gooden, but his career is simply a prolongation of what most of the others had, a red-hot start followed by decline, usually rapid and steep. Bearden, Prior, as you’ve noted above, Radatz, Krause, Fernandez, Etc., with Fidrych as the poster child of pitchers who burned out fast, after a remarkable start. Reulbach… Read more »

Dr. Doom
Dr. Doom
19 days ago

I disagree about Gooden being the only “near” Hall of Fame player; Dutch Leonard had a really nice career over 2 decades, and racked up nearly 50 WAR. It’s non-crazy to imagine him in the Hall, especially if he’d pitched for better teams, than the Senators, Cubs, and Phillies. Had he been a Yankee or something where he’d been playing October baseball regularly, you could imagine him in the Hall. Second, I think it’s a LITTLE unfair to call Jose Fernandez someone who faded, given that he died, but was still an excellent pitcher through year four. It is certainly… Read more »

Paul E
Paul E
19 days ago
Reply to  Dr. Doom

Not to be that guy but I believe you have the wrong Dutch Leonard

Dr. Doom
Dr. Doom
19 days ago
Reply to  Paul E

Ooooh, you are SO right! I didn’t even look at the years, just assumed it was the “good” Dutch Leonard! Good catch, and thanks for the correction.

Paul E
Paul E
19 days ago
Reply to  Dr. Doom

13 WAR for Dutch II with the piss-poor PHL in 1947-1948. Pretty impressive…. Dutch I had two impressive WS starts in the deadball era.
2200 IP and 115 ERA+ for Dutch I and 3200/119 for Dutch II. There WAR per IP rates are similar; the second guy just had a longer career

Doug
Doug
19 days ago

To your point, Bob Lee and Dick Radatz (#2 & #4) are the only pitchers with 15 saves and 100 IP in each of their first three seasons. Lee had 6 saves, 122 IP and 4.87 ERA the rest of his career. Radatz did the 15/100 bit for one more year, then had 22 saves, 155.1 IP and 5.04 ERA the rest of his career. Never heard of Lee before. He (1964-65), Minnie Rojas (1966-67) and Ken Tatum (1969-70) were Angel relievers with 150 IP and 30 saves over their first two seasons. Only twelve others have done it, none… Read more »

Last edited 19 days ago by Doug
no statistician but
no statistician but
15 days ago

A digression on Cal Raleigh. For a couple of games, in which he seemed to have regained his form, there seemed to be some hope for a reversal—four homers in five ABs and three walks. In the next game he struck out four times and yesterday twice, going 0/7 with one walk, so probably not. I haven’t dug into this, but could it be that pitchers around the league have discovered a weak spot in his batting? I can’t recall any similar situation among position players, going from a massively feared threat one season to the easy out in the… Read more »

Bob Eno
Bob Eno
15 days ago

The closest that comes to mind for me is Walt Dropo, 1950/1951. In 1950, Dropo’s slash line was .322/34/144, an easy ROY (those 34 HR were only three off the league-leading pace). In 1951 his slash was .239/11/57 (he was down in the Minors part of the year). Dropo played till 1961, but never recovered a fraction of the greatness his 1950 season had seemed to promise.

I think Raleigh’s collapse is more profound, and I hope he bounces back.

Last edited 15 days ago by Bob Eno
Tom
Tom
13 days ago
Reply to  Bob Eno

There are a few rookies whose performance dropped precipitously: Mitchell Paige, Mark Fydrich, Joe Black, Rick Suttcliffe, Bob Hamelin, Jonathan India, Joe Charboneau, Kyle Lewis… Then there’s Cody Bellinger going from an MVP, with 8.7 WAR in 2019 to -1.6 war in 2021, before reinventing himself into a steady 4 war player. Hack Wilson went from setting the NL HR record and the all-time RBI record in 1930 to a 0.7 war in 1931, rebounding to a 3.0 in 1932, then becoming a part-timer for two final years. The biggest dropoffs in the live ball era: Babe, from 11.3 in… Read more »

Last edited 13 days ago by Tom
Bob Eno
Bob Eno
15 days ago

Here’s another: Zoilo Versalles, 1965/1966. The collapse is different in form because Versalles was a shortstop and lead-off hitter. His slash went from .273/19/77, good for the MVP, to .249/7/36, but the most telling stat was Runs, which fell from 126 to 73. In fact, every aspect of his game collapsed: fielding, speed, power (his EBH total fell from 76 to 33). Versalles 1965/66 shows a total WAR drop from 7.2 to 1.3; Raleigh is currently down from 7.2 to 0.3 (he still has five weeks to, hopefully, add to the latter). Versalles drop was part inexplicable and part explained… Read more »

Last edited 15 days ago by Bob Eno
Dr. Doom
Dr. Doom
14 days ago

The biggest one-year gap in WAR – bigger, even, than Raleigh’s newly 7-WAR gap – I believe belongs to George Scott, from 1967-68. He went from a solid, 4.4-WAR and an OPS+ of 138 to a WAR of -2.8 and an OPS+ of 33 (<– not a typo). I bring this up because, whatever the issue may have been, he rallied to have multiple seasons with MVP votes, All-Star appearances, and/or Gold Gloves. I'm really hoping that's the kind of result we get from Raleigh. Of course, George Scott's disaster was his age-24 season, whereas Raleigh is already five years… Read more »

Dr. Doom
Dr. Doom
14 days ago
Reply to  Dr. Doom

I probably shouldn’t’ve said this was the biggest one-year drop in WAR. Obviously, some of those 19th century pitchers dropped like 10+ WAR year-over-year… but I’m talking about real baseball, like a recognizable form of the game happening in modern(-ish) times; let’s say… in the Live-Ball Era. Or maybe since Integration. I’m not sure… didn’t run a search. Was just naming this one from memory, so I could easily be wrong.

Dr. Doom
Dr. Doom
14 days ago
Reply to  Dr. Doom

Like, literally, for fun, I just looked up Charlie Buffinton, who lives in my head as one of those 19th-century innings-eaters. He had drops over over 7 WAR… four times! That includes back-to-back seasons! In 1884, bWAR has him at 15, but a “mere” 6.0 in 1885 (so down 9 WAR). And the very next year, it drops him to -1.8… another drop of 7.8 WAR! Then he recovered, became a 12-WAR pitcher by 1888, and had another stellar year in ’89 (11.3 WAR). Of course, the very next year, he dropped over 8 WAR, down to 2.7. But by… Read more »

Doug
Doug
14 days ago
Reply to  Dr. Doom

Not as big a drop as Scott’s, but similar story was Adam Dunn from 2010 to 2011. WAR went from +2.5 to -2.9, and OPS+ from 138 to 54. He got his OPS+ over 100 for his last three seasons, but failed to reach 2 WAR in any of them.

Dr. Doom
Dr. Doom
14 days ago

One more recent big drop-off in WAR: Alek Manoah. Remember him? Not a hitter, obviously, so not as directly comparable to Raleigh. But similar; Raleigh was the MVP runner-up, Manoah finished 3rd in the 2022 Cy Young race. Manoah was even the first pitcher out of the ‘pen in the All-Star game. He was respectably striking out about 3.5 times as many as he walked. He was a top-line Major League starter. By 2023… bupkis. His WAR dropped from 6.0 to -1.1 (Fangraphs wasn’t as high on him in ’22, nor as bearish on him in ’23, so the drop… Read more »

Doug
Doug
14 days ago
Reply to  Dr. Doom

Angels released Manoah after he posted a 16.14 ERA over 10 AAA starts, during which he barely average 3 IP.

Dr. Doom
Dr. Doom
14 days ago
Reply to  Doug

Yee-ikes! That is nuts. Had no idea. I thought he was out of baseball already until this afternoon.

Bob Eno
Bob Eno
14 days ago

Doom mentioned not realizing a pitcher who had hit hard times and dropped down to the Minors was back in the Majors — to return to a case from the last HHS string, I just discovered that Conner Thomas reemerged two weeks ago after being roughly discarded by the Braves last month. Recall that Thomas, after years in the Minors, had finally reached the Majors with the Brewers last year, at age 27, and this year was with the Braves. He pitched long relief in all of four of his games over two seasons, and established a peak performance of… Read more »

no statistician but
no statistician but
13 days ago
Reply to  Bob Eno

Bob: Here’s my question on a semi-related topic: Why? And my answer is, the current approach to pitching has passed the point at which supply can keep up with demand. More and more arms are needed simply to fill in the innings NOT pitched by others because those others, the starters, have again and again thrown too hard in their allotted 100 pitches and the stress, even in a five or six man rotation, has made them vulnerable to the extent of multiple trips to the DL. Added to that, in most games now the starter goes at most six… Read more »

Bob Eno
Bob Eno
13 days ago

As head and sole member of the Connor Thomas Fan Club I don’t have much to say about all this, nsb . . . But, of course, I always have much to say as an HHS poster. However, the problem you point to has so many different contributing factors that I don’t think any analysis that could fit in a comment string could scratch the surface. I think the end of the reserve clause had a lot to do with changes, as did the Moneyball approach of maximizing budget returns by viewing pitchers in terms of their component abilities, the… Read more »

Dr. Doom
Dr. Doom
13 days ago
Reply to  Bob Eno

I wouldn’t go so far as to say I was exactly “rolling my eyes at” old baseball. Merely pointing out that I’ve played a game in which a pitcher lobbed the ball underhand from 40 feet away. It was called softball. There are many softball players who are excellent athletes. I just think that the average baseball fan who lauds 19th-century performance – a game played by all-white players from the northeast with rules that don’t much resemble the modern ones, where pitchers threw 600 innings and batters chose where the pitch was coming and people didn’t wear gloves and… Read more »

no statistician but
no statistician but
13 days ago
Reply to  Dr. Doom

Doom: The fact is, that the majority of the players in those early times were from the Northeast, sort of, if you expand that to include the old Northwest Territory of Ohio, Indiana, Illinois, Michigan, and Wisconsin, plus Iowa, Missouri, Kentucky, and Virginia, because that’s where the majority of Americans lived. In 1900 only five of the nation’s fifty most populous cities were west of Omaha, only eight west of the Mississippi, if you discount St, Louis, Minneapolis, and New Orleans, which either border or straddle that waterway. Of those five in the West, San Francisco ranked ninth, overall, in… Read more »

Dr. Doom
Dr. Doom
13 days ago

Yeah, and that’s fair. I totally get that. There just aren’t that many people west of the Mississippi. I almost didn’t include that point for that reason. But I think it still does merit mentioning, because while it’s true that the vast majority of the population was out east, there were also tremendous talents (surely!) that never even got a shot because of geography. And truthfully, in many ways, that wasn’t really reconciled until the ’40s; the Pacific Coast League was pretty darn popular and attracted huge talents out west for a looooong time, keeping some players from MLB. But… Read more »

Bob Eno
Bob Eno
12 days ago
Reply to  Dr. Doom

Turns out we agree, Doom. I also feel that “modern baseball” (of which there are multiple eras) should be dated from 1893. (Turns out 30% of 19th century MLB was played in 1893-1899.)

Last edited 12 days ago by Bob Eno
Bob Eno
Bob Eno
12 days ago

More Batting Practice Home Runs News sites are agog about the Cubs’ 9 home runs last night in a game against the Brewers. Alex Bregman joined the 3-HR in One Game club. Phooey. The Cubs hit 6 HR against pitchers and then were treated to two innings of experienced position-player-turned-BP-pitcher, Andrew Vaughn, lobbing the ball in the cool of a summer evening. Bregman joined two teammates in whacking Vaughn’s tosses into the seats, while Vaughn looked surprised and unhappy and the Wrigley Field crowd roared with joy. Vaughn may have achieved something special, though: how many pitchers / “pitchers” have… Read more »

Paul E
Paul E
11 days ago
Reply to  Bob Eno

Bob, …..sounds like we need a mercy rule – 10-run lead after the 7th inning, game over? Give everyone their money back? Or, how about a free hot dog and soda coupon for the next game they attend? Perhaps we expand the rosters to 27 and make sure the two extra guys are AAA pitchers who can only pitch if their club is behind by 7+ runs after the 7th inning? I mean, why not? They already went all T-Ball on us with the runner on second base in the 10th inning…….. Let’s get creative, let’s find solutions, and let’s… Read more »

Doug
Doug
11 days ago
Reply to  Paul E

To Paul’s point, that extra roster spot for the minor league pitcher would be rotated every few days, so that pitcher can enjoy the experience (even if he isn’t called into action) and, so that one pitcher doesn’t sit around doing nothing for an extended period. Win-win, I’d say.

Bob Eno
Bob Eno
11 days ago
Reply to  Paul E

Paul, There is absolutely nothing to criticize in the ripe dogmatism of old age!! Arf Arf Arf !!! I see the merit in your roster idea (and did when you suggested it before), but I think it has no chance of adoption because it would require changes in the collective bargaining agreement for an issue solely of interest to fans. The current practice is one that neither actual pitchers or batters would object to, the fake pitchers are not professionally penalized for their amateur performance, and it has no effect on the managerial/coaching staff, front office, or ownership — unless… Read more »

Paul E
Paul E
11 days ago
Reply to  Bob Eno

Bob, Doug, It’s kind of odd how MLB followed HS and NCAA football with the “25 yard line approach” to a tie at the end of regulation. Creative, yes; but a bad idea overall. The PA Boxing Commission and/or No American Boxing Federation (IIRC) went to a 13th round if scorecards were tied. But the current 10th inning rule would be the equivalent of having the fighters stand in the center of the ring with their hands down taking turns at 3-punch combinations until someone dropped or was knocked out. As far as these “blow-out lobbers” are concerned, we’re probably… Read more »

Bob Eno
Bob Eno
10 days ago
Reply to  Paul E

Extra inning fake baserunners are no worse than the bubonic plague and better than eternal damnation. Really, much better — it’s important to keep things in perspective.

Scary Tuna
Scary Tuna
10 days ago
Reply to  Bob Eno

When you frame it like that, the automatic runner at second base seems WAY better now. Still evil, but better. Thanks, Bob!

Paul E
Paul E
6 days ago

Yesterday in their 4-3 defeat of the Yankees, the Padres scored all four of their runs on solo home runs. Does anyone have any idea if this is a ML record? I would think not….but, quien sabe?

Scary Tuna
Scary Tuna
6 days ago
Reply to  Paul E

Paul, the record is seven by the LA Angels on 08/04/22 in an 8-7 loss to the Oakland Athletics.

The A’s had set the previous record of six on 08/03/91, which the Tito to Blue Jays tied on 05/21/19.

Paul E
Paul E
5 days ago
Reply to  Scary Tuna

Tuna,

Thank you for the quick response – seven solo shots is incredible!!

trackback

[…] Part 1 of this series, nsb conjectured on what the Cy Young votes would have been had only starting […]