
Here’s a group of accomplished pitchers who enjoy the distinction of a certain career accomplishment of which no other retired modern era pitcher can boast. More specifically, they did something twice in their careers that every other pitcher has done only once or, in most cases, not at all. The list and a clue are after the jump.
Here’s the list. Your job to is to identify the career feat that has been accomplished in the modern era by only these eleven retired pitchers.
| Rk | Player |
|---|---|
| 1 | Lefty Grove |
| 2 | Roger Clemens |
| 3 | Randy Johnson |
| 4 | Grover Alexander |
| 5 | Mike Mussina |
| 6 | Jon Lester |
| 7 | Tim Hudson |
| 8 | Lon Warneke |
| 9 | David Cone |
| 10 | Tom Seaver |
| 11 | Wes Ferrell |
First clue is that there are currently two active pitchers who are very likely to join this group once they retire (which shouldn’t be very much longer). Your other clue is that, Wes Ferrell‘s appearance on the list notwithstanding, the answer really is about pitching.


I used a threshold of 100 decisions, but if 60 wins gives the same result, that’s fine with me.
One other closely related piece of the puzzle that almost goes without saying, but should say it anyway. Hint: if we did use 50 wins instead of 60, Halladay would qualify but not Schilling or Greinke because they don’t have this other piece.
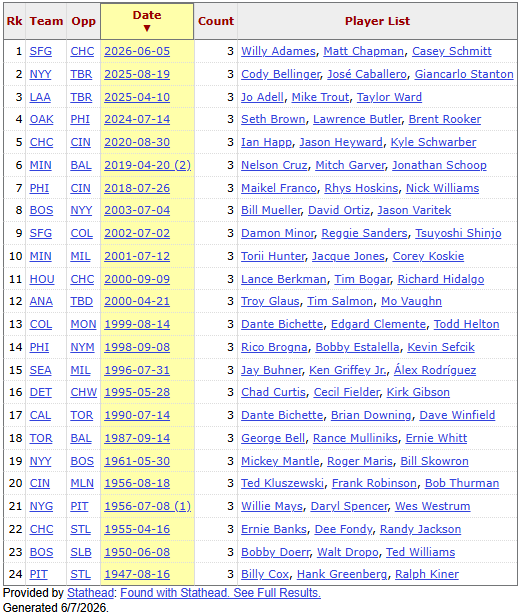
The Giants have had an interesting week, with run totals of 1, 2, 2, 3, 12, 18 and 19 (not in that order) in their last 7 games. Their 18-3 thrashing of the Cubs on Friday was the 24th searchable game in which a team has had three players with multiple home runs. — Seven franchises account for 16 of those games, with the Giants now joining the Angels with three games, followed by the Red Sox, Cubs, Twins, Yankees and Phillies with two. — The Rays and Browns/Orioles have been victims of such an onslaught three times, followed by… Read more »
I happened to glance at the Dodgers-Angels box score for last night (6-6-26) and noticed that Yamamoto pitched eight full innings. Further examination revealed that he threw just 93 pitches. The secret? Fourteen groundouts, just four Ks. No walks. Game duration 2:24, despite a 12 batter go around for the Dodgers that produced all nine of their runs.
In Sunday’s series finale was the most unusual 5-1-5-6 box score line, belonging to Angel catcher Sebastian Rivero (who raised his batting average by 87 points with his 5 for 5 game). Just the seventh such game, and the first by a catcher or by any player batting 9th. Of the first six games, five were by “name” players. Here’s the list. Not having as much fun was Mike Trout with the second 6-0-0-0 of his career, and the first in a 9 inning game. Trout entered the game with a BA 99 points higher than Rivero’s. Now, his .226… Read more »

Yesterday, the Angels 6-9 hitters combined to to 13-15 with 4 walks. Jo Adell had a massive 433- ft HR. Nick Madrigal resurrected from wherever it is he went to walk on a 15 pitch AB in the 2nd inning (winning two ABS challenges), walk on an 6 pitch ab in the 4th, and walk on a 12 pitch ab in the 5th. And then there’s Sebastian Rivero, who Doug already wrote about.
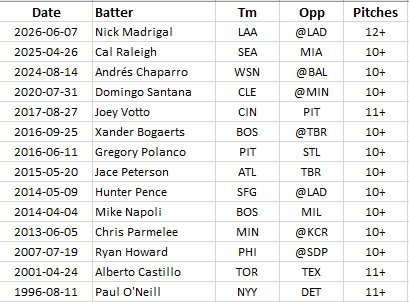
The Angels became the 17th team to score 13+ runs and have more strikeouts than runs, and the 9th team to do so in a 9 inning game. Their 4 XBH are the fewest of those teams. Here’s that list.

Happened to notice that “The Big Amish” currently leads the AL in RBI, BB, and OBA through 68 team games. This, according to my suspect research, has only happened 14 times previously (in the live-ball era). Something along the lines of:
4 Ruth
3 Williams
2 Judge
1 Foxx
1 Kiner
1 Killebrew
1 Allen
1 Schmidt
Mayberry’s three 25 HR/100 RBI seasons are still the most by a Royal, tied with Danny Tartabull and Salvador Perez. Tartabull garnered 3.8 WAA for his career, tops among players with negative dWAR amounting to more than half of their positive oWAR (i.e. dWAR less than -0.5 * oWAR). Second was Greg Luzinski with 2.3 WAA. In terms of oWAR it was Luzinksi first and Tartabull second. But some of the worst ratios belong to two more Phillies (yes Tartabull was a Phillie too, however briefly): — Deron Johnson 12.4 oWAR, -15 dWAR, worst dWAR/oWAR ratio among players with 10+… Read more »
The Phillies were pretty bad from 1969-1973. Johnson was a former Brave that GM John Quinn , naturally, had to take a flyer on…. and, for the most part, it worked out. Except, Luzinski should have been on 1B his entire career. With Johnson at 1B and forcing Luzinski to play LF, the Bull suffered a serious knee injury in 1974 (IIRC) running into a tarp chasing a foul ball down the LF line….further limiting his range for the next 10 years. Montanez was the throw-in/replacement for pioneering Curt Flood in the Allen trade. He was a Vic Power clone… Read more »
Re: the ’65 Reds.
Quite the offensive juggernaut, with 5 players having 4+ WAR and 7 with 3+ WAR. They scored 825 runs, with the Braves a very distant second with only 708.
But that Reds team had only half of a rotation, with Ellis, Maloney and Nuxhall as a swingman. Pitchers with ERA+ under 90 accounted for over 40% of the team’s IP, including 23% of innings by pitchers with ERA+ under 80. Thus, they finished in 4th place, albeit 16 games over .500.
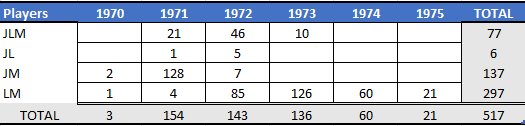
Kurtz still has 6 games to improve on these totals, but here is where he stands as of Jun 21st for totals over the first 200 games of a career.
5th – BB, OBP, OPS, ISO
7th – SLG
9th – HR
This is despite ranking 42nd in PA and 110th in AB (he’ll probably move up about 20 spots in PA and 25 in AB once he gets his 200 games in).
Jacob Misiorowski’s one-hitter on June 12th is just the fifth CG allowing one hit or less with 15+ K’s and zero walks. His 100 game score is the twelfth since 1988 with triple digits in a CG, all of which were one hit or no hit shutouts. It’s also the first 100+ game score in a CG with as many or fewer pitches.

One other note on Misiorowski’s game. His 77.9% strike rate is the highest since 1988 in any 9 inning shutout allowing one hit or less. There have been 296 such games to date.

I was looking at B-R leader charts and opened one I rarely if ever check: highest paid players. There, in fourth place was Stephen Strasburg, earning $35,000,000 for the 2026 season. After staring at that figure for a few seconds I concluded that either B-R was broken or I was: I was sure Strasburg was long retired. Turns out, as everyone else here may know, that Strasburg is long retired but his incredibly lucrative contract lives on. His last year with any significant accomplishment was pre-pandemic — he pitched a total of 31.1 innings in this decade (with a 6.89… Read more »
Bob,
Re Strasburg and the $245M , I’m sure some insurance carrier got stuck with 80% of that tab. I could type for the next two hours about salaries and impact on Joe Average and his family of four out for a Sunday game but the $30 for three-four hours of parking is just the beginning of the poor guy’s problems.
Happy Father’s Day!!
The other aspect of this is what is the motivation for a player to spend more than half of each year at work at the ballpark just about every day? In quainter times, the answer of course was the financial rewards of doing so. But when those rewards enrich a player almost immediately far beyond any conceivable needs, what added motivation is there in acquiring ever more of something of which he already enjoys an exorbitant surplus? To presumably ensure that at least some motivation remains (and because it’s more financially viable for the teams), these contracts are usually structured… Read more »
I’ve been giving a lot of thought to this comment, Doug. Its implications go far beyond baseball. There are a range of different ways in which people are motivated by money and by rewards of accomplishment, competition, and prestige. I was an academic and one of the things I found interesting about that life was observing the variety of responses to receiving tenure — essentially ironclad career-long job security. (At least it was back then.) Some colleagues became slackers, including a few extreme cases, but the majority continued working with maximum effort because of social and intellectual incentives, and a… Read more »
Doug, if you’re 22 years old and did your 3-4 years and reached free agent eligibility in the NBA already (or 28 y. o. and did the 6-year MLB thing), they throw 9-figure contracts at you in free agency. If you’re the athlete, you gotta believe your game is good enough/satisfactory (a la Ben Simmons) despite obvious holes. What is the motivation to improve if the new employer makes you wealthier beyond expectation. “obviously, I’m good enough, right.” Ben Simmons couldn’t even shoot foul shots – let alone shoot from the field. Pete Alonso isn’t going to hit .300 or… Read more »
To your point about not leaving money on the table, back-end loading makes that aspect even more compelling as the player’s rationale is that “the team has been underpaying me for the first 10 years, now it’s my turn to collect”. I hope the players on these types of deals have some good causes to which their money will go, because they surely will never spend it but a tiny fraction of it. I had thought that maybe Larry Walker was somebody who had walked away before his contract was done, but not so. Instead, his deal expired, intelligently, at… Read more »
Doom, Yes, few and far between. Kind of surprising that more guys haven’t walked away considering the injuries could last a lifetime and hinder one’s golfgame in retirement (hahaha). IIRC, Bagwell refused to quit despite a useless shoulder? From ‘The Atlantic’ in a 2025 article: “Heading into the offseason of the fifth and final year of the contract, Meche and Moore had agreed that Meche would pitch out of the bullpen. Then Moore received the call from Meche that afternoon in 2011 to announce his retirement and walk away from the remaining $12 million on his contract. “Gil’s exact words… Read more »
I. Reverting to comments in the previous thread, but having a weird relevance, I would say, to the subject of long-term contracts, here is some additional data on career plate appearances over time. NB: Rather than producing a table of over 200 lines, I’m summarizing my findings. You’ll have to trust me, in other words. At this point there have been 87 players with over 10,000 career plate appearances in the majors. All are retired. Of the 87, one debuted in the 1870s. One in the 1880s. Five in the 1890s. Five in the 1900s. Five in the 1910s. Three… Read more »
nsb, Just spotted this. Some quick thoughts: Players debuting in the late 1920s through the mid-1940s very frequently had somewhat shorter careers because of Wartime service. Players with long careers debuting in the 1950s and after had seasons about 5% longer than their predecessors. Total numbers of players continually rises in steps after 1960, with total player numbers increasing by about 87% over the period 1961-1998 and the DH essentially adding a “position player” slot (though I believe marginal roster shifts away from roster position players to pitchers has recently blunted the effect on career PAs). The implication of your… Read more »
Bob: I hadn’t considered the DH as a factor, but it is obviously so, post 1973. Another factor to account for the jump that occurs mid century is the increase from 154 to 162 games per team per season that the first expansion created in 1961-62. The expansion to 28 teams in 1977, I think, largely accounts for the 55 players from the 1980-1990 generation (27.5%) who are listed in the top 200 in PAs all-time. What nothing accounts for, or so say I, is the fact that the succeeding generation, with 30 teams at play, produced only 9 of… Read more »
The Blue Jays scored 9 in that situation, in this game. They recorded 9 straight hits after the first two batters were retired, but they were batting against position players.
I asked my good friend Al (I call him Alfred–just a little joke we share). He told me that the 1901 Cleveland Blues had done just what the Phillies did. I said to him (as I generally do), “Al ol’ buddy, could you please go back and check.” And, as is so often the case, he said, “Sorry, that was wrong. Please forgive me!” I always forgive him because I know he suffers terrible anguish if I don’t. Alfred than offered some close matches that were not very interesting. But also one that was: Pittsburgh on July 28, 2001. The… Read more »
Another interesting one was on Aug 21, 1990 when the Phillies scored 9 in the 9th inning to edge the Dodgers 12-11. Dale Murphy’s 2-run double made the scored 11-8, with one out and runners at 2nd and 3rd, but that only raised the Phillies win expectancy to 10%. But, John Kruk’s game-tying 3-run blast added 34% to the win probability and Carmelo Martinez’s go-ahead solo shot added another 30%. Don Carman pitched the bottom of the inning to collect his only save of the season. Fernando Valenzuela appeared in the game as a pinch-hitter, and only as a pinch-hitter.… Read more »
Bob, That’s “Hall of Fame” closer Billy Wagner 🙂 Still, Nats mop-upper (or is it ‘mopper-uper’?) ‘mop-up guy’ Paxton Schultz is a veteran of 575 professional innings pitched and hardly a soft-tossing middle infielder in a 16 – 3 rout. Obviously the last choice (#7 of 7 relievers) out of the bullpen, but have some respect for a man and his profession FCS. As far as your buddy Alfred, based on Micron’s earnings and guidance last night, I think Alfred is gonna be here for the forseeable future. There’s gold in them there hills, Kimosabe Herewith, please find Wagner at… Read more »
Paul, Sure Wagner’s in the Hall, but he wasn’t in 2001. HoF pitchers can have good years and bad years. When Wagner was sent into the 6/28 game in the 9th he was having a very good year and had pitched in the All-Star Game just a week or two earlier. The term “mop-up man” has been in use since I was a kid 70 years ago. It denotes a pitcher whose role on the roster is frequently to eat lost-cause innings that would pointlessly inflict wear and tear on the arms of the rest of the staff. Schultz in… Read more »
Bob, I did advocate Wagner for the “Circle of Greats” in the belief that he had a Hall of Fame career. I believe the ‘Circle’ standards are a wee bit different for position players than pitchers, particularly relief pitchers. I don’t believe Kaat is a ‘Circle’ guy despite his GG’s and I don’t think anyone (i.e. a GM) would evaluate a reliever based on his fielding either. Wagner was a force, a great player who performed the duties of his position. I am a big fan of Wagner despite having Row 7 seats on the 1B line closer to home… Read more »
An enjoyable piece of irony: In yesterday’s 22-1 ChiSox royal stomp, the most successful Royals pitcher (apart from “opener” Steven Cruz) was Tyler Tolbert, who pitched the scoreless 8th (and final) Sox turn at bat (despite collecting a grand total of one called or swinging strike among the four batters he faced). I found no video of Tolbert dousing the Chicago fire, but video from another mound appearance this season confirms that he is a “soft-tossing middle infielder.”
Tolbert’s outstanding pitching feat lowered his season (and career) ERA to 17.18.
Speaking of those ChiSox, the year before last at this point in the season they were 21-61 and finished with 41 wins. Their current win total is 42 and they lead the AL Central. Andrew Benintendi is the only carryover from that hapless 2024 squad, and the current average age of starting position players is 24, Japanese import Murakami, who began with such a flourish but is currently on the DL, had no part in yesterday’s slugfest, but his call-up replacement, Jacob Gonzalez, went three for five with a double, three-run HR, and five RBIs.
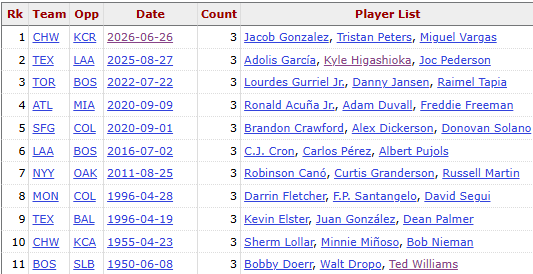
I’m mainly interested in the earliest two games cited, Bosox-Browns, 1950; Chisox-As, 1955. Both winning teams scored 29 Runs, a post-1900 record that was finally topped in 2012, and has been matched once in 2020. The 1950 Red Sox were an offensive powerhouse in a hitter’s year, the last team to bat over .300 in a season, scoring 1027 runs (113 more than the Yankees and 190 more than the Tigers, the two teams ahead of them in the final standings), even though Ted Williams missed two months with a broken elbow. The 1955 White Sox, in a more subdued… Read more »
The Royals AAA team in Kansas City had consecutive losses totaling 35 – 3. In a somewhat strange anomaly, the Royals currently sport the worst record in the AL despite having the ‘best’ player in the AL (per WAR), Bobby Witt.
Has this “contradiction/odd dichotomy’ ever happened over a full season?
to answer my own question, apparently it has. In 1989 the Atlanta Braves helped revive the career of Lonnie Smith to such a degree that WAR fell in love with him as he paced the NL with 8.8 WAR in a mere 134 games played. The Turners finished an NL worst 63-97-1.
Ralph Kiner led the Pirates to a 62-92 tied-for-last finish in 1947. He led the NL with 8.1 WAR. Rogers Hornsby led the NL in War in 1918 and the Cards finished in the cellar. I haven’t checked the AL

Apropos of nothing: Oh, B-R War. I don’t know what to do with you at this point. Here’s what you’ve got to know, before you go off criticizing anything I write below. 1.) I am a Brewers fan; I AM biased. I don’t deny it. 2.) I LOVE Christopher Sanchez. He’s amazing, and I want good things for him, including to start the All-Star game, because it’s in Philadelphia, and I think it’s cool to let a hometown player start the All-Star game. 3.) Unquestionably, Jacob Misiorowski is having a better season than Christopher Sanchez, and the fact that Baseball-Reference… Read more »
Doom, Personally, I trust offensive metrics WAAAYYYY more than fielding when it comes to WAR. It sounds to me like you’ve uncovered that those “highly interpretable” fielding skills are pretty friggin’ subjective and those suspect evaluations are bleeding into pitching metrics. I know Alec Bohm isn’t Matt Chapman at 3B. Just watching Bohm tripping over his own two feet and Chapman looking like Nettles/Bell/Robinson on every ball hit in his ‘area’, tells you all you need to know about their levels of skill. I just have a real difficult time ‘quantifying’ the difference. But, the guys at the WAR Machine… Read more »
Hi Doom. My understanding is that the defense component of pWAR is not calculated on the basis of defensive performance behind the pitcher in question, but in terms of team season defensive figures as calculated through the methodology of Total Zone Runs, which is explained on the site. Philadelphia’s team defense is currently tied with the Rockies for worst in the NL (-42 Rtot), while the Brewers’ team defense is tied for fourth best (+25 Rtot). (I don’t think TZR is the best data out there, but B-R seems to like it because the methodology can be projected back historically,… Read more »
I understand how the defensive component of WAR is calculated; I’m not misunderstanding it. I’m disagreeing with it. My understanding is that DRS is used for seasons since 2003, not TotalZone. So I think your second point is not quite correct. They used to use TotalZone for all seasons, but I think that changed ~10 years ago, maybe? Furthermore, your point that “WAR doesn’t evaluate who is the best pitcher,” is technically correct… though I didn’t claim that it does. It IS supposed to measure accurately which pitcher has been better at saving runs. That is the goal. Fangraphs beliefs… Read more »
About a year ago, in the thread under Doug’s post “Raleigh’s Really Rocking,” I presented a long series of statistical entries concerning pitchers’ career data in an attempt to put pWAR into a broader perspective by showing, basically, that its one-big-number approach not only doesn’t tell nearly the whole story about pitchers within eras, but is impossible to rely on as a tool to evaluate pitchers cross era. In other words, you are not alone in your dissatisfaction with pWar. In earlier posts I have pointed out the weakness of pWar in some other aspects, notably it’s over-rewarding of pitchers… Read more »
There seems to be something in particular about the 1960s (and into the 1970s) where the results are really weird. 1967 AL – why Jim Merritt? 1962 in both leagues – what is even happening? Bill James did a really great breakdown on his old site going over all the results and how weird and counterintuitive they are. I suspect that these defensive evaluations, mixed with ballpark factors, mixed with SO many balls in play (relative to today’s game), makes for really over-emphasized results – particularly for bad defensive teams, not just teams with losing records. Interestingly, this is basically… Read more »
We have this disagreement regularly, nsb. Let’s look at Ford vs. Kralick in 1961, an amazingly counterintuitive WAR result. (I think I discussed Cardwell in a past post.) WAR knows nothing about W-L, neither the pitcher’s nor the team’s. It measures runs allowed per 9 IP, the strength of opposition (in terms of its season R/9), the contributions of the pitcher’s partners in defense, and the degree to which the specific parks the pitchers pitched in helped the defense. It then adjusts pWAR volume for total IP. Here’s Ford vs. Kralick in 1961 Kralick’s IP=1.0): …………….RA/9…..opp R/9……. def RA/9 value… Read more »
Some additional Ford/Kralick 1961 Stats Advantage to Kralick in underlined italics. Two ties. All others to Ford. (Led league in bold.) Ford/Kralick ERA 3.21/ 3.61 ERA+ 115/117 FIP 3.14/3.40 WHIP 1.18/1.33 H9 7.7/9.6 BB9 2.9/ 2.4 SO9 6.7/5.1 SO/BB 2.27/2.14 HR9 0.73/1.10 PR 20/20 PW 2.1/2.0 RE24 35.74/30.50 WPA 3.2/2.5 WPA/LI 4.0/1.5 REW 3.9/3.1 QS% 62/55 Wchp 7/ 5 Ltuf 4/4 Note: Ford only had four losses Key: PR—Pitching Runs; PW—Pitching Wins; RE24—Base-Out Runs Saved; WPA—Win Probability Added; WPA/LI Situational Wins Saved; REW—Base-Out Wins Saved. QS%—Quality Start Percentage; Wchp—Cheap wins; Ltuf—tough losses Several things stand out about Ford’s 1961 performance: His record against winning teams (of which there were only three… Read more »
This is a good reply, nsb, and it forces me to think. One of my first thoughts is your description of Ford vs. the Tigers expresses two things I’ve said many times about pWAR: it’s a statistical starting point for discussion of overall quality — in my view the best available — not an endpoint. What prompts that is your valid description of Ford’s performance against the Tigers, who were the Yankees’ only real challenger that year. The single 10-run outing aside, Ford was exceptionally strong. But there is no statistic that reflects that kind of information. It’s part of… Read more »
Bob, “…..If we include those by considering opponents’ adjusted strength it means that Ford’s Yankees were generating those 5.74 runs per nine against opponents expected to score 4.19 (thus, +1.55)…” Interestingly enough, if we go all Pythagorus on Ford’s numbers that you have cited, we get 25.44 wins in Ford’s 39 games. But, we should also get 14.56 losses (in lieu of a mere 4). Perhaps Arroyo and the bullpen are the real saviors for the ’61 Yankees? I didn’t check Win Shares but some other sources for 1961 AL include: Retrosheet “PW” (Pitching Wins, I suppose) 4.4 Arroyo 3.3… Read more »
I’m not sure there’s an answer to why Kralick went only 13-11, Paul. Looking at his nine NDs there doesn’t seem to be any single pattern that stands out, and he went 10-1 in his CGs so that type of hard-luck loss was rare. (He did take a loss when asked to pitch into the 11th inning of a low-run tie game.) But WAR doesn’t consider stats in game units, only in aggregate, so if there were a single reason it’s unlikely it (or any such system) would pick it up. And when it comes to W-L records there are… Read more »
So, back to 1961 and NSB’s WAR dilemma: AL Win Shares 22 Ford 22 Lary 20 Mossi 18 Pizarro 17 Pascual 17 Kralick 16 Hoeft NL Win Shares 25 Spahn 22 O’Toole 20 Koufax 20 Joey Jay 19 Drysdale (Don, not Milburn) 18 Miller 18 Gibson 17 Simmons 16 Cardwell I tried to go as far down as possible to include the guys that were mentioned in the other ‘evaluation’ systems. Years ago a buddy claimed I was anti-Semitic for mentioning Dick Ellsworth had a better year than Koufax in 1963 per Win Shares….. so much for attempts at objective… Read more »
I suspect you’re right about Win Shares in ’63, Paul. I see Koufax had 32.04 and Ellsworth had 31.94. Since the big flaw in Win Shares is that it allocates it to team members on the basis of 3xTeam-wins, Koufax has an inherent advantage of 51 extra Win Shares to draw on. (Still, those absolute numbers of pitcher Win Shares are awesome; we see nothing approaching them in ’61.) pWAR is not far off, awarding Koufax 10.7 and Ellsworth 10.2 in 1963 (they were both at 9.9 in total WAR, which tells you something about their relative skill at the… Read more »
Some final comments on the subject of pWAR weakness. Somehow my citing of Kralick and Cardwell ’61 as examples of the way pWAR over-rewards good pitching seasons on poor teams has first been narrowed to Kralick and then turned into a discussion of Kralick’s superiority to Whitey Ford in that season, not of the anomalys of pWAR, or even a questioning of whether they exist. My response was not intended to make out that Ford necessarily had a better season than Kralick but to give evidence that he was the better pitcher in enough significant ways to undercut what pWAR was… Read more »
Sorry to be late to the discussion. Looking at how pWAR is calculated, strikeouts come into play only when the expected runs allowed is adjusted for team defense. The approach taken is to apportion the total balls in play allowed by the team among its different pitchers. xRA_def = (BIP_pitcher)/(BIP_team) * TeamDefensiveRunsSaved So, pitchers with higher strikeouts will allow fewer balls in play and thus get a lower share of the team’s defensive runs saved. That’s good if the team has negative TeamDRS, but actually works against a high strikeout pitcher relative to a lower strikeout pitcher if the team… Read more »
Just to be completely clear. In this equation xRA_def = (BIP_pitcher)/(BIP_team) * TeamDefensiveRunsSaved xRA_def (expected runs allowed attributed to defense) is added to the starting calculation of a pitcher’s runs above/below average, that is, the pitcher’s actual runs allowed minus an average pitcher’s expected runs allowed against the same opponents. So, if the TeamDRS is positive, the pitcher’s runs allowed is increased to normalize to an average defense behind the pitcher. And, if the TeamDRS is negative, adding it to the pitcher’s runs allowed reduces those runs allowed to again normalize to an average defense. Just wanted to be clear… Read more »
nsb, I owe you an apology for jumping to the specific case of Kralick vs. Ford when you had used Kralick alone as an example of a general failing of pWAR. I selected the Ford/Kralick comparison as one of the most blatantly counterintuitive results in pWAR, and thus as a prime ground to explore the way the stat diverges from intuitive assessments and offers certain strengths. I meant my example to be a head-on defense of pWAR, although I didn’t realize you were looking for a defense in precisely the way you describe here. Your response was perfect because it… Read more »
Bob, The Drysdales were, obviously, neighbors and I just thought it best I clarify. You’ve just about summed it all up. These systems all seem to have their own foibles/shortcomings. What’s interesting is that in many cases Win Shares and WAR concur on the best hitters at the end of a season or over the course of careers. Regarding pWAR, NSB has found some idiosyncratic, counterintuitive evaluations in the pitching data …. Doom as well. Me? I’m still stuck on the BBWAA ignoring Larry Walker’s numbers away from Colorado 🙁 Supposedly, Bill James was once asked something along the lines… Read more »
This is the same issue, over and over. pWAR will always discount basic runs allowed by assessing the quality of defense (based on season performance) handling BIP (volume adjusted), and adding in park factors. (In this case, strength of opposition is virtually equivalent.) In this particular instance there is an odd feature of Mis’s record. Despite having a generally strong defensive team behind him, he has allowed 7 UER beyond his 20 ER, while Wheeler, despite having a poor defensive team behind him, has allowed no UER at all (with 22 ER). So although Mis’s ERA is far superior, his… Read more »
Bob, “Mis appears to be a generational talent right out of the box. Right now he’d be my clear choice for CYA in a very tough field.” We shall see how this plays out thru 162 games. In the second half of last season: Mizz batters against: .257/.354/.401 NL Batters for the entire year: .246/.321/.406 Sorry, I couldn’t find league splits and had to use the entire season. Mizz, 1st half: 2025 .138/.235/.287 2026 .148/.219/.231 Through the capitalist miracle of subscription television, I did witness the Phillies’ futility versus Mizz when he fanned 15, walked 0, surrendered 1 hit in… Read more »
The two Alexes faced each other twenty times from 2000 to 2006, but only twice were they in the same batting order position (both batted 7th in their first two meetings). Here’s the list.
On May 11, 1999 the Mets played the Rockies. Mets starter Bobby Jones got into trouble early but pitched into the sixth. Rockies starter Bobby Jones left the game after five. In the end, the winning pitcher was Bobby Jones, while loser Bobby Jones was charged with 8 runs. Bobby Jones was traded to the Mets for the 2000 season; the Mets traded him to the Padres in the middle of the 2002 season. Bobby Jones had been traded by the Mets to the Padres for the 2001 season and his MLB career ended for good in San Diego in… Read more »
There was also a matchup of Bob Smith the pitcher and Bobby Smith the outfielder, with Bobby going 0 for 2 against Bob on June 4, 1957.
Will Smith the pitcher and Will Smith the catcher have played on opposing teams in 8 regular season and 7 post-season games. In batter vs pitcher matchups, catcher Smith is 0 for 4 in the regular season, and 1 for 3 in the post, with that 1 being a 3-run HR for 0.34 WPA in game 5 of the 2020 NLCS, the knock that started LA’s comeback from 3-1 down in the series and 2-1 down in the sixth inning of that game.
Chris Davis and Khris Davis faced each other 24 times, including six times that both batted cleanup.
The two right-handers, starter Roberto Hernandez and reliever Roberto Hernandez, had a brief career overlap, but long enough for the two to be teammates on the 2007 Indians and also to have faced other in this May 20, 2006 inter-league game.
Sign of the times. The Marlins took out their starter, Eury Perez, on Sunday after he had pitched 7 perfect innings. He was at 92 pitches, so probably heading to 115-120 if he stays in the game. Is that really unacceptable pitcher abuse? Surely not, if the guy has a shot at a no-no! Incidentally, the Marlins were leading 8-0 at the time. They brought in Lake Bachar to replace Perez, and Bachar threw 26 pitches, didn’t record an out and allowed 5 runs. Marlins ended up winning the game 9-8, with Bachar and Pete Fairbanks needing 55 pitched to… Read more »
A completely different decision by Toronto with Dylan Cease on July 8th against the Giants. No-hitter through 7 innings and 106 pitches, no hitter through 8 innings and 115 pitches, surrenders leadoff single in 9th. It’s the second time Cease has had a no-hitter broken up in the 9th inning, in addition to the one no-hitter he has already pitched.
In Toronto’s 3 games July 4-6, they had a total of 7 hits and 11 baserunners. Only the fifth team to fail to break either of those marks over three straight games.

Doug,
And how about Tyler Tolbert with hits 12 consecutive PA’s? Geeze, you can’t steal first base but he certainly had more than a few infield hits in that mix.
After surrendering a total of 35 runs in consecutive games less than a fortnight ago, the Royals have managed to score 31 in their last two contests.
The Blue Jays made a sudden about turn as well, scoring 18 runs over their next two games. Like Yogi must have said – baseball is a funny game … Tolbert’s twelve consecutive hits ties the MLB record. The others (according to AI) with hits in 12 consecutive AB are: — Johnny Kling: Aug 24-28, 1902 (13 for 15 in 3 games, with 5 for 5 in middle game, so it’s possible but no PBP, so cant confirm; no mention in Charlton Chronology) — Pinky Higgins: Jun 19-21, 1938 (12 hits & 2 walks in 14 PA) — Walt Dropo:… Read more »
Mike Benjamin’s hot streak in 1995 in started on 6/10 and ended on 6/17. In that time, he had 19 hits, 2 doubles, 2 hrs, 3 sb, 8 RBI in 7 games, .528/.541/.750. He played 7 of his 13 years with the Giants. The totals for his SF career: .196/.250/.308. Apart from that one week explosion, over 299 games with the Giants, he hit .176/.262/.281.
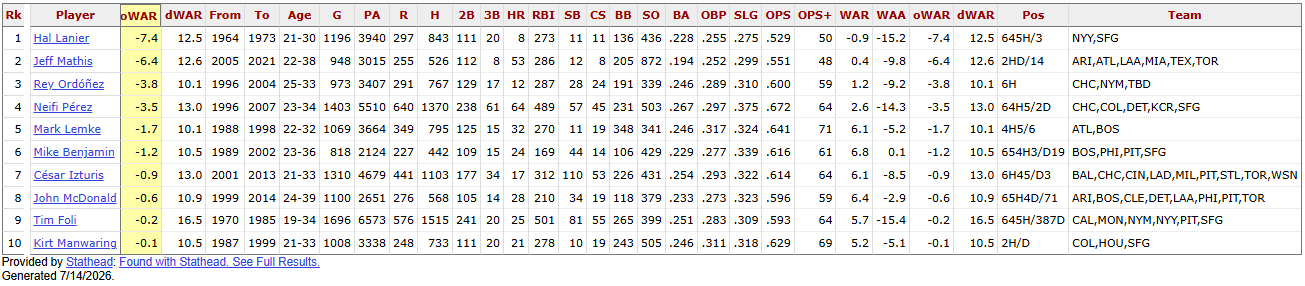
Tolbert is currently batting .337 over the first 94 games of his career, on pace to break the Royals franchise record of a .323 BA over the first 100 games of a career, currently held by Sal Perez and Mike Aviles. Five hits over Tolbert’s next 6 games should be enough to break the record.
This is apropos of nothing… but here are seven things I’ll be watching in the second half: –100 wins. Did you know that no team has won 100 games in the last two seasons combined? From 2015-2023 (with the exception, of course, of the COVID season), there was at least one 100-win team every year, and there were in fact at least three such teams from 2017-2023. But 2024 and 2025? None. Can a team do it this year? The Brewers (.637) and Dodgers (.645) are the only teams above the requisite .617 winning % to get to 100 wins.… Read more »
Nice list. The Yankees could be formidable if they can get Judge and Stanton back before September. Max Fried should be back before then, and if Gerrit Cole can round into form … But, those are a lot of ifs. Cole is a bit concerning, allowing 2+ ER in 6 IP or less in each of his last six starts, the longest such streak of his career, with his 30 IP over that stretch his 3rd lowest total over any 6 consecutive starts. Speaking of concern, the Pirates may be fretting more than a little about Paul Skenes. On pace… Read more »
Doom’s interesting post’s first item — noting that no team won 100 games in 2024-2025 — piqued my interest, because in those two years there were certainly teams that lost 100 games, big time. It’s normal that when there are teams with very high numbers of losses there are also teams with high numbers of wins. Not so in 2024-2025. Moreover, both the ’24 ChiSox and the ’25 Rockies managed to finish 50 games behind their division leaders, without those leaders winning 100 games. I asked my buddy Al (for Alfred) to identify all teams that finished 50 or more… Read more »
Thanks, Doug. Alfred offered several groveling apologies, repeated his search, and still missed Boston in 1911. I started again with a new Alfred. After many go rounds of mistakes I got it to formulate a protocol for formulating instructions that would force correct answers to baseball questions like this. I’ll try it out later and see whether it works, and if it does I’ll pass it along.
Am I correct in thinking you used Stathead? Alfred is just Google AI.
I’m sorry to report that there seems to be no way to get Google AI to do any detailed search on B-R. When I tried out the very clear query protocol that AI had designed for me, an alternative AI failed to follow it. And when I queried that second AI about this it replied that the query protocol was “bulletproof,” but that three factors led to a breakdown in the response. The explanations were long but basically: LLMs treat query restrictions only as advisory and quickly shift to pre-programmed defaults if query restrictions are narrow; LLMs can’t browse dense… Read more »
I think you’re spot on on AI’s limitations. The algorithm no doubt wants to find an answer (any answer) quickly, so that machine cycles are not consumed in potentially fruitless evaluation of different possibilities. And, if it “thinks” that you’re happy with its answer, it becomes even more hardwired to whatever algorithmic path was followed to that answer. One often has to point out repeatedly the same logical inconsistencies to get the algorithm to move on to a different path.
Treating an LLM less like an all-knowing oracle and more like a talented but easily distracted intern who needs precise constraints is the best way to get flawless results.
. . . Just passing along, word for word, what AI#1 warned me about. Unfortunately, for any but the simplest tasks there seems to be no path to flaw-free results. I assume this is not the case with AI (or interns) you have to pay for!
Nothing new to report from the Division era. Prior to the last two seasons, these are the furthest behind a team has finished in its division when the division leader wins less than 100 games. AL: 47 games (2003 Central) NL: 42 games (2004 West, 2012 Central) Going back to the 19th century, the 1899 Spiders finished more than 50 games behind 9 of the other 11 NL teams. Brooklyn were pennant winners that year with 101 wins, but the NL met our criteria four years in a row, from 1894 to 1897. The Spiders get all the attention and… Read more »
Six players have done so since then. All but one finished top five in MVP voting. Neto’s current season is more like 1969 for Bobby Bonds, who finished tied for 30th in National League MVP consideration.
1965 AL – Zoilo Versalles (MVP-1)
1969 AL – Reggie Jackson (MVP-5)
1969 NL – Bobby Bonds (MVP-30)
1998 NL – Sammy Sosa (MVP-1)
2014 AL – Mike Trout (MVP-1)
2017 AL – Aaron Judge (ROY, MVP-2)
“Neto’s current season is more like 1969 for Bobby Bonds, who finished tied for 30th in National League MVP consideration.”
Scary,
I believe Bonds might have gotten more support if Willie McCovey hadn’t had such a ridculous season (.320/45/126 & .320/.453/.656). That, coupled with a record 187 strikeouts by Bonds…. Bonds did manage to steal 45 out of 49 attempts.
James Wood currently leads the NL in runs scored by a margin of 21. If that were to hold up, it would be the NL’s largest advantage over 2nd place since Pepper Martin led by 21 runs over Chuck Klein in 1933. The NL’s modern era largest advantage is 29 runs by Tommy Leach over Fred Clarke in 1909. In the AL, it’s 45 runs by Babe Ruth over Jack Tobin in 1921, with the integration era record at 30 runs, by Rickey Henderson over Cal Ripken Jr. in 1985, and by Aaron Judge over Jose Altuve in 2022. Wood… Read more »
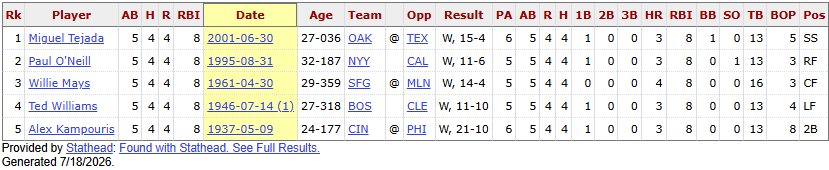
The Nationals continued their torrid offensive assault with a 23-3 ambush of the Athletics, led by first baseman Andres Chaparro, who more than doubled his season RBI total after posting a 5-4-4-8 line score (and raised his career BA twelve points to clear the Mendoza line). He is just the sixth player with that line score, all six playing different positions. Nice company.
Mark Leiter, Jr., just got out of the eighth inning unscathed after yielding a single, HBP, and a walk. If the score holds through the ninth, it will be the A’s first 2026 shutout in their Pacific Coast League home stadium. Their four team shutouts so far have – not surprisingly – all come on the road. They also have been shut out four times this season, only once so far in Sacramento.
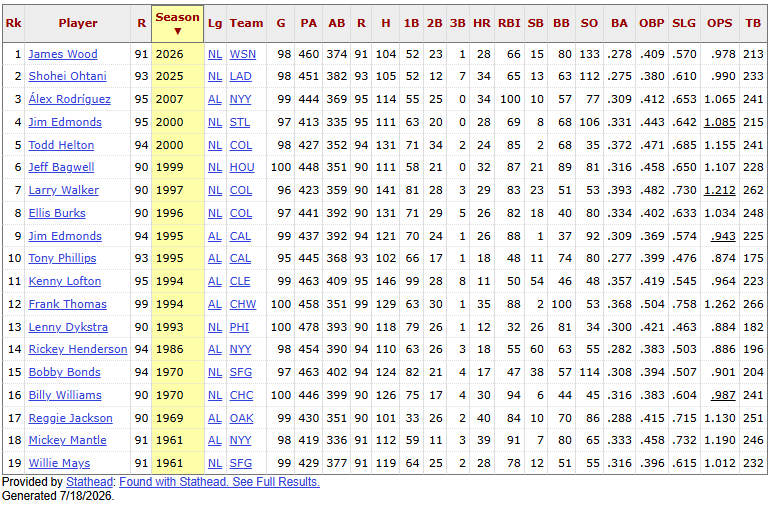
James Wood has his scoring streak stopped at 11 games, tied for the second longest in franchise history. Wood has 91 runs in Washington’s first 99 games, becoming the 18th expansion era player (and first Expo or National) with 90 runs in his team’s first 100 games. Jim Edmonds (not my first guess) is the only player to do it twice.
I have nothing against Nick Kurtz. I think he earned his unanimous ROY award and is a legitimate AL All-Star. Overall, I’m just one the mob when it comes to being a Nick Kurtz fan. However, I feel strongly that in no way should Nick Kurtz be afforded respect as a member of the exclusive club of hitters who have sent 4 HRs out of the park in one game. Why not? Because his fourth home run was launched against a left fielder named Cooper Hummel who was sent into the game to eat an inning for the pitching staff… Read more »
I attended a Class A game recently, and the home side managed to put together a 15 run 5th inning. The visitors finally found a reliever who could get batters out, but he pitched just the 6th inning. In the 7th, they moved their first baseman to the mound, and I was cringing in expectation of slow pitch softball offerings. But, I was very pleasantly surprised. The first baseman’s fastball topped out in the low 80s but, mixing in a nice curve, he kept hitters off balance for two innings, allowing just a single hit. I expect most position players… Read more »
Bob,
I get it…. but, is it any worse than playing in a cow pasture at Coors where the ball can routinely fly 400 feet and OFers play close to the warning track and everything and anything can drop in for a hit and inflated BA’s? Or, Baker Bowl, Wrigley with the wind blowing out, Fenway with tight dimensions? Or, the other way around, Dodger Stadium, Oakland-Alameda with huge foul territories?
Over 162 games it all comes out in the wash, I guess?
Yes, I think it’s very different, Paul. Your examples don’t involve players failing to play their best. The posts from Doug and Tom explain why it makes good sense for them not to, but these instances aren’t of teams that have run out of pitchers; it’s a choice made by the manager that one team will no longer actually play MLB baseball while the other will. This asymmetry is also not a characteristic of the examples you give. When players play on teams with ballparks that enhance their stats it is a visible and recorded feature of their seasons there.… Read more »
Bob, Maybe it’s entirely about managing resources for the balance of the series, week, month, season? Perhaps it would be irresponsible to waste the bullpen in a 15-2 game? God knows even “good” starters only go 6-7 innings – they need the pen for ‘close’ games. The game, at that point, has to “finish”, that’s the extent of a team’s obligation. I’m sure the NFL pulls star players in blowouts, the NBA certainly has their share of 10-12th men. Forty years ago I thought the NBA didn’t play defense. Now, I know they don’t play defense. But, some media type… Read more »
Paul, I see three arguments in your comment: 1) There are reasons why managers put non-pitchers in to throw and tell them to only lob the ball; 2) The record book is already a mess so nothing matters; 3) We really can’t compare players across eras. 1) I know why managers do this; I’m arguing they should not do it. This is not like the NFL putting in the second team; it is like an NFL team putting a defensive lineman in to quarterback an offensive series and passively wait to be clobbered by the opposing line. This problem is… Read more »
Bob, Sorry for the delay. Regarding: 1) Regardless of the insufficiency of my NBA or NFL analogy, a ML season is a war. The individual games are mere battles and many a General has retreated when the battle was lost (i.e. 13 – 2 , top of the 9th). The minutiae may lose integrity but the inevitable nature of a blowout “W” and “L” are absolutely unchanged. 2) As far as the Negro Leagues are concerned, I believe there was such a lack of depth that it is impossible to predict what the ‘average’ guy would have done in MLB.… Read more »
On 05/29/1993, Jose Canseco blew out his arm pitching in a blowout game. He came in on the 8th inning of a 14-1 game, pitched 1 inning, gave up 3 runs, and tore his UCL.. That was 3 days after a ball hit him on the head and bounced over the wall for a HR.
Canseco had to have season ending Tommy John surgery.
HR bounces off Canseco’s head:
https://www.youtube.com/watch?v=QixQMUu4CKI
Canseco pitching:
https://www.youtube.com/watch?v=-iufXBbwtUk
The Red Sox’ now concluded 15 game winning streak is just the twelfth in the integration era of that length or longer, with each of those teams making the post-season. Last time Boston won 15 in a row, they also went to the post-season, in 1946.
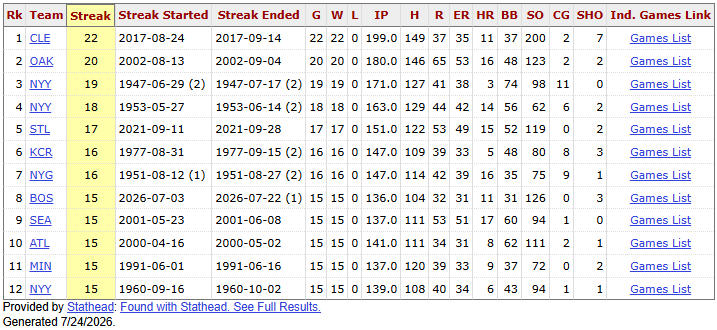
And only 37 walks allowed to got with 200 K’s. The fewest runs allowed in a 22 game stretch is: modern era: 24 runs by the 1916 Giants live ball era: 33 runs by the 1968 Indians division era: 35 runs by those same 2017 Indians The ’77 Royals with 8 CG in their 16 game streak in a pennant run is also notable. The Yankees also had 8 CG in 16 games that September. And those two teams repeated as division champs the next year, each with such a streak in September. That formula continued in the following years,… Read more »
Doug,
Just another great argument for using the “neutralized batting” dropdown within the “Batting Stats – Advanced” tab on baseball-reference when comparing hitters…… IIRC, the strike zone was top of the shoulders to the bottom of the knees. “They” had to lower the mound in 1969 to level the playing field…sorta, if you know what I mean. That, and to attract more paying customers
Dylan Cease has become the eighth pitcher to record a season including two 8+ IP starts with 10+ K’s and allowing one hit or less. Nolan Ryan (1973) and Max Scherzer (2015) had three such starts in a season. The others with two such starts are Ryan and Bob Feller, who each did it twice (for a total of three such seasons for Ryan), and Pedro, Clayton, Hideo Nomo and Matt Cain. Scherzer had two such starts consecutively, while Feller (1947) and Cease had two in three starts (Feller’s three games were two one-hitters sandwiching a three-hitter, one of six… Read more »
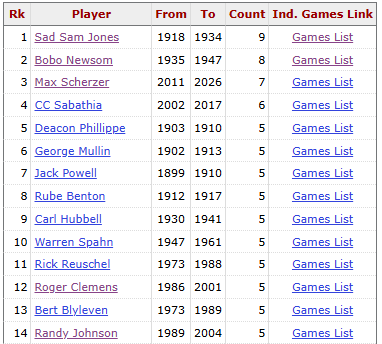
Mad Max Scherzer returned to the mound on Monday for his first game in more than three months. Under the category of Betcha didn’t know, it was the 7th birthday start of Scherzer’s career, to take sole possession of 3rd spot on that list, behind Sad Sam Jones (9) and Bob Newsom (8). Scherzer is 12.1 IP away from overtaking Juan Marichal for the lowest WHIP in a 3000 IP live ball era career. Max trails Clayton and Pedro in the group with 2500 IP careers. Marichal still leads the 3500 IP cohort, just ahead of Tom Seaver, leader in… Read more »
Hmmm. Not to be picky, but both Horsewhips Sam Jones and Toothpick Sam Jones were called Sad Sam Jones. Horsewhips’ primary nickname was Sad, but he looked normally happy, while Sad was a secondary nickname for Toothpick, who looked really sad. (And, fun fact: Bob Newsom’s name was not Robert.)
This Sam Jones was born 92 years and 1 day before Mad Max, and both started games on their 42nd birthdays. Newsom may not be Robert, but he did go by the moniker of Buck. Jones and Newsom also top the list for most pitching appearances on their birthdays, each with one relief appearances to go with their starts below. Newsom and Rube Benton hold the birthday streak record with birthday starts in four consecutive seasons.
HHS has been calm for a week, but I’ve been troubled by a small incident that took place on July 27 and wondering whether it would be worth raising here. A week ago last Monday, Atlanta was playing the Mets in New York. With the game tied 3-3 going into the bottom of the sixth, Atlanta manager Walt Weiss called on a Minor League journeyman, Connor Thomas, who had just joined the club, to hold the lead. Thomas immediately gave up a single and a HR, and staggered through the rest of the inning, giving up two more hits. He… Read more »
Bob, No depth, too much expansion…if we can get back to 24 teams, those 70 pitchers can round out/replace the Connor T’s of the MLB world. Yeah, bad choice by Weiss, but over the course of 162 games, opposing managers will have to make the same bad choices sooner or later. You may have noticed that two-time NL Manager of the Year Pat Murphy brought him north out of spring training and used Thomas twice in early-season games that weren’t “nails-in-the-coffin” lost until Connor came a callin’ ? Also, is it conceivable Weiss was giving Thomas a shot in the… Read more »
Paul, First of all, MLB is not going to contract to 24 teams, and much as I personally pine for the old 16-team best-of-seven/all-World Series “postseason” era, it would make little sense. The population of the US has increased by two-thirds since the end of the 24-team era in 1976 and MLB employs international players at a rate multiple orders of magnitude greater. There is no talent shortage in MLB: baseball is just eating its pitchers — their arms are prematurely aged by the demands of high-expectation youth leagues and further stressed by the speed/movement standards of the contemporary professional… Read more »
Bob, Of course the sport won’t contract. Money drives everything from baby formula to nursing home care and everything in between. MLB certainly is no exception. How about they build bigger ballparks commensurate with 6’1″ 185# middle infielders and 6’3″ 215# catchers, corner infielders and outfielders? You know, the guys that replaced the Larry Bowa’s, Ted Sizemore’s, and Denny Doyle’s of the world…That might just relieve stress on pitchers arms while granting “forgiveness” for the occasional long-flyball out that is now a home run. There are no more easy outs in a lineup any longer. Everyone can and does try… Read more »
It’s true that MLB-level talents in the US now often opt for other sports (one reason for the drop in Black MLB players), but given the rise in population and the heavy influx of international players I don’t think the talent pool is diminished. The flattened WAR curve seems to confirm that the top talents now exceed replacement-level talents by a smaller margin than in past eras. As you say, Thomas would have been a successful starter in the 24-team era, but the reason seems to me elevated standards, not a talent shortage. His home park in Atlanta has dimensions… Read more »
As far as the gratuitous torture goes, perhaps the Braves’ management decided they weren’t in the psychology business? Particularly, the mental health of some other organization’s future “prospect”. Thomas is a big boy; I’m sure he will recover from the sore arm and the psychological scars of overwork. Perhaps in some Latin American winter league or Korea or Japan in the spring. As they say, “Attaboy”.
As far as the 78 pitches, he probably was toast before he got to 30 pitches. I’m sure that, “caveat emptor”, is the mantra all these organizations hold before acquiring talent.
It does seem more than ironic that, as players have become much bigger and stronger, outfields and foul territory have become smaller. The old time ballparks, with dimensions dictated or strongly influenced by the adjacent city streets, often had a short porch in one field, but that nearly always meant one or both of the other fields were very spacious. Mandating minimum dimensions for one or two outfields would extend many current playing fields, but doing so today need not mean a reduction in scoring. All or nothing batting swings the great majority of hitters use now could change if… Read more »
Surely 2026 ought to go down in Baseball history as The Year on the DL, or a similar sobriquet. Aaron Judge’s much publicized departure from view is just the tip of the iceberg, to coin a phrase. Max Fried, Gerritt Cole, Carlos Rodon, and Anthony Volpe, also of the Yanks, have been there and done that, while Giancarlo Stanton, who, admittedly, is on the DL as much as off, hasn’t been seen in months, and now Cody Bellinger is predicted to miss 4-6 weeks. Last year phenom Cal Raleigh missed a month early, and is still batting .165 with much… Read more »
Weird play in the Red Sox/Blue Jay game. Boston had runners on first and third, one out, and batter hits a routine fly ball to medium-deep center field. Both runners take off on contact, evidently confused by the scoreboard which incorrectly showed two outs. Centerfielder makes the catch and third out is recorded at first base to end the inning unscathed. Except, they weren’t unscathed. Since the runner from third had crossed home plate before the third out at first base, the fly ball was deemed a sacrifice fly. Why? Because, a runner leaving his base early is not retired… Read more »
First player with 3 HR in a debut game, never mind in three straight PA. He is the 3rd player this season to tie or break the home run record in career debut games.
Baez has evidently found his power stroke this season, with 34 HR in 410 AB in Memphis, after a total of 44 HR in 1170 AB over his five previous minor league seasons. Six minor league seasons, but just turned 23 at the end of June.

The Cardinals played two today. Baez went 0 for 9. He’s now 0 for 15 after his first three ABs. After Baez’s debut, MLB focused a page on the 33 players who’d homered on their first MLB pitch. There were a few significant names, but it seemed to me the majority were obscure. (I remember as a kid knowing Chuck Tanner had executed that feat — now I see he had a career -0.2 WAR.) I don’t believe in curses but I do believe in counter-productive pressure, and I’m not sure a spectacular debut doesn’t actually tend to work against… Read more »
Baez went 0-3 yesterday, but with a late-inning SF. Baez was benched this evening. But he entered as a two-out bases-empty pinch hitter, got a single, stole second, and later walked. (Down by three in the 9th, the Cards staged a two-out rally to come within one run with a runner at third. Baez was on deck — a high-pressure chance to regain full momentum — but after a 3-2 count the game ended on a ground out.) So after three initial HRs, Baez went 0 for 18, but now has three PAs with a SF, a single + SB,… Read more »
As of the evening, the Detroit Tigers are having a terrific season, with the fourth best offense (runs scored) and third best defense (runs allowed) in the AL. At 72-54, only Tampa has a better record — except that the Tigers’ are 72-54 in their Pythagorean W-L and 61-65 in the real world: an 11 game difference. Of course, a weak league record in interleague games means they’re still in the hunt, within a game of Texas, currently in the final Wild Card slot, like 45% of the teams in the league.