Monthly Archives: February 2012

Career High Wins vs. Total Career Wins

When Tim Wakefield decided to call it a career, he retired as 1 of only 8 pitchers to win at least 200 games in the majors without racking up a 20 win season. In fact Wakefield won his 200 games without ever winning more than 17 games in a season. The other pitchers in this small club are:

In honor of this stat, I thought it might be interesting to examine the career records for all pitchers at each career high win number. Who had the most wins winning only 1 game a season? Which 20 game winner had the fewest career wins (a question that came from Tmckelv on another thread) How many pitchers have won 19 games in a season, but not 20? If a pitcher wins 15 games in a season, how many career wins can we expect him to have? etc. Continue reading

The BPP All-Time Dream Project

Graham, our friend over at Baseball Past and Present, has embarked on a cool project to find the 9 best players in history (by position, obviously.) He’s narrowed down the choices on a ballot to make it easy, such as picking the best center fielder among Willie Mays, Mickey Mantle, Joe DiMaggio, Ty Cobb, Tris Speaker, and Ken Griffey. Easy, right?

He’s also commissioned an artist to make a set of team cards for the winning players. Neat stuff–go over and fill out your ballot today!

Age and WAR (position players)

Note: I’ve added a 4th graph at the end of the post, covering only the years 1982-2011.

A couple of graphs relating bWAR/age, and OPS+/age. I’ll leave the observations to you folks.

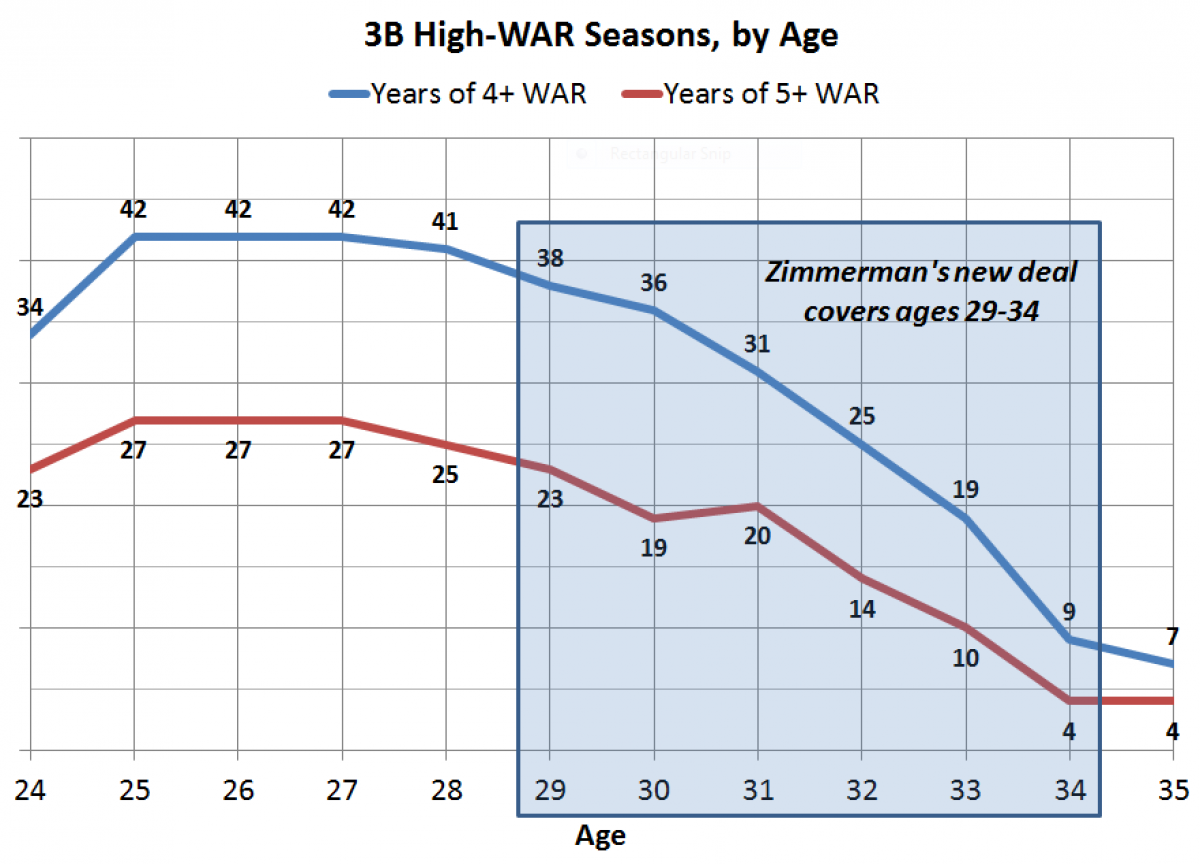
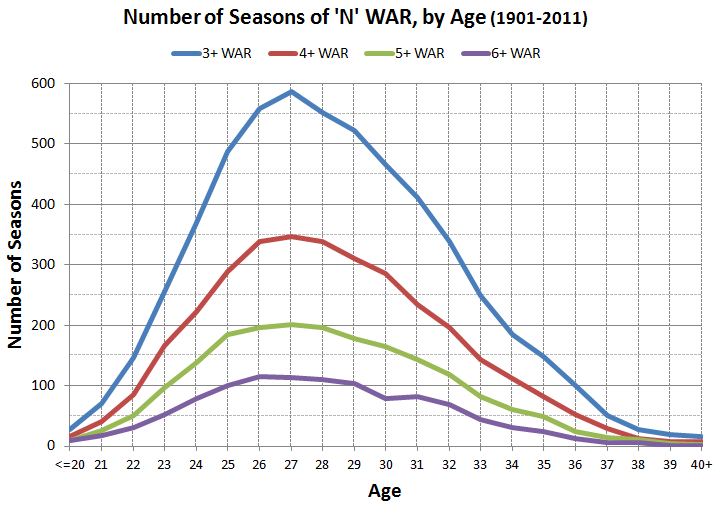
(1) As a general followup to the graphs in my Ryan Zimmerman post, here’s a graph showing the number of seasons of four different WAR levels, for all position players, for the years 1901-2011:

Continue reading

Baseball stats for beginners: the importance of home/road splits

What do you think of these two players:

Player A: 9014 plate appearances, 414 doubles, 416 homers, 1604 RBI, .320 BA, .920 OPS

Player B: 9102 plate appearances, 332 doubles, 348 homers, 1298 RBI, .277 BA, .789 OPS

Look at that difference in OPS–huge, right? Player A drove in a lot more runs with a much higher batting average.

Among players with 9300 to 9700 career plate appearances, the player with the closest OPS to Player A is Al Simmons. The player with the closest OPS to Player B is Ted Simmons. That’s a pretty good representation of those numbers–Player A is a Hall of Famer while Player B is merely “really good”.

So who are these two players really? Continue reading

The Complete List of Normalized Strikeouts (min. 1000 IP)

On Thursday I posted the leaders for normalized strikeouts along with their adjusted career strikeouts. At the time I wanted to make the  entire list available to everyone, but due to technical issues, this was not possible. Today it is.

Thanks to a new plug-in added by Andy the entire list of pitchers is now available, sortable and searchable on this page.

You can also find it listed under “Stats” in the bar on top of the page.

Living in the Postseason – Pitchers with the Highest Percentage of Career IP Coming in the Postseason

The 2011 postseason was quite a ride for Rays pitcher Matt Moore. Not only did Moore pitch 7 dominant innings in game 1 of the ALDS vs. Texas, his 3 relief innings in game 4 gave him 10 postseason IP, more than he had thrown in his regular season career. Moore is the extreme, but there are plenty of active players who have pitched a significant part of their careers in the postseason.  This is particularly true for young pitchers of the Texas Rangers. Here are the pitchers who have the highest percentage of their career innings (regular + postseason) coming in the postseason. All stats were derived from information in the Lahaman Database. Continue reading