
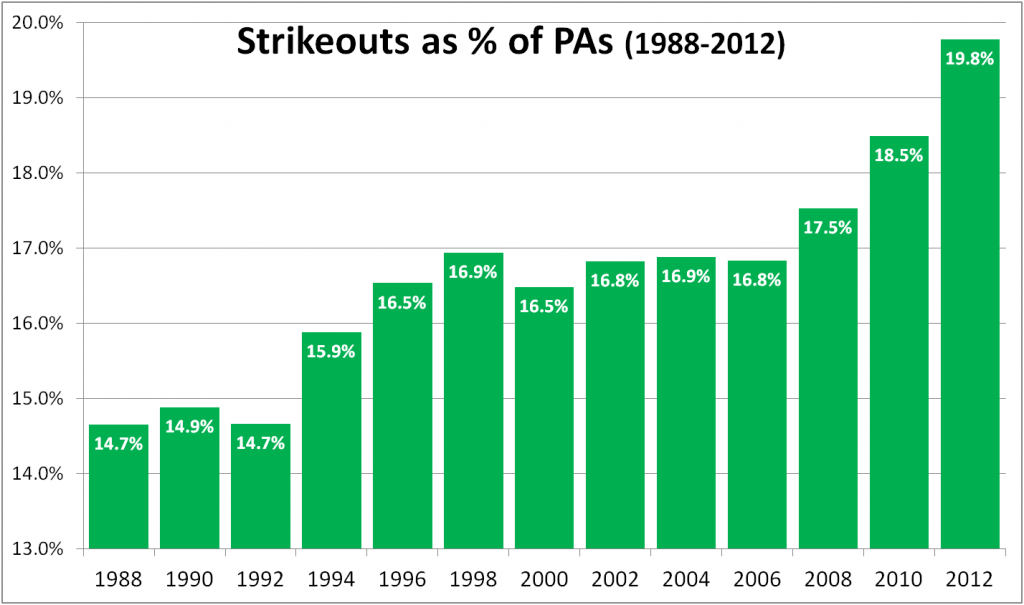
The MLB strikeout rate has risen 35% since 1988, climbing from 14.7% of all PAs to 19.8% in 2012. It’s not all the batters’ doing, and I’m not here to berate them, anyway. I just want to look at two basic parts on their side of the K-rate equation. Let’s show the basic rate before we break it down:
When we talk about the hitters’ role in K rates, we most often speak of their 2-strike approach. Modern hitters are less likely to cut down their swing with 2 strikes, or to swing at a pitch they can’t drive. So once they have 2 strikes, they’re more likely to strike out.
The following chart shows strikeouts as a percentage of all 2-strike counts (2-strike SO%), in 2-year increments from 1988-2012. (The lighter-colored bars for 1990 and 1996 indicate a significant number of missing data; about 8%-10% of the PAs in those years are missing the ball/strike count, so those calculated percentages are less reliable.)
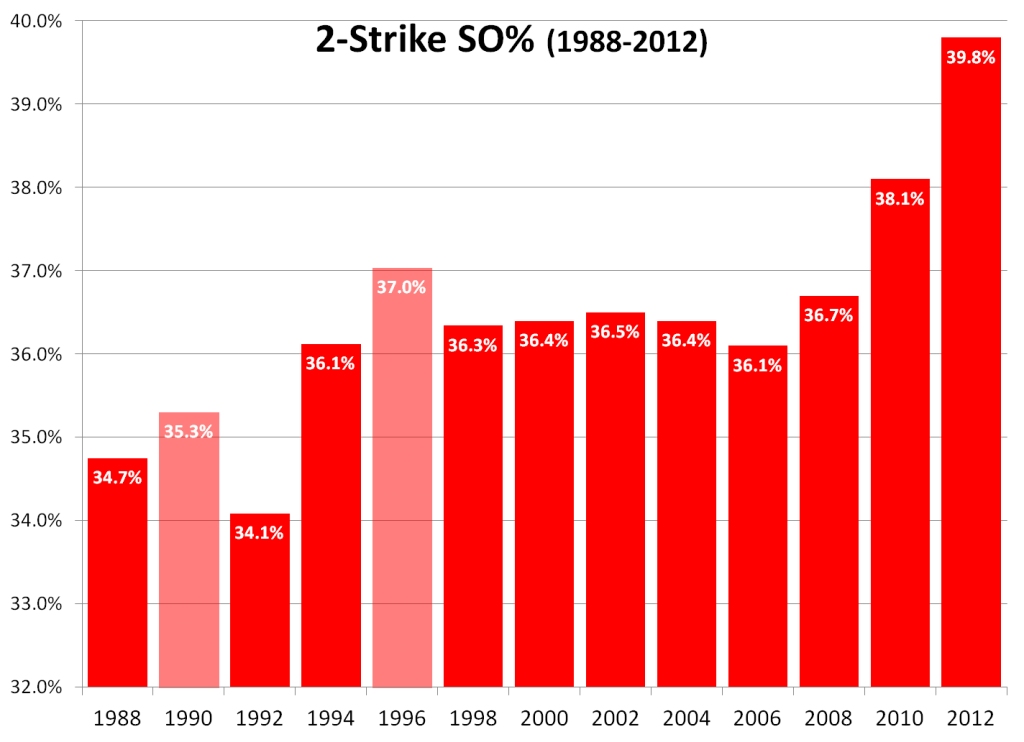
But the rise in 2-strike SO% is only 15% since 1988. Where’s the rest of that 35% increase in overall K rate coming from?
Well, you can’t strike out until you get to 2 strikes. The frequency of 2-strike counts is the other major piece of the equation. Here are 2-strike counts as a percentage of all PAs (2-strike PA%):
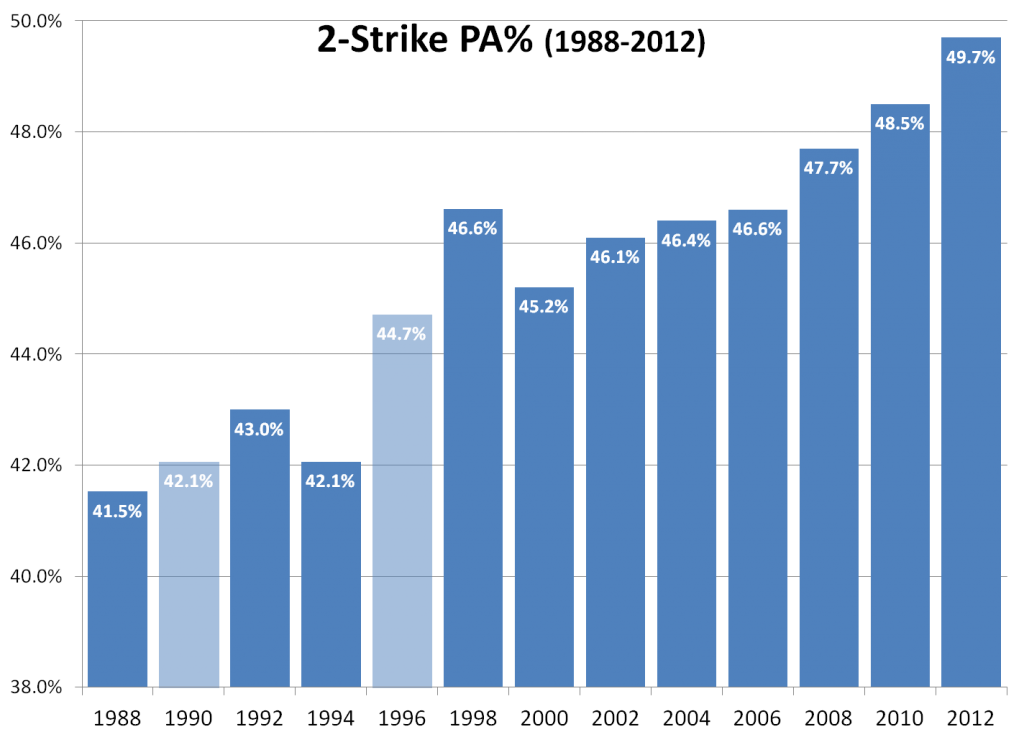
To my surprise, the 2-strike PA% has gone up more than the 2-strike SO%. From 1988-2012:
- The 2-strike SO% rose 15% (from 34.7% to 39.8%).
- The 2-strike PA% rose 20% (from 41.5% to 49.7%).
And the pace of change in these factors has been different. The 2-strike PA% has risen pretty steadily since 1988. But most of the rise in 2-strike SO% has come in the last 4 years. From 1988-2008, the net change in 2-strike SO% was less than 6%, with almost no net change from 1994 to 2008. But it’s risen more than 8% in the last 4 years.
If you have any thoughts on these data, you know what to do.
Being a capitalist at heart (although a centrist Democrat) I look for market forces. Three trends happening at the same time, slightly asynchronous. The first is steroids-era revalued home run (new level is really established in 1996), the second is the money-ball grind it out stat-head driven take the walk strike out or hit it nine miles mentality (think the younger Jason Giambi) and the third, most recent one, is a combo of the intensified testing and changes to the structure of bullpens-larger number of pitchers and specialists throwing harder and harder. Management/players go for the money (literally and in terms of on field success.) As things worked on the field, presumably they would be reflected first in conduct and then in results.
Some very smart agent said to a player, “you can increase your HR rate by swinging with 2 strikes the same way you swing with none or one”. “See, shortening your swing with 2 strikes gets you a meek ground out, while swinging for the gates gets you a HR once in a while.”
Comparing 1988 and 2012, the rise in HR% with 2 strikes is less than the overall rise, by 22% vs. 34%.
HRs per PA, overall: 1988 – 2.00%; 2012 – 2.68%; 34% increase.
HRs per 2-strike PA: 1988 – 1.32%; 2012 – 1.61%; 22% increase.
Putting the 2-strike HR% into a seasonal perspective:
– 1988 hitters averaged 8.6 HRs per 650 2-strike PAs;
– 2012 hitters averaged 10.5 HRs per 650 2-strike PAs.
Since almost half of all PAs reached 2 strikes last year, we’re basically talking about one extra 2-strike HR per full batter season resulting from the more aggressive approach.
I’m not trying to draw any conclusions, just trying to quantify the changes.
Good stuff, John.
More two-strike counts indicates some combination of more patient hitters and making less contact early in the count. The fact that more strikeouts are resulting from those 2-strike counts is not surprising for the reasons you’ve indicated.
With half of PAs now going to 2 strikes, it’s not surprising that:
– games take so long to play
– complete games are such a rarity
– the 12-man pitching staff is now the norm instead of just 10
Here are the OPS numbers for all PAs and PAs after going to 2 strikes, and the change.
– AL: .715/.536 (1988), .731/.521 (2012), 2.2%/-2.8%
– NL: .673/.487 (1988), .718/.513 (2012), 6.7%/5.4%
So, based on the two endpoint years, the new free-swinging 2-strike approach would seem a very bad idea in the AL, and slightly bad in the NL.
Is there any data on swinging vs. called strikes early in the count? Also foul balls vs missed swings? Probably not, but these things might add some insight into what’s happening.
Results for each count are on B-R under League Batting Splits. For example: http://www.baseball-reference.com/leagues/split.cgi?t=b&lg=NL&year=2012
Types of strikes are under League Pitches Batting. For example: http://www.baseball-reference.com/leagues/NL/2012-pitches-batting.shtml
Here are percentage of pitches per PA, % of pitches that are strikes, and % of strikes looking, swing&miss, and in play for 1988/2012.
……..Pit/PA……% Strk……..% Look…….% SW&M…….% In Play
– AL: 3.62/3.84…62%/63%…25%/28%…14%/16%…34%/30%
– NL: 3.54/3.80…63%/64%…24%/28%…14%/16%…34%/29%
Note that % of strikes that are fouled is basically unchanged. So, pitchers are basically throwing strikes and balls at about the same rate as 1988, but are having to throw more of them because batters are both taking more and missing more. The last number showing strikes in play declining significantly speaks to John’s point that a batter is more likely today to pass on a nasty third strike that he can’t drive versus cutting down on his swing and hitting it weakly somewhere in 1988.
Doug:
Your last comment brought back something from my wasted youth: when I was playing league ball in the Fifties and Sixties, the Bronze Age, let’s say, taking a called third strike was one of the minor sins except when the count was full, and even then, if a pitch was close enough to the strike zone to to fool the ump, then you ought to have taken a cut at it.
Called out on strikes equalled humiliation.
I like this thought Doug. Free swinging is supposed to be a stat head thing but a stat head would understand the value of avoiding an out trumps everything else. You’d think stat focused baseball people would further stress free swinging without two strikes but continue to encourage people to shorten up with two strikes.
That’s not true Doug.
John, When you write that we know what to do if we have thoughts on the data, it’s a little ambiguous: given my skills, I know I should shut up. Yet . . .
What strikes me (sorry) reading the early replies from Mike, Doug, nsb, and mosc, is that the analysis is entirely focused on hitters. I’m sure the balance lies in that direction, but surely pitching staffs and coaches are not passive observers of batter behavior: I can’t help but wonder how pitcher adaptation to increased 2-Strike, K, HR rates may be contributing to the rate of change, especially in terms of pitch choice/placement with 2 strikes. (Doug has something to say about this @5, but I don’t quite follow.)
epm — Good thing I didn’t say “you know where to put your comments.” 🙂
Anyway, you’re absolutely right, it’s not all the batters’ doing. (Hmm, that phrase sounds familiar…) I did choose to focus on them, just because it was easier to frame a distinction between their 2-strike approach and their overall approach that leads to more 2-strike counts. But as you say, we could just as well look at the same picture from the hurlers’ perspective.
And besides what individual pitchers are doing, we have the ever-shortening relief outing, which means batters are more often facing a fresh arm. The relief K rate has increased more since 1988 than that of starters, 38% to 32%. And there were 16% more PAs vs. relievers in 2012 than in 1988.
As for pitcher strategies, recent data suggests they’ve responded to the batters’ “work-the-count” efforts by throwing more strikes. The unintentional walk rate last year was 7.4%, the lowest since 1988. That’s a drop of 20% since 2000, which saw the highest rate since the mid-’50s, and a drop of 11% just since 2009.
It’s interesting to know that, in 2012 anyway, just about half of all PAs went to 2 strikes and the overall BA was just .178.
I would consider the re-introduction of the high strike in baseball (mandated by MLB in 1999 and reinforced with pitch f/x in 2006) and potential increasing fastball rates as part of the equation as well.
Although pitch speed may not be increasing that much, the average velocity of a fastball that a batter must face has almost surely risen, due to the increase of relievers pitching more innings and their increased strikeout rates vs. those of starters (as JA notes @10).
bstar, I am in no way contradicting your point about MLB directing umps to enforce the strike zone more accurately.
Still, 1999 saw one of largest *increases* in the unintentional walk rate in recent decades, with another small bump in 2000 to reach nearly 9% of all PAs. That was a 10% rise over 2 years. The rate fell sharply in 2001.
And 2006 was the first of 4 consecutive small increases in the UBB%, adding up to a cumulative rise of 10%. That rate fell significantly in 2010 and again in 2011, and last year reached its lowest rate since 1988.
I would guess 1999 numbers would be skewed by umps collectively thumbing their nose at Sandy Alderson for suggesting they now consider the high strike. Remember a whole bunch of umps submitted their resignations after that, and MLB did take Eric Gregg and a few others up on that offer. So there was very possibly some anti-high strike mentality going on in 1999 after MLB’s decree.
As for 2006, that was just the introduction date of pitch f/x. Unless I’m mistaken, umps are forced nowadays to look at pitch f/x and see which pitches they may have miscalled. I’m convinced the high strike has again gained a foothold in the game because of this. You wouldn’t see the effects of this specifically in 2006.
They used Questec for this for several years before switching to pitch f/x, so the automated strike zone feedback for Umpires started before 2006, about 2002.
This was a great post, John. Really got a lot of out it.
Thanks, dj. I followed your link and read the Billy Williams piece — one of the most enjoyable first-person accounts I’ve read from a ballplayer.