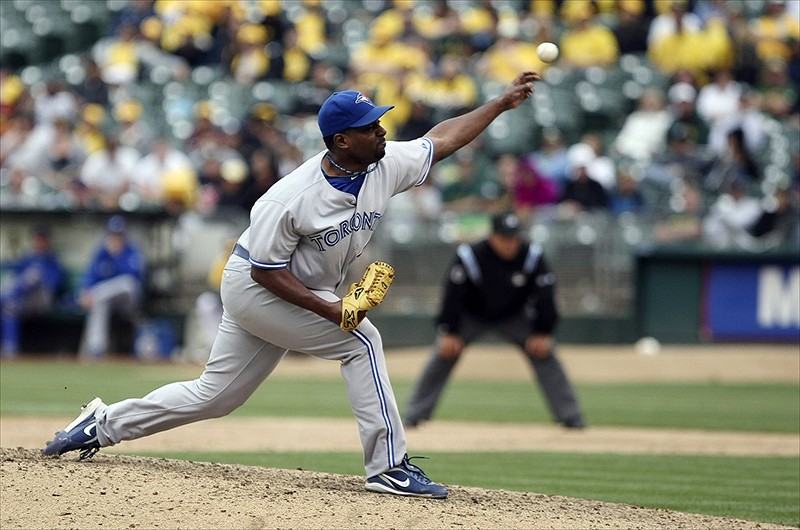
Darren Oliver has re-signed with the Blue Jays for 2013 and he’ll be coming back for his 20th season in the majors. He’ll be 42 on Opening Day.
Perhaps the most incredible thing about Oliver’s career is that he isn’t simply hanging on into old age. His line for the last 5 years (2008-2012) reads like this: 304 games, 1 start, 314.1 IP, 271 H, 79 BB, 274 K, 2.52 ERA, 175 ERA+.
Take a look at that line again. Basically, he’s been an ace reliever.
Oliver’s last bad season was in 2004. He didn’t pitch in the majors in 2005, but since then has rattled off 7 straight years ranging from good to excellent. Over that period, he’s been worth 10 Wins Above Replacement as a middle reliever.
Just to give you an idea of how valuable Oliver has been, here are the leaders in WAR among non-closing relievers:
Rk | Player | WAR | SV | G | From | To |
---|---|---|---|---|---|---|
1 | Octavio Dotel | 15.4 | 109 | 752 | 1999 | 2012 |
2 | LaTroy Hawkins | 14.1 | 88 | 871 | 1995 | 2012 |
3 | Rafael Betancourt | 13.6 | 58 | 603 | 2003 | 2012 |
4 | Matt Thornton | 10.4 | 23 | 546 | 2004 | 2012 |
5 | Scott Downs | 9.9 | 26 | 496 | 2000 | 2012 |
6 | Sean Marshall | 9.4 | 16 | 365 | 2006 | 2012 |
7 | Mike Adams | 9.3 | 4 | 358 | 2004 | 2012 |
8 | Joaquin Benoit | 9.1 | 13 | 475 | 2001 | 2012 |
9 | Jesse Crain | 8.5 | 4 | 494 | 2004 | 2012 |
10 | Jeremy Affeldt | 8.4 | 28 | 621 | 2002 | 2012 |
Oliver himself didn’t qualify for this list since he was primarily a starter before his renaissance.
If we look at just 2006-2012, since Oliver has been reborn as a reliever, here are the top WAR totals among non-closing relievers:
Rk | Player | WAR | SV | G | From | To |
---|---|---|---|---|---|---|
1 | Rafael Betancourt | 11.1 | 52 | 448 | 2006 | 2012 |
2 | Matt Thornton | 10.1 | 23 | 472 | 2006 | 2012 |
3 | Scott Downs | 10.0 | 26 | 438 | 2006 | 2012 |
4 | Darren Oliver | 10.0 | 5 | 410 | 2006 | 2012 |
5 | Sean Marshall | 9.4 | 16 | 365 | 2006 | 2012 |
6 | Mike Adams | 8.0 | 3 | 299 | 2006 | 2012 |
7 | Brad Ziegler | 7.3 | 19 | 323 | 2008 | 2012 |
8 | Grant Balfour | 7.1 | 34 | 343 | 2007 | 2012 |
9 | Darren O’Day | 7.1 | 2 | 255 | 2008 | 2012 |
10 | David Robertson | 6.8 | 5 | 269 | 2008 | 2012 |
Any way you slice it, this guy is among the best middle relievers going into 2013.
He’s also picked up a knack of ending up on postseason teams. Oliver made one postseason appearance in his first 13 years, but has pitched in October in six of the last seven seasons since his 2006 renaissance, with mixed results. His last appearance was a certain game 6 of the 2011 World Series.
This talk of setup me brought me back to 1995 and my Rotisserie league team that year. Halfway thru the draft or thereabouts I had no shot left at a halfway decent closer and there were enough openings that the few scrags that did remain would not go cheap either. And of course starting pitchers had been picked pretty clean as well. I decided to take a chance on a couple of setup guys who might have a shot at closing. Neither one actually got that chance but between Dave Veres (5-1, 2.26 ERA, 94 K’s, 1.15 WHIP) and Julian Tavarez (10-2, 2.44 ERA, 68 K’s, 1.14 WHIP) I had managed to somehow create maybe the 4 or 5th best pitcher in the league for $2. If I remember correctly an injury & and off-year to a couple of my position players kept me from finishing higher than second but that was still my best finish in almost a decade (it was usually a 16, sometimes 15 or 17 team mixed-league). Even though I tried that strategy a couple more times I was never able to catch lightening in a bottle again.
Maybe I’ll give one of those guys a call and see if the league is still going and if they’ve got any openings and make a drive back to Iowa this spring.
Here’s a quote from Bill James’ 1995 Player Ratings. “Slender left-hander, held left-handed batters to a .119 average in ’94. Has above average fastball, mixes it with a wide slider which is almost a curve. Originally a starter, he tore up his shoulder and missed almost all of the 1990 and ’91 seasons, re-emerging as a reliever. Control isn’t great, but then, most good pitchers don’t start off as control pitchers.
I’ll add some more praise of Oliver:
– #5 in total reliever WAR over the last 5 years, trailing Mariano, J.Soria, J.Johnson, and (the remarkably unheralded) Sean Marshall. Oliver and Mike Adams are the *only* relievers worth 1+ WAR each of those 5 years.
– #6 in non-closer WPA over the last 5 years.
– Oliver is *not* a lefty specialist by any means. Over the past 5 years, 56% of his batters faced were righties, and he faced more RH than LH in each season. Last year, he held RH to .196/.514, with 1 HR in 107 AB.
Here are relievers since 1901, aged 37-41 (min. 300 IP).
Three other after Ryba are Jeff Fassero (92), Jose Mesa (90) and Miguel Batista (88).
And here are middle relievers in the same age range, sorted by WAR: http://www.baseball-reference.com/play-index/share.cgi?id=Y1T1s
Falling through the cracks of both P-I searches above is Takashi Saito, with the following line:
Saito age 37-41 IP-247.2 ERA+ 194 WAR-7.7
Good point. The only thing keeping Saito out of my search was the “middle reliever” stipulation, or GF < 1/3 G.
Right. In fact, Saito WAS a closer at age 37 for LAD and picked up 18 saves at age 38 for them, but I do think he deserves a mention somewhere on here. I’m not aware if he was just injured last year or his career is over.
I believe he’s back in Japan, and if memory serves, on the same team as Andruw Jones.
Saito’s career 185 ERA+ ranks 4th all-time with a 300-IP minimum.
Speaking of ERA+ for relievers, Jonathan Papelbon is sitting at 499.1 career innings. He should slip into second all-time with 500+ IP ahead of Billy Wagner (unless he gets really lit up in his first appearance this year).
Pap’s at 192 and Billy Wagner is at 187.
I know it was his 2nd game of the season, but do you mean lit up like this:
http://www.baseball-reference.com/boxes/ATL/ATL200204060.shtml
Smoltz’ ERA didn’t drop below 6 until May. It didn’t drop below 5 (and stay below 5) until mid-June. He had an ERA over 4 as late as August 6.
And yet he still saved 55 games. His ERA, without including that game, was 2.37, meaning that one game raised his ERA almost a full run (season ERA of 3.25). This is one of those cases that makes me wonder about ERA being a good measure of value for relievers. His ERA+ was “awful” for a closer of his stature, 128, and he only has a bWAR of 1.1 for that season. I wonder how much damage that one game did to his WAR – I have no idea if it is possible for one game to drop your WAR more than one game (so to drop Smoltz from say 2.2 to 1.1), but if so that seems like a limitation because a pitcher can’t lose more than one game at a time.
Artie Z @16 — That’s an interesting point about Smoltz’s bad game.
I checked the 2002 relief leaders in Win Probability Added divided by Leverage Index (WPA/LI, a.k.a. Situational Wins Saved).
Smoltz ranked 7th in that category, trailing only Gagne among closers.
Then I saved the top 50 in that WPA/LI search, and re-ranked them according to WAR. Smoltz ranked 41st with 1.1 WAR, trailing 11 other closers besides Gagne.
14 of those 50 rated at least 2.2 WAR, so in some sense it does seem that the one bad game cost Smoltz more than 1 WAR.
This requires more thinking.
Now, obviously, an 8-run torching is pretty rare for a late-inning reliever. In the past 10 years, there have been just 16 blown saves (8th inning or later) allowing 6+ runs, including 2 of 7 runs and 1 of 9 runs. And only Ryan Madson had even 2 of those games.
But in rare cases like Smoltz, it does seem those games have a distorting effect on WAR.
FWIW, Fangraphs has Smoltz at 2.6 WAR for 2002, ranking 3rd among closers.
Replying to Artie @16 and JA @18: The Smoltz game is one of my favorite examples of the limits of stats (I love stats, but love that they have limits, too). The last time I brought it up – awkwardly, in an early season discussion generally about starting pitchers, if it’s not a false memory – John had introduced the idea of “disaster starts,” and the issue later led to his “Mulligan ERA” for starters, a neat stat that had a vogue on HHS for a few weeks.
The larger point is that the quality and value of a player’s performance can’t be assessed without stats – counting, averages, advanced – but that qualitative and anecdotal evidence derived from scanning game logs, parsing box scores, reading news or memoir accounts, can change the way we understand the meaning of those stats in individual cases.
If, on April 6, 2002, Smoltz had been pitching in the bottom of the 9th instead of the top, he would have allowed one run and everyone would have gone home. Instead, he kept pitching, Bobby Cox decided to indulge in some sort of experiment, and Smoltz’s career WAR dropped by 1.5% or so. When I cast a vote for Smoltz on birtelcom’s Circle of Greats ballots, I always think about how many borderline votes Smoltz loses because of that game among HHS voters, and wonder what his “Mulligan WAR” should be.
epm @19 — FWIW, if we estimate the WAR cost of the Smoltz eruption at between 1.0 and 1.5 WAR, the impact on his all-time WAR ranking is not large.
Giving Smoltz an extra 1.0 to 1.5 WAR (exactly how much doesn’t matter for this purpose) would lift him 4 spots, from 39th to 35th.
He would pass Vic Willis, Don Sutton, Roy Halladay (for now), and Jim Palmer.
To get him up any higher on the career list, the value of that game would have to be at least 2.0 WAR, which I just can’t see. That would give him more WAR than Gagne that year (2.9), which fails the smell test.
Fair enough, John (although passing Palmer seems to me not such a tiny blip). But the larger point is that to dock a 200 game-winning HoF candidate 1.5-2.0% of his lifetime WAR for 2/3 of an inning of an early April game that got out of hand illustrates a type of unavoidable distortion that averages/advanced stats can mask. No quarrel with WAR – I think it does what it does pretty well. But like all averages, adjusted or not, it smooths out the bumps. Sometimes, the pattern of bumps itself offers important data. (And I hope the Mulligan ERA makes a few judicious appearances in Game Notes next season.)
One can make a reasonable mathematical estimation on what Smoltz’s WAR would be without the disaster game. Assuming things like park factors, strength of opposition, etc. are the same, you just change Smoltz’s RA9 and IP to reflect the lost game. This gives us 79.2 IP and a 2.485 RA9.
Since RAA is [IPx(RA9avg-RA9)/9], we can solve for Smoltz’s new RAA assuming RA9avg is unchanged. I get 12.26 RAA for Smoltz. It gets tricky after that, as there is a step that recenters the league avg. to zero. Using the old numbers with the disaster game, Smoltz’s RAA is 4.55 before the adjustment. The stats says 4 RAA though, so our best guess is that the recentering is -0.55 for Smoltz. So 12.26 – 0.55 = 11.71, which fortunately doesn’t change anything. Smoltz’s new RAA is 12.
After that, I don’t understand the math completely, but we can look at Smoltz’s 2004 season and see he also had 12 RAA that year with a very similar IP total and ended up with 2.0 WAR. However, Smoltz got a 0.2 WAAadj boost from his leverage index in 2004, which means his WAR before adjustment was 1.8. Smoltz had a 0.0 adjustment for 2002, so 1.8 should be our best guess as to what Smoltz’s mulligan WAR might have been.
So mulligan 2002 WAR – Smoltz 2002 WAR yields (-0.7 WAR) for the game in question. Again, very much an approximation.
I wish I knew the math better on how to go from RAA to WAR.
I was worried that the RAA to WAR conversion for Smoltz was off in the previous comment, so I tried to find a 2002 NL reliever with approximately the same IP who had close to 12 RAA, like the mulligan Smoltz. It looks like the best comp is Luis Vizcaino of the Brewers, who had 81.1 IP, 11 RAA, a 0.0 WAA adjustment(like Smoltz), and 1.7 WAR.
If ~80 IP of 2002 NL ball translates to 1.7 WAR, the approximation of Smoltz’s mulligan WAR being 1.8 with 12 RAA seems to check out.
If I follow you, bstar – and my record on this sort of thng is about .257, normed – the effect is about 30-50% less dramatic than I’d estimated.
When writing about Smoltz’s game in the future, I will tone down my rhetoric by 40%.
Thanks for putting so much effort into this!
epm, thanks but it really doesn’t take that long. The only performance-based inputs into pitcher rWAR are IP and RA9. You can compute RAA really easily from that.
I just did Bob Gibson’s 1967 disaster game and it took 5 minutes. Once you find RAA and estimate what the recentering adjustment might be, all you have to do is use the P-I to find a pitcher from the same league with similar RAA and IP (since the conversion varies based on IP) , and you should be able to convert from RAA to WAR pretty easily.
One possible error source is how much RA9avg, the standard against which a pitcher’s RA9 is measured against, would change absent one pitcher’s disaster start. Hopefully the changes would be negligible enough for a reasonably close estimate to be made.
bstar @30: “Once you find RAA and estimate what the recentering adjustment might be, all you have to do is….”
Why do I feel that I just boarded two trains departing Chicago in opposite directions at different speeds? 🙂
Seriously, I totally dig that you can do those figures *and* explain your work. Me, I’d have a better chance of … well, of finding Cliff Clavin in my kitchen.
JA, there’s very little math involved, really, but thanks.
I sorted Oliver’s career by ERA+. His best years w/ 50+ IP, in order, are at ages 41, 40, 39, 38, 37. This should make for an interesting projection!
Oliver is staying the same, the hitters are getting worse
I saw Oliver start a game for the Sox at Fenway. Mirabelli hit a homer. Oliver got shelled.
What was that…fifteen years ago??
I for one have aged
But you’ll always have 1969 to look back on with a smile.
He’s this year’s winner of the Rheal Cormier I Thought He Was Long Gone, But There He Is In The Box Score Crafty Lefthander Award.
I still can’t believe Arthur Rhodes hung up his spikes after just 900 games and 20 seasons!
His 2011 record of 7 one-batter appearances in a single postseason will stand for decades, I’m sure. 🙂
Rhodes’ and Oliver’s appearances in the 2011 WS almost resulted in a 40 year-old pitcher appearing in every WS game. Nevertheless, the six games with such an appearance is the most in any WS.
We are still waiting for a WS game in which each team featured a 40-something pitcher (the only other series with a 40-something pitcher appearing for each team was 2005 with Roger Clemens and Orlando Hernandez). Two forty-something pitchers have appeared in the same WS game for one team only twice: 1934 Cardinals (Vance, Haines) and 1947 Yankees (Newsom, Chandler).
Newsom/Chandler didn’t exactly strike a blow for the old guys:
http://www.baseball-reference.com/boxes/BRO/BRO194710020.shtml
Newsom started and allowed 5 runs while retiring 3 batters (2 CS in the 1st bailed him out of that frame). Chandler pitched the 4th and restored Brooklyn’s 5-run lead, which turned out to be just enough.
P.S. I’m glad I saw that box score. Looking at the 9th inning, I saw “B.Johnson” made the Yanks’ first out, and thought — Who?
I had no idea that Billy Johnson was NYY’s more-or-less regular 3B in 1943 and ’46-’50. And certainly didn’t know that he hit 3 triples in that ’47 Series.
Geez, the guy’s from Montclair, NJ, where my sister lives, and he’s the all-time WS triples leader (he and Speaker both had 4). How did I never hear of him?
Now John, if you had been paying close attention to my comments you would have known I have mentioned Billy Johnson twice since Sept.20. I even mentioned his 3 WS triples on Sept. 20, 2012, post #165, under blog Alex I’ll Take the Yankees….
Johnson held the record for most RBI by a Yankee third baseman until broken by Graig Nettles.
Richard @34 — Wait, now: Who’s this Grieg Netters lad you speak of?
Anyway, I see that when he wasn’t lacing October triples, Billy (Don’t Call Me White Shoes) Johnson was performing such amazing feats as:
– being the last Yankee to reach 90 RBI with 10 HRs or less, which he did twice;
– slugging 2 HRs in a game on consecutive Sept. 1sts, 1950-51, each a 6-2 win (one Yanks, one Cards); and
– sharing the Yankee first-year record of 155 games played (1943) until Hideki Matsui broke it in 2003.
I hope you’re taking better notes than I did. 🙂
John A @35, “Grieg Netters” was a Norwegian born skier and soccer player who left the University of Oslo after two years to enter the Curtis Institute in Philadelphia in their conducting and composition studios. His athleticism with the baton was noticed, and the Yankees offered him a contract. Never had a lot of power, but great speed on the base-paths and excellent bat control. Career cut short by a shoulder injury (non-conducting arm) he returned to the world of music, and, during the 1940’s and 50’s, led some of the great orchestras of the world, including the Philadelphia, the Chicago, and L’Orchestre de la Suisse Romande. Finished his career with three years in Salzburg, where he showed an unexpectedly light touch with Mozart, before retiring. Thought you should know.
Mike L — Oh, THAT guy! Thanks for reminding me.
But you left out his tenure with the Brooklyn Dodgers Sym-Phony Band.
epm @ 16 and Artie — Similar game affecting the totals of a member of the HOF, (1 more run, actually) , this time a start – http://www.baseball-reference.com/boxes/SLN/SLN196706290.shtml the idea of one-game do-overs is appealing , and I think in the run context of the time the WAR effect was probably worse, but I have no clue how to do the math , but I am typing this with a cards cap on my head, trying to improve my baseball smarts.
I was a jinx to Bob Gibson that year. The two games I saw him pitch in person in 1967 were that game and July 15, when Clemente broke his leg. Good thing for the Cardinals that I didn’t get to go to Busch Stadium to see him pitch in Game Four of the Series.
Also, Oliver’s “Transactions” list beats Lofton’s and Henderson’s. It’s quite a read…
Gosh. Way back in the 1996 ALDS, back when Joe Torre was still “Clueless Joe”, back before any of the Yankees’ recent titles, when we were just another one of those teams that were happy to be playing in October–I know at least you’re with me, Voomo–things were square 1-1 with Texas, back then. We considered ourselves lucky to be tied with those powerful Rangers, only evening the series by winning game two with late pluck and later luck. That Jeter kid sure is clutch, starting the winning rally in the 12th with a lead off single. But now we had to go to Texas, where we’d had problems.
Twenty-five year old Darren Oliver started game three for Texas and was lights out. Entering the ninth, he’d held the Yanks to a single run on just four hits. Bernie took him deep in the first but that solo home run was all we’d been able to get and trailed 2-1, in danger of falling into an elimination game the next day on the road in loud, carnival-like new Arlington Stadium. Bernie Williams was a monster that October, but we needed more.
Jeter led off the ninth with a single, naturally. Tim Raines followed up with a gritty eight-pitch at bat and laced a single up the middle. The Yanks plated two in a lightning fast rally. This was truly Jeter’s debut, the first three postseason games of his record 158 (and counting). All the Jeter memories, and there are countless for Yankee fans like me, almost without exception were still in his future.
Good to see Oliver still pitching well; makes it easier to pretend Jete’s not ancient and thus won’t be completely immobile this spring. Sorry didn’t want to hijack the thread but I always think of that game when I hear Oliver’s name mentioned. If I close my eyes, I can almost see Mariano Duncan’s first-pitch screamer back up the middle to plate the go ahead run in that ninth inning.
You didn’t hijack–it’s totally relevant. I could read recollections like this every day. It’s my favorite part of this site.
This is a great post, nicely supplemented by Doug’s and Dalton’s tables for 37-41 year relievers old 1901-present.
I confess that i hadn’t noticed Oliver, really, and this is the kind of player that I love to learn about.
Approximately one inning’s quality non-closing work a few times a week appears to be paid more logically than closing. I have not checked exact figures, but Oliver certainly appears to be a solid bargain for Toronto, for approximately 60 innings/year. How much is +/- 60 innings pitched a year actually worth?