
“Well … yes, and here we go again.”
Previously, I discussed the platooning of Stan Musial in his rookie year, noting that the 1942 Cards faced a lot of lefty starting pitchers.
I didn’t know the half of it.
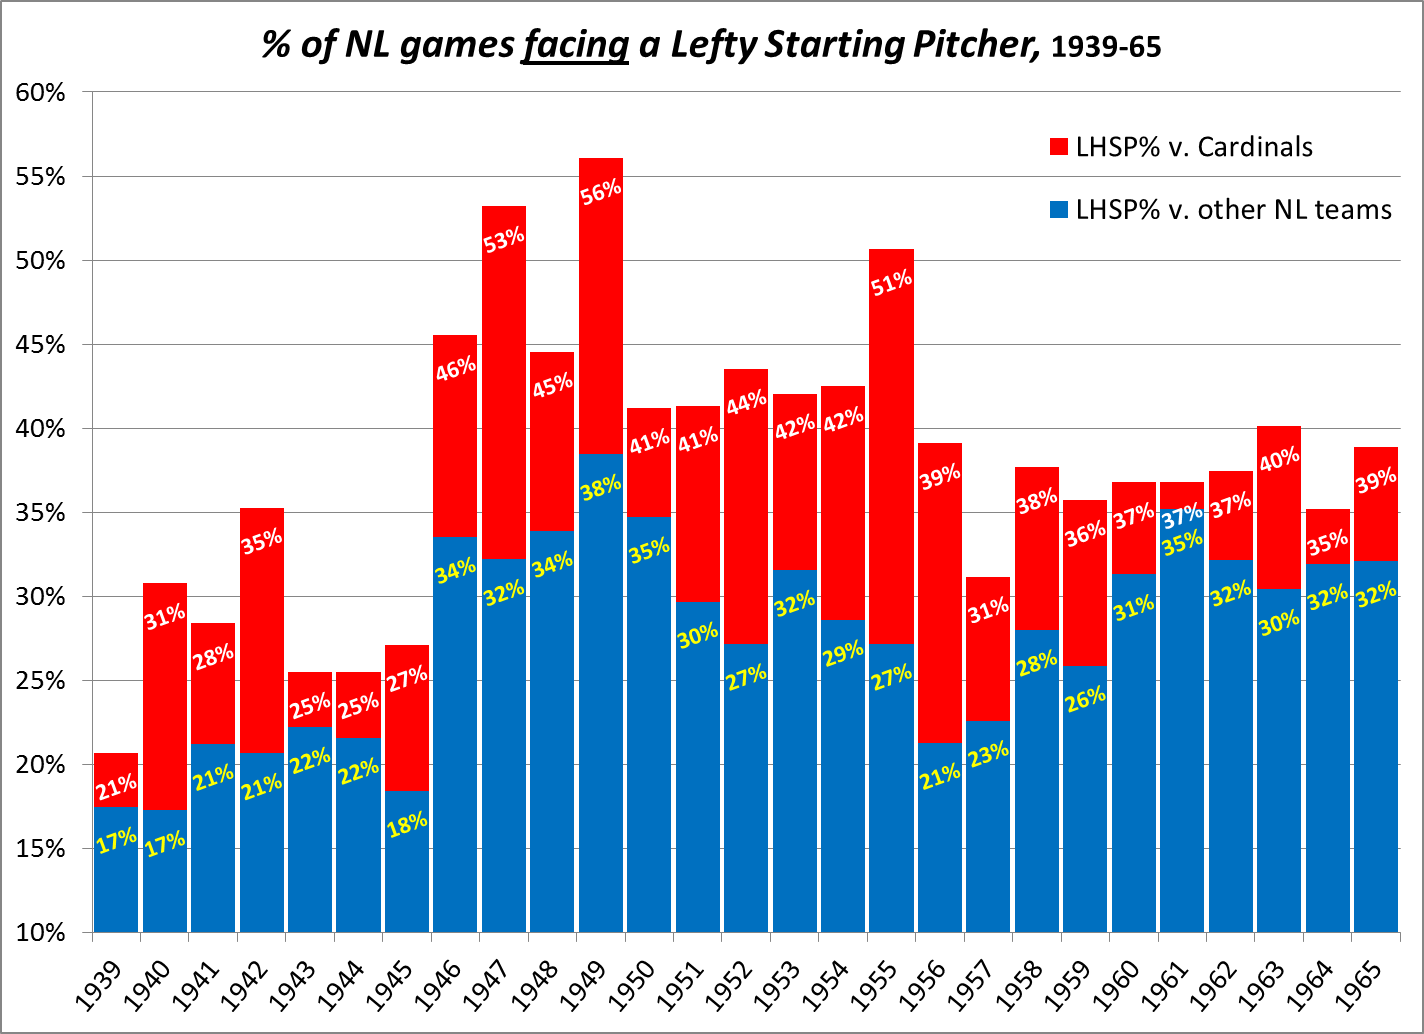
In the course of Musial’s career, the Cardinals faced a lefty starter in 40% of their games — a rate 38% above the rest of the National League.
In the first postwar decade (1946-55), St. Louis faced a LHSP in 46% of their games, a rate 45% above the other NL teams: 71 games per year for the Cards, 49 for the other seven clubs.
The following chart shows the rate of lefty starters against the Cardinals and the rest of the NL from 1939-65 (showing 2 years beyond each end of Musial’s career).
Stan the Man vs. Southpaws
Despite sitting against lefties as a rookie and somewhat in his later years, Musial faced a LHSP in 38% of his actual games played. The precise PA platoon data are only 67% complete for Musial, but show him facing 36% lefties.
A hunch says that’s among the highest rates of any great lefty hitter. But why play hunches, when we have the Batting Split Finder?
[sound of numbers crunching]
The results are in! Using the actual platoon splits for all known plate appearances,* here are the top 10 career rates of lefty/lefty PAs (with at least 500 games against a southpaw):
| 38.1% | Bobby Murcer |
| 37.8% | Graig Nettles |
| 36.9% | Larry Doby |
| 36.3% | Keith Hernandez |
| 36.2% | Stan Musial |
| 35.3% | Don Mattingly |
| 35.2% | Mickey Rivers |
| 34.4% | Tony Gwynn |
| 34.4% | Reggie Jackson |
| 34.2% | Darryl Strawberry |
* Data are complete since 1973 and incomplete back to 1945.
From this group, 31 players had at least 2,400 hits in platoon-known PAs. For those 31 hitters, the median rate of lefty-vs.-lefty PAs is 29.8%. Here are the top 5 and bottom 5 from 2,400-hit subset:
| 36.2% | Stan Musial |
| 34.4% | Tony Gwynn |
| 34.4% | Reggie Jackson |
| 33.3% | George Brett |
| 32.9% | Barry Bonds |
| 27.5% | Bobby Abreu |
| 25.7% | Kenny Lofton |
| 25.4% | Bill Buckner |
| 24.4% | Carl Yastrzemski |
| 23.6% | Harold Baines |
____________________
Lurching Left Against the Cardinals
It began in 1940, before Musial arrived. In prior years, the perceived lefty vulnerability of Johnny Mize (1936-41) and Enos Slaughter (1938-) perhaps was offset by righties like Joe Medwick and Pepper Martin. But in 1940, Medwick was dealt to Brooklyn, Martin was a part-timer — and the Cards saw 48 southpaw starters, while the rest of the league averaged 27.
By 1942, their rate of facing lefties was up to 35% — 55 games, while the rest of the league averaged 32. The wartime talent drain kept the LHSP% against the Cards to a mildly elevated level from 1943-45. But the vets came home by ’46, and over the next 10 years, the Cards saw no less than 41% LHSP in any season.
Why did they do it?
The Cards in this era never really had a heavily left-handed lineup; only in ’52 did they have more LHB than RHB with 300+ PAs. But their regular lineup usually had 3 lefties and 1 switch-hitter. And of course, one of the lefties was the best hitter in the league. (Musial logged 10 of the top 30 NL seasons in Rbat during his career.)
And in any realm of unscientific observation, early results tend to create a selective-notice bias. The strategy began in 1940 and was very effective in two of its first three years. Musial became a regular in ’42 and was platooned. After that, as long as Musial was around and the Cards had at least a couple other lefty regulars, the occasional big success was enough to “confirm” the strategy in the eyes of opposing managers.
There were several years in this era when the Cards played as well or better against southpaws as they did against righties, sometimes much better, but those did not form any kind of noticeable trend. The strategy might have faded when Slaughter left after 1953, but it was quite successful in 1954, and again in 1955-56. So even though the Cards fared much better against lefties than righties in 1957-58 and 1960-61, the lefty strategy continued through the end of Musial’s career.
Why could they do it?
Rotations and roles were much more flexible than they are now, especially in the postwar decade 1946-55:
- Rotations: Rest patterns were not fixed in stone. Three days’ or (more often) four days’ rest was normal, but 37% of all starts came on 5 or more days’ rest. Shifting the rotation order based on the opponent was common.
- Roles: 92% of pitchers who started 25+ games in a season also pitched in relief that year, and even those with 30+ starts also averaged 4 games in relief. Pure relievers were not yet common; just 5 per year in this period had 40+ relief outings without a single start.
The frequency of doubleheaders added to the number of short-rest and spot starts. The Cardinals averaged 20 doubleheaders per year during Musial’s career. Most doubleheaders require either a short-rest start or a spot start. Against St. Louis, a lot of those would be made by lefties, especially the spot starts. Note the rest patterns of LH and RH starters against the Cards in that decade:
| Days’ rest | LH SP | RH SP |
| 2 or less | 11% | 11% |
| 3 days | 25% | 30% |
| 4 days | 21% | 26% |
| 5 or more | 43% | 32% |
Lefty starts against the Cards came much more often on long rest (mainly spot starts) than did the righties.
But did it work?
Overall, lefty starters in this period did fare better than righties against the Cardinals. From 1940 (when the strategy began) through the end of Musial’s career in 1963, the Cardinals’ winning percentage was .575 against RH starters, .537 against LH starters. That’s a net gain for opponents of 6 wins per 154 LH games — which is even more notable since a lot of those extra LH starts came from guys who weren’t good enough to be in the regular rotation.
The Cardinals’ record against LH and RH starters did not necessarily track the relative scoring averages. For example:
- In 1959, they scored slightly more runs per game against LHSP, but the winning percentages were .364 left and .515 right.
- In 1948, they scored 19% less against LHSP — nearly a full run per game — but had a better W%, .575 to .534.
- In 1950, they scored 8% less against LHSP, but had a much better W%, .571 to .467.
- In 1945-46 combined, they averaged 6% more runs against LHSP, but had a far worse W%, .584 to .645.
Of course, in yearly split samples, a few blowouts on one side of the ledger can skew the overall picture, and the specific identities of the starters may be more important than which hand they threw with. But taking 1940-63 as a whole, St. Louis scored 4% less against lefties, and they won 4% less often.
What about the World Series?
St. Louis faced a lefty starter in just 3 of their 23 World Series games with Musial (1942-44 and ’46), winning twice. The ’42 Yankees just didn’t have any southpaws available. In ’43 they had Marius Russo, who tossed a no-ER CG to beat the Cards in game 4. The ’46 Red Sox threw Mickey Harris in games 2 and 6, but Harry Brecheen outpitched him both times.
Pennants Lost to Lefties?
Three times in Musial’s career, their record against southpaws arguably might have cost the Cards a pennant. In 1945, ’49 and ’63, their winning percentage against righties was either better than the pennant-winner’s overall W%, or close enough to flip a coin for the outcome.
In 1945, with Musial and Slaughter both in the service, the Cards lost by 3 games to Chicago (despite winning the series 16-6). Against righties they played .634 ball, just off Chicago’s overall .636. But against southpaws they went 24-18, .571 (despite scoring more against lefties). To make their LH W% as good as their RH W% means a record of 27-15, which would have tied them for the top spot. No individual lefty had great success against the Cards that year, but Pittsburgh’s Fritz Ostermueller (a good pitcher having a bad year) beat them in both his tries, accounting for 40% of his season wins.
In 1949, they lost by 1 game to Brooklyn (and won that series, 12-10). This was the year they faced a lefty in 56% of their games, the highest rate in the period studied. Against RHSP they played at .632, just ahead of Brooklyn’s overall .630. Their record against lefties was an outstanding 53-33 (.616) — Musial and Slaughter combined to OPS over 1.000 in southpaw starts — but if their LH W% had matched their RH W%, they would have won the pennant. Brooklyn’s Preacher Roe made 7 of his 27 starts against the Cards and logged a 2.02 ERA as the Dodgers went 4-2 in those games (one tie). The Cards were shut out 9 times by lefties (twice by Roe and Johnny Vander Meer), just 4 times by righties, and they scored 15% less against lefties.
But 1963 really stands out: The Dodgers won the pennant at 99-63, .611. The Cards against RHSPs were 63-34, a dominant .649 W% equivalent to 105-57 in a full season. But against lefties, the Cards went 30-35. Seven more wins that way — 37-28, .569, still far below their RH rate — would have won the flag. In fact, they could have tied for first by reversing just 3 targeted games: L.A. went 9-3 in LH starts against the Cards, and won all 5 starts by Sandy Koufax, who allowed 5 runs over 46.2 IP. (Good luck reversing any of those outcomes.)
It’s not obvious that the ’63 Cards would be vulnerable to lefties. Their lineup was balanced; 60% of their PAs came from righties, and 3 of their 4 best regulars swung from that side (Ken Boyer, Dick Groat and Curt Flood). But all three hit better in RHSP games that year, and none of the other RH bats picked up the slack against southpaws. Meanwhile, 3 of their 4 LHB regulars posted large OPS platoon splits — Bill White (.692/.942), George Altman (.609/.789) and The Man himself (.570/.790 in his swan song).
By the way, the 1964 Cards — the first year without Musial — fared almost as badly against southpaws (29-28) as in ’63, and posted the same overall record, but won the pennant by 1 game.
Other Costs of the LHP Barrage?
I’m speculating, but the Cardinals’ weakness against lefties in 1954-56 may have deprived an excellent hitter of two years in the majors, and also led to a foolish trade of a Rookie of the Year.
In mid-1954, first baseman Joe Cunningham was called up from AAA, where his .471 OBP was leading the league. After a splashy debut — 9 RBI and 3 HRs over his first two games, with 2 taters off Warren Spahn — he settled down to a .375 OBP and 113 OPS+ while starting 84 of the last 86 games. He was one of the best NL rookies that year. And over his next three full years, Cunningham was brilliant, with a combined .328 BA, .448 OBP and 144 OPS+.
But in between, he went back to the minors … for two full years.
What circumstances left Cunningham without a position on the ’55 Cards? First, Stan Musial was moved to 1B. The outfield was still full enough that there was no clear need for an on-the-job trainee. Bill Virdon, the prize of the Slaughter trade, made the club in ’55 after a big year at AAA (playing with Cunningham) and won Rookie of the Year. Wally Moon, the ’54 ROY, got pushed out of center by Virdon and spread his games around the OF and 1B. Powerful Rip Repulski was the mainstay in LF.
At first glance, I figured that Cunningham’s demotion was for outfield training, since he played there a lot once he returned to the majors in ’57, and Musial’s shift to 1B was presumably permanent. But no; the records show Cunningham played only first base in those years. So why wasn’t he in the mix for the ’55 Cards, who gave 250 PAs combined to weak-hitting OFs Pete Whisenant and Harry Elliott?
And why was Virdon traded in May ’56 after a slow start, in exchange for two marginal talents?
It might have been a lefty/righty issue. Virdon and Cunningham batted left, and the Cards from 1954-56 got creamed by lefty starters — records of 26-39, 28-50 and 26-34, a combined .394 winning percentage. Against RH starters, they played at .527.
Both Virdon and Cunningham actually hit just fine against southpaws, as rookies and over their careers. But with the team getting stymied by lefties, there may have been a natural bias against keeping Cunningham as an inexperienced fourth outfielder. Note that ’55 OF reserves Whisenant and Elliott were righties, as was ’56 addition Hank Sauer (acquired in a trade for Whisenant).
And Virdon was replaced in ’56 by a RHB, Bobby Del Greco. Even without hindsight, this trade looks like one of many overreactions by Frantic Frank Lane, who had just taken over the Cards. The reigning Rookie of the Year was dispatched for a marginal CF prospect and a 30-year-old pitcher, Dick Littlefield, with a career mark of 27-44 and a 4.72 ERA (88 ERA+).
Littlefield lasted a month and was soon washed up; Del Greco made it through the year, batting .214, before getting dealt for a warm body. Virdon hit .319 that year, and while he never quite matched the promise of those first two seasons, he had a long and solid career as a glove-first CF, averaging 1.5 WAR over 11 full seasons.
And Trader Lane lasted just two years in St. Louis, moving on to his destiny as the archvillain in Cleveland lore.
Trying to set a record for the least important and most pedantic correction ever: Enos Slaughter is no longer playing for the Redbirds, or anyone else.)
Did you check LHSP on a home vs road basis? The Cards played their home games in Sportsman’s Park/Busch I, which had a high fence over a close right field wall. Essentially a reverse Fenway. Teams may have used many lefties in St Louis as teams used many in the Bronx. (360′ LF corner, 310″ RF.)
I checked Musial’s Event Finder (available for most, though not all, his PAs from 1946 on). About 35.1% of his PAs at home that show up on the Event Finder were against lefty pitchers, while about 37.1% of his PAs on the road were against righty pitchers. So for that sample at least, there is no evidence of his seeing more lefties at home.
kds, excellent question, and no, I didn’t think of it before now.
But now that I’ve checked, there was no significant difference in the home/road LHSP rate. For 1940-63, the breakdown was 718 home, 727 away. For the focus period 1946-55, 360 home, 354 away.
I dunno, it cracks the myth that Musial was consistent – if he was worse against LHP, he would’ve gotten 1.25% less hits at home than on the road instead of the 1815/1815 split he had, since he faced 1.25% fewer LHP 😉
Frank Lane once tried to trade Musial for Robin Roberts but the Cardinals’ owner blocked the trade. He also made 241 trades in 7 years as the White Sox GM! And as Cleveland GM, he traded manager Joe Gordon for Tigers’ manager Jimmy Dyke.
And while everyone remembers the disastrous Colativo trade, he made an equally poor trade 5 days earlier, sending a young Norm Cash to the Tigers in exchange for Steve Demeter, a 3rd baseman. Whereas Cash went on to be a mainstay in the Tigers’ lineup, Demeter, who was only 25 years old, only received 5 PAs with the Indians.
Regarding Lane’s proposed trade of Musial for Robin Roberts — I’m assuming that would have been in the winter of 1955-56, when Lane had just been hired as Cardinals’ GM, and Roberts was coming off a 23-14 year, his 6th straight of 20+ wins.
We know now that Roberts would have no more of the truly great years like he had in 1950-54. But it’s interesting to analyze the trade from the vantage point of that time, in terms of allocating the Cards’ resources.
1) Roberts was 6 years younger than Musial. But he had a lot of mileage on the ol’ soupbone, having averaged 323 IP and 27 CG in the past 6 years.
2) The Cards had Joe Cunningham ready to take over at 1B, currently wasting away in AAA.
Now, even though Cunningham went on to have 3 excellent hitting years from 1957-59, I’m not claiming that a reasonable person looking ahead from winter ’56 would expect Cunningham to match Musial’s production.
But from that same vantage point, I think Roberts looks like a big upgrade over some of the SPs St. Louis used in the next few years.
If I were the new GM in that situation, I wouldn’t dare take the risk. But just in terms of expected value, it doesn’t seem crazy.
Frank Lane has to shoulder at least some of the blame for the Cardinals’ dismal decade of the 1950s. He made headlines with his trades everywhere he worked, but I don’t think any of his teams ever won a pennant.
Monumental piece of work, John. Fantastic stuff.
Cunningham had a monster 1959 season, with a .453 OBP, leading 2nd place Hank Aaron by 52 points! But, Aaron took the batting crown, .355 to .345, which, of course, is what everyone will remember.
Cunningham never came close to matching the power he previewed with 11 HR in 85 games in 1954. Best season after that was 12 HR in 131 games in 1958. Of 591 retired players since 1901 with 10+ HR as a rookie, Cunningham is one of only 29 players who would have a 3000 PA career with 75 or fewer HR.
Further on Joe Cunningham. This was the kind of company he was in after that 1959 season (1500-2000 PAs in first 5 seasons, batting .300 with 130+ OPS+).
Generated 2/4/2013.
But, it just didn’t work out after that.
John, I just love this article. Your process is enjoyable to read and informative to understand.
Pingback: High Heat Stats » Snuffy & the Wartime Peaksters