
LOOGY, referring to the lefty one-out guy, a term coined by Rob Neyer when they became quite popular in the early 1990s.
Here’s a chart looking at single-batter lefty-reliever appearances over the years.
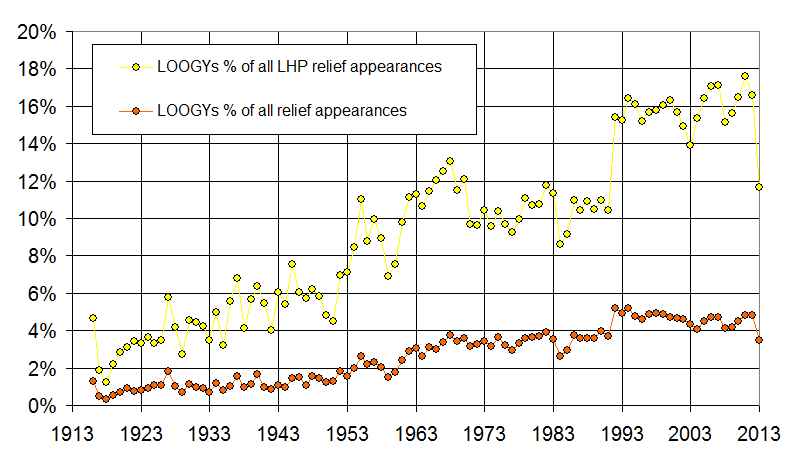
Here, one-batter lefty appearances are plotted as a percentage of all left-handed relief appearances, as well as all relief appearances.
Here are a few thoughts:
- The percentage of one-batter lefty appearances has increased continually over the last 100 years, save for marked slowdown starting in 1968.
- Although it may seem like the percentage is way down in 2013, the use of LOOGYs picks up late in the season. I imagine when rosters grow on September 1st, it must make managers more willing to throw a reliever in for a single batter. In 2012, there were 192 LOOGY appearances from September 1st onward out of 697 total for the year. That’s about 28% of all LOOGY appearances coming in the last sixth of the season. So, we can expect the 2013 season number to fall back in line with the roughly 16% figure from recent years.
- It’s interesting to note that LOOGY use jumped up in 1992, not 1993, when we might have expected. I can’t come up with any reason why the figure would jump so suddenly in one year, especially since the LOOGY use is a managerial decision. It seems surprising that usage jumped so much in just one year, but it must be down to 1 or 2 specific managers who started using one or two LHPs that way.
- It’s a bit surprising, then, that since that jump in 1992, it hasn’t changed much since. It hasn’t for example, pervaded the entire league, at least not at the same rate as it was done by the first team or two.
Okay I ran some numbers between 1991 and 1992:
LOOGYs with more than 10 appearances in 91 but none in 92: None
LOOGYs with more than 10 appearances in 92 but none in 91: Dennis Powell (SEA, 11), Derek Lilliquist (CLE, 18), Kevin Wickander (CLE, 10), Mike Munoz (DET, 18), Pat Clements (SDP, 10), Vince Horsman (OAK, 19)
LOOGYs who decreased their appearances in 92 by at least 10 under 91: None
LOOGYs who increased their appearances in 92 by at least 10 over 91: Tony Fossas (BOS, +24), Rick Honeycutt (OAK, +13), Jesse Orosco (MIL, +12), Bob McClure (STL, +11)
Eight of the ten pitchers mentioned were in the AL, which I find interesting. CLE is the only club mentioned twice, though. CAL, TEX, and MON were the only clubs with manager changes that season and they don’t appear on there at all. In fact, the AL LOOGY usage went up 111 while the NL went up only 28.
All told, we find five teams that contributed to this sharp spike in 1992: Boston, +26; Oakland, +24; Houston, +20; Cleveland, +13; Minnesota, +12. The managers at the time were Butch Hobson, Tony La Russa, Art Howe, Mike Hargrove, and Tom Kelly.
The rise of the LOOGY in the 1990s seems to correspond with the mysterious fall of the lefthanded starter mentioned in the other post… Hmmm….
You’ve gotta love the 2-LOOGY, 5-pitcher inning … without a run scoring.
http://www.baseball-reference.com/boxes/ARI/ARI201209200.shtml
(Yeah, I know — “the strategy worked!”)
Lefty/Lefty fact from the pre-LOOGY era: What lefty pitcher in MLB history struck out the most lefty batters in a season without starting a game? I believe it was Bill Henry pitching for the Cubs in 1959, who faced 187 lefty batters that season and struck out 57 of them (and only walked 5 of them). Henry and righty teammate Don Elston tied each other for the NL lead in pitching appearances that season (65 games each). Only Ernie Banks had more WAR for the 1959 Cubs than Henry, whose 4.4 WAR that season has not been topped by any relief specialist in the NL since 1989.
Henry’s 134.1 IP in 1959 are the fifth most by a lefty with zero starts.
Generated 5/19/2013.
Henry had 115 total SO in that 1959 season, good for a 7.70 SO/9, one of 5 players that season to reach that mark or higher in 125+ IP.
Prior to the 1959 season, there had been only 11 live-ball era seasons with a 7.70 SO/9 in 125+ IP. Prior to the 1956 season, there had been only 6 such seasons by 4 pitchers: Feller (3 times), Newhouser, Score and Vandermeer.
To point out the pathetic nature of Cub management in that era, Henry was traded after that season to the Reds. The previous season Jim Brosnan, who had also done well, was traded to the Cards, and eventually to the Reds. In 1961 Brosnan and Henry were the relief tandem for pennant winners, 16 saves each, plus 10 relief wins for Brosnan.
Brosnan is famous for his book The Long Season, but I personally thought his follow up, Pennant Race, about the ’61 Reds, was better.
I’ve always found it peculiar that lefties, which are usually in short supply (unless wearing pinstripes), could be used so capriciously as to face just a single batter.
One would think that a ROOGY would be a better idea, what with the relative abundance of righty arms plus a larger target of opportunity. You could use one or two of them in a game in critical spots, yet still hardly put a dent in those 8-man bullpens that are all the rage these days.
I did actually pull the ROOGY data as well when researching this post, but I forgot to incorporate it when the time came. I don’t have it in front of me, but I think the general trend is actually fairly similar to the use of LOOGYs. I think it has more to do with teams carrying an increasing number of pitchers than anything else.
Rob Neyer? According to this, it was actually John Sickels who came up with the name LOOGY.
Pingback: High Heat Stats » Bill Henry, 1927-2014