
This post looks at the distribution of standout position players across decades, both Hall of Famers and others. The seed was birtelcom’s recent “Hall of Famers by Final Year in the Majors,” and more precisely, from an exchange we had in those comments, which I’ll summarize (with apology for any loss of context to birtelcom’s quote):
- John: The number of teams has grown from 16 to 30 since 1961, so you’d expect eventually to see more HOFers per decade in the post-expansion era.
- Birtelcom: Just because you have more teams doesn’t necessarily mean you get more of the greatest players.
From one angle, I see his point: If we could define greatness in absolute terms, without reference to their particular era, then they might be quite unevenly distributed across decades.
But is an absolute, context-free ranking even possible? Can you make an absolute comparison between Frankie Frisch and Bobby Grich? Between Sam Rice and Jim Rice? Or even Pudge Fisk and Pudge Rodriguez?
I can’t do it. Instead, I’ll use Wins Above Replacement, a relative measure that gauges a player against his contemporaries. We still might find greatness unevenly distributed across decades. But let’s see.
We’ll start with the Hall of Famers. This graph shows the number of HOFers by decade (the blue bars), based on the decade in which they compiled their most WAR. The red and green lines show the average and median WAR for each decade’s HOFers.
Note: All players referenced in this post are HOF-eligible and have been on the ballot at least once. HOFers referenced are those elected on the basis of their MLB playing careers.
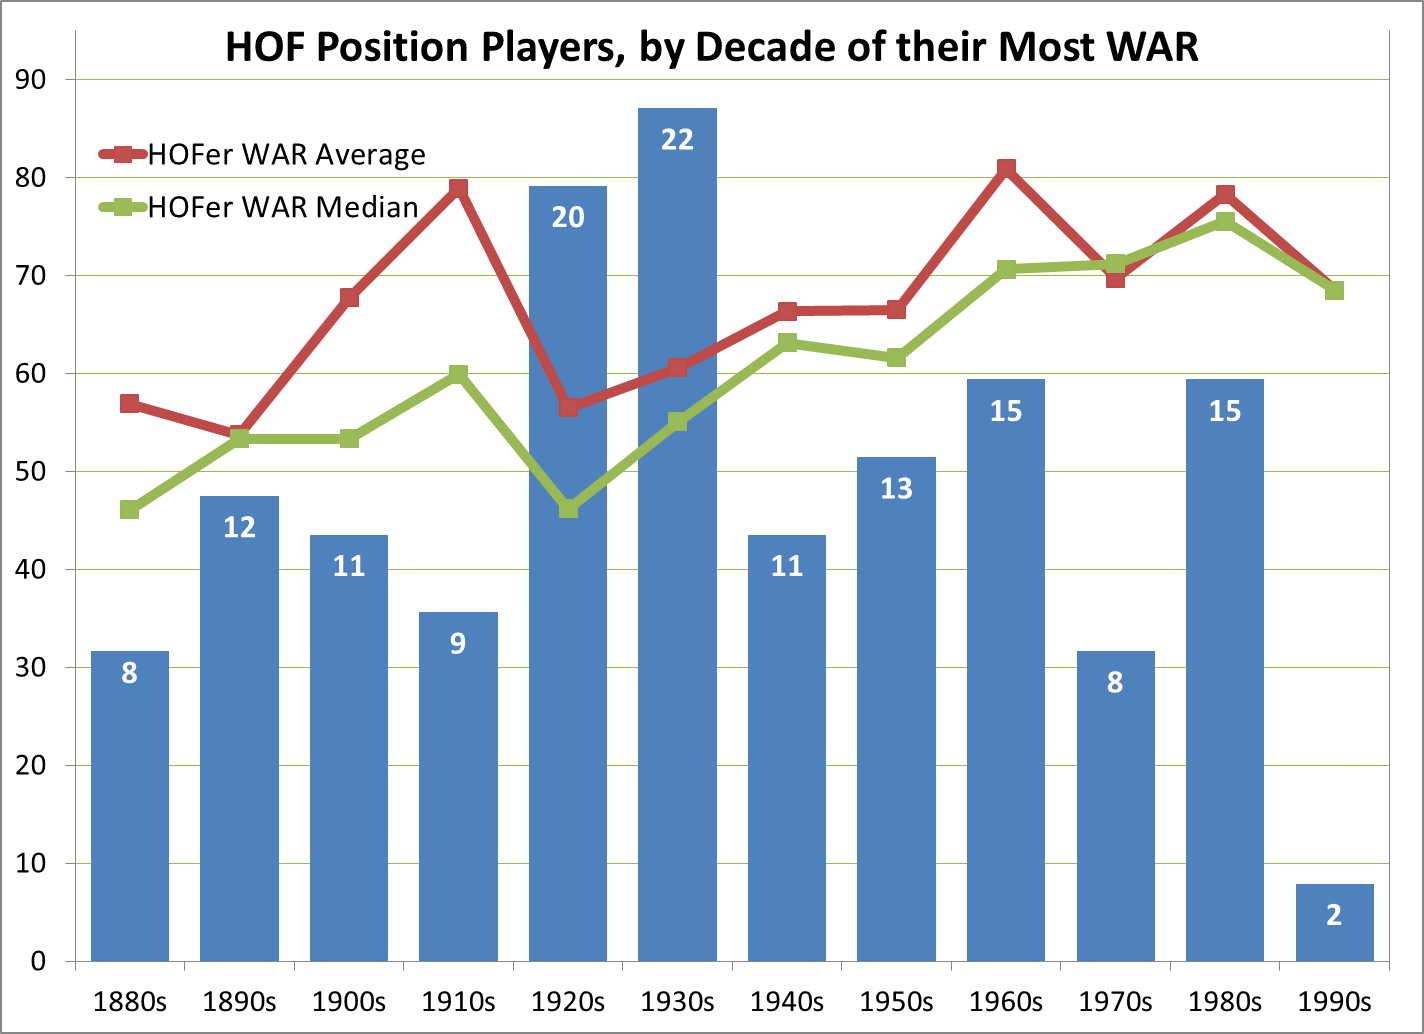
This was to show that the distribution of HOFers is uneven, and not reflective of league size. Ignoring the 1990s — as I generally will in this post, since many standouts of that era have been on the ballot just briefly, while some others have been voted down due to known or suspected use of performance-enhancing drugs — what’s most striking at first glance are the HOF spikes in the 1920s and ’30s, which don’t seem supported by the WAR numbers of those groups. There’s also a big dip in the 1970s, which had 50% more teams than the pre-expansion era.
How do those HOF numbers stack up against the pool of outstanding players in each decade? The next graph shows the number who compiled 30+ WAR in each decade (the red line), plus their average WAR in that decade (blue bars), and their average career WAR (green bars). Players are counted in each decade in which they reached 30 WAR:
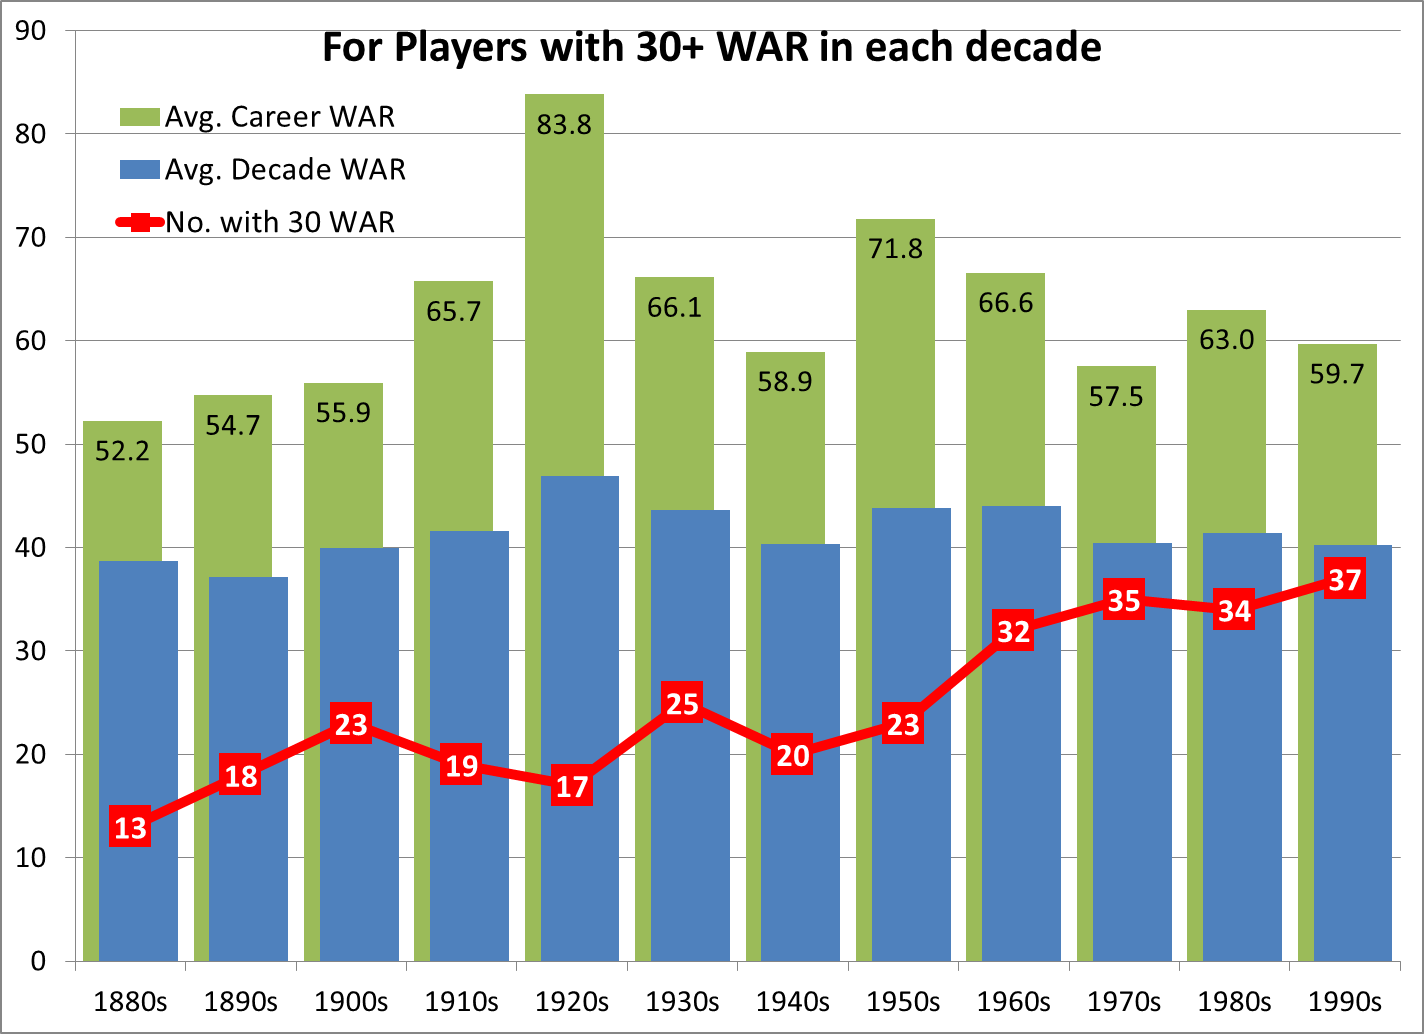
By this measure, having more teams does correlate with having more outstanding players. The expansion era has far more players reaching 30 WAR in each decade, while their average WAR for career and for decade are consistent with most prior decades.
(The career WAR spike in the ’20s comes from six inner-circle HOFers — six of the top 13 position-player WAR totals — which are averaged across a low count of 17 players with 30+ WAR in that decade. The median for the ’20s is 68.6, much more in line with the norm.)
I don’t mean to imply that 30 WAR in a decade is a HOF litmus test. Some 268 players had at least one 30-WAR decade, while the Hall numbers 146 position players. I chose 30 WAR as a round number which was attained (a) by about 3/4 of all HOFers at least once, and (b) by from one to 1.5 players per team per decade.
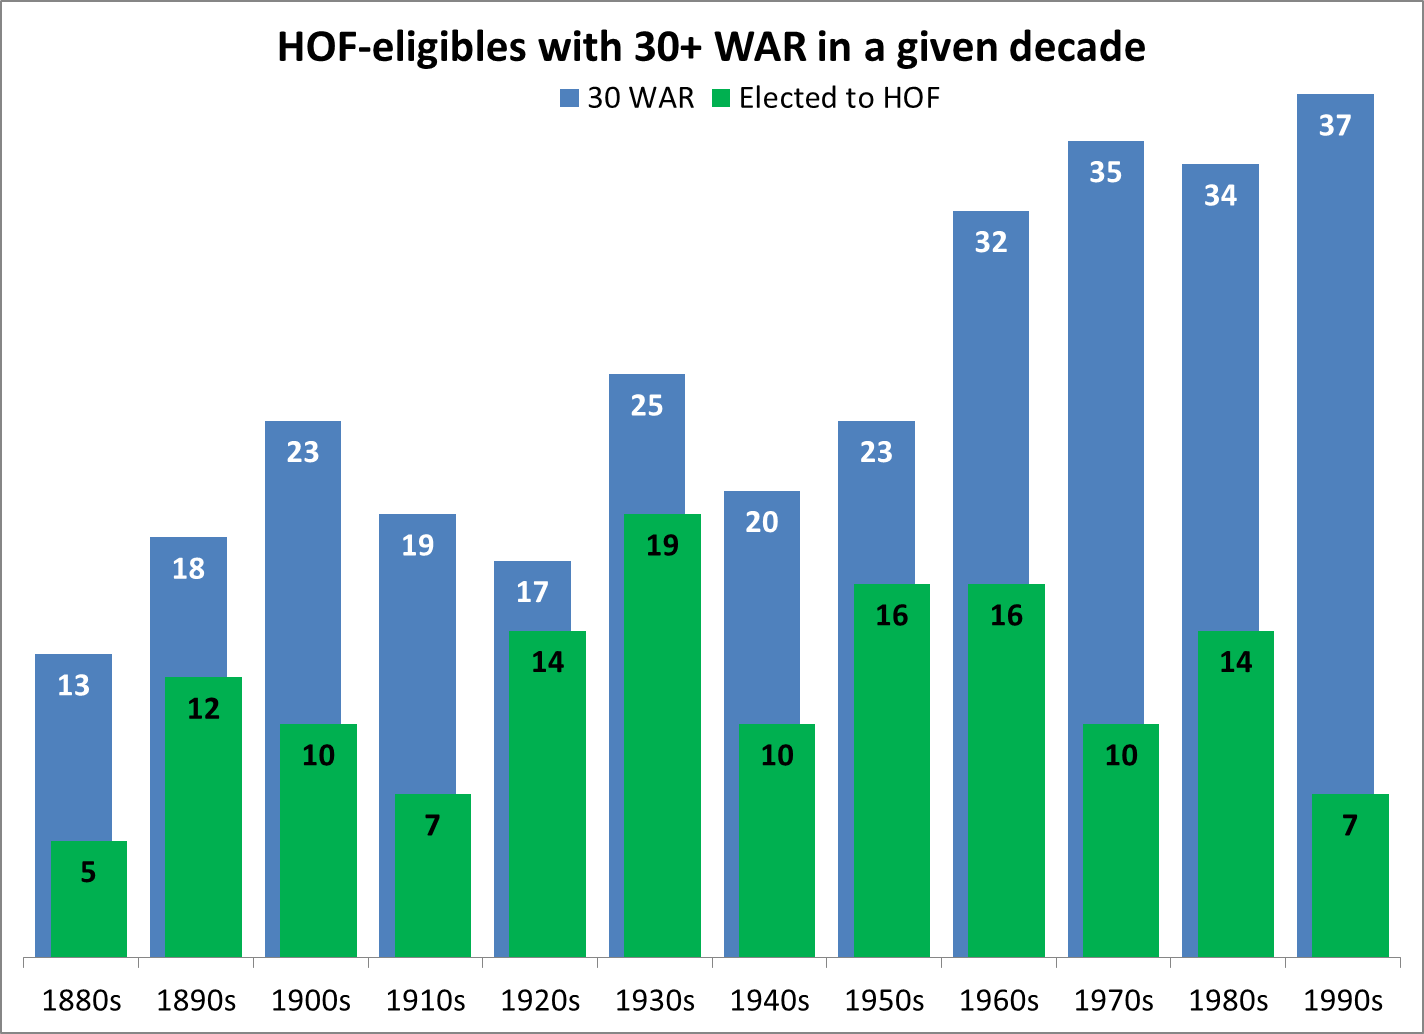
Anyway … The tally of 30-WAR players goes up in the expansion decades, but fewer of them are elected to the Hall:
Comparing eras:
- Pre-expansion, 59% of 30-WAR decades led to HOF election.
- For the 1960s-80s, it’s 40%.
But maybe the expansion-era non-HOFers just didn’t pack enough extra WAR around their 30-WAR decade to merit a Hall nod. Let’s see the career figures for non-HOFers with 30-WAR decades. How do the expansion-era unelecteds stack up to their predecessors? Pretty favorably:
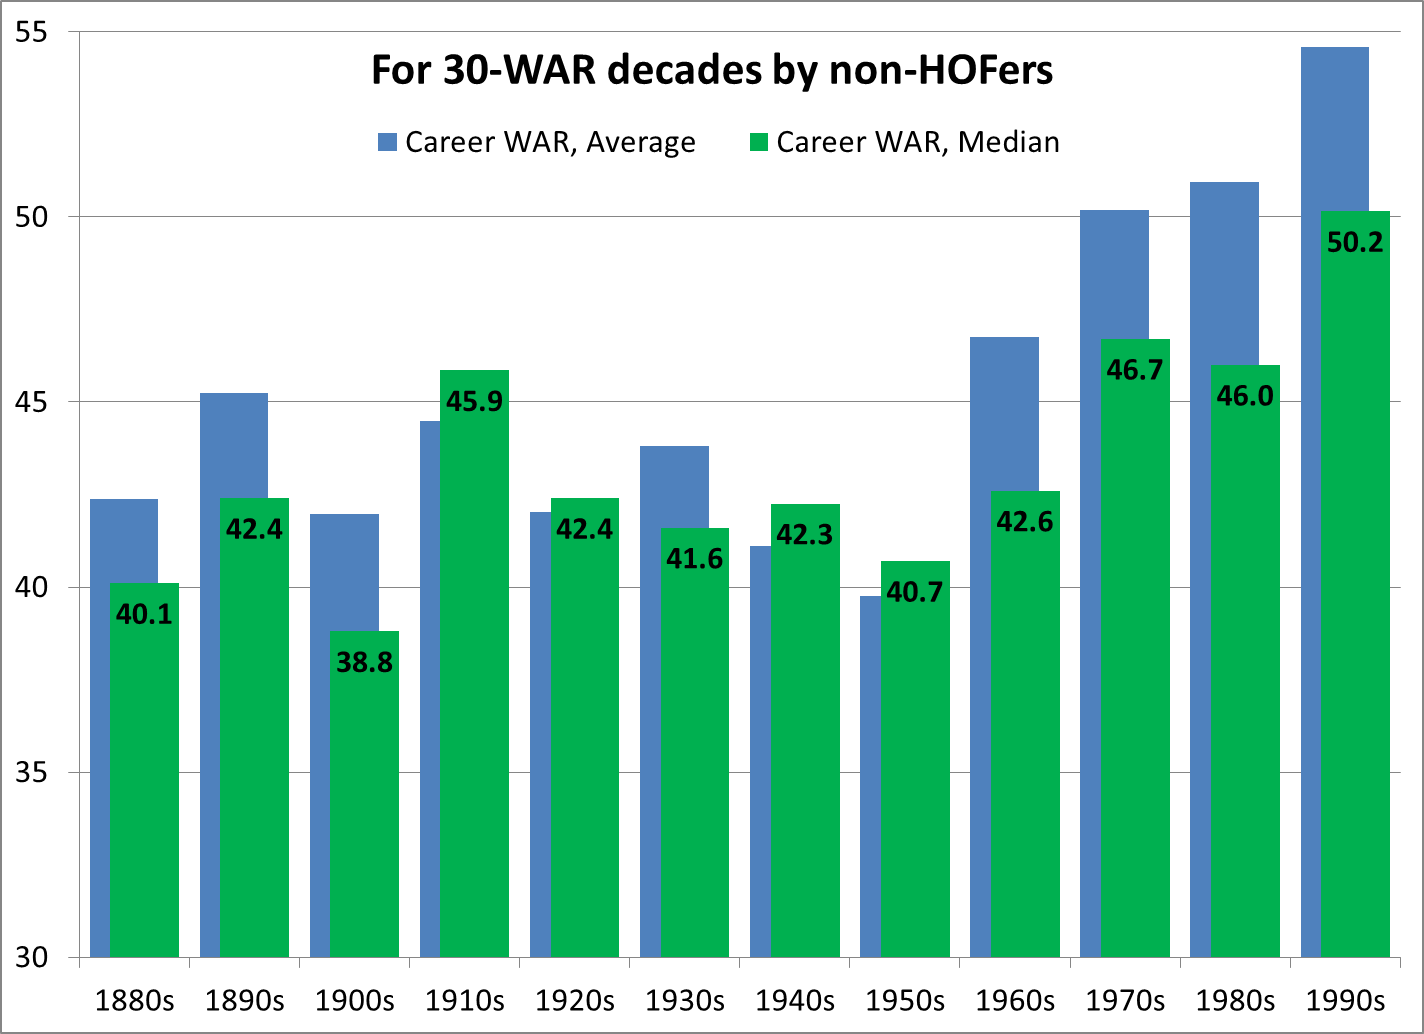
Both the average and median for each expansion decade is higher than any pre-expansion decade except the 1910s.
Still, none of this really proves that there have been more truly deserving players left out of the Hall in the expansion era than in prior decades. Perhaps the lower rates of election mostly reflects fewer bad choices; few of us want the Hall defined by its worst players. In the next passage, I’ll introduce a simple WAR standard that I think roughly picks out the upper half of HOF inductees. I hope you’ll bear with me.
The “54/27 WAR” Standard
The Hall of Fame currently holds 146 position players who were elected on the basis of their MLB careers. Sixty-one percent have at least 54 Wins Above Replacement (89/146). Sixty-four percent averaged at least 27 WAR per 1,000 games played (94/146). And exactly half meet both standards, 54 WAR total and 27 WAR/1,000 G.
The 54/27 WAR standard is not highly scientific; it’s just a simple attempt to balance WAR totals and rates in a measure that would define noncontroversial HOF selections. I looked for whole numbers where (a) about two-thirds of HOFers would meet each threshold individually, and (b) about half would meet both. And 54/27 works for that. The 2-to-1 ratio, and the fact that both numbers are evenly divisible by nine, are just happy accidents.
There’s no consensus on the right size of the Hall, and most folks will agree that the Hall has made some mistakes. But this paired standard, 54 WAR total and 27 WAR/1,000 G, roughly defines the upper half of HOF position players, numbering 73. There is little debate on their worthiness. (For example, they’re all in the Hall of Stats save Billy Herman, and he’s right on the cusp, with a 99 Hall Rating.) So the 54/27 standard has some credence as a threshold for “clear Hall of Famer.”
Well, then: There are 27 more HOF-eligible position players who meet the 54/27 standard, but have been rejected at least once by the voters. A few of those are in PED purgatory. A few are recent players who failed on early ballots but still could get in. But most are simply underrated, for one reason or another.
Again, it’s pure coincidence that 73 + 27 makes exactly 100 HOF-eligibles who meet the 54/27 standard. Incidentally, all of them had at least one 30-WAR decade except Jim Wynn, who peaked at 28.9.
The 27 unelecteds averaged virtually the same career games as the overall HOF population, while slightly besting them in career OPS+, WAR and WAR/1,000 G. If we remove Barry Bonds, the remaining 26 averaged the same 128 OPS+ as the HOFers, with slightly more WAR/1,000 and slightly less total WAR.
I am not making a Hall of Fame plea on their behalf — no, not even though three of the 27 are 1980s Tigers. I just want to look at the distribution of these Hall snubs by decade.
Here is a breakdown of those 27 unelected players by the decade in which they amassed the most WAR; decades not listed had none:
- Pre-expansion: 4
- Expansion era: 23
- 1880s: 1 (Jack Glasscock)
- 1890s: 1 (Bill Dahlen)
- 1910s: 1 (Sherry Magee)
- 1930s: 1 (Bob Johnson)
- 1960s: 3 (Ken Boyer, Dick Allen, Jim Wynn)
- 1970s: 4 (Bobby Bonds, Sal Bando, Bobby Grich, Reggie Smith)
- 1980s: 7 (Alan Trammell, Tim Raines, Lou Whitaker, Keith Hernandez, Willie Randolph, Chet Lemon, Buddy Bell)
- 1990s: 9 (Barry Bonds, Jeff Bagwell, Edgar Martinez, Larry Walker, Kenny Lofton, Mark McGwire, Robin Ventura, Mike Piazza, Will Clark)
The next graph shows three things, grouped by the decade of a player’s most WAR: HOFers who meet the 54/27 standard (blue base); additional HOFers who fail the 54/27 standard (green branch); and those who meet 54/27 but are not in the Hall (red branch):
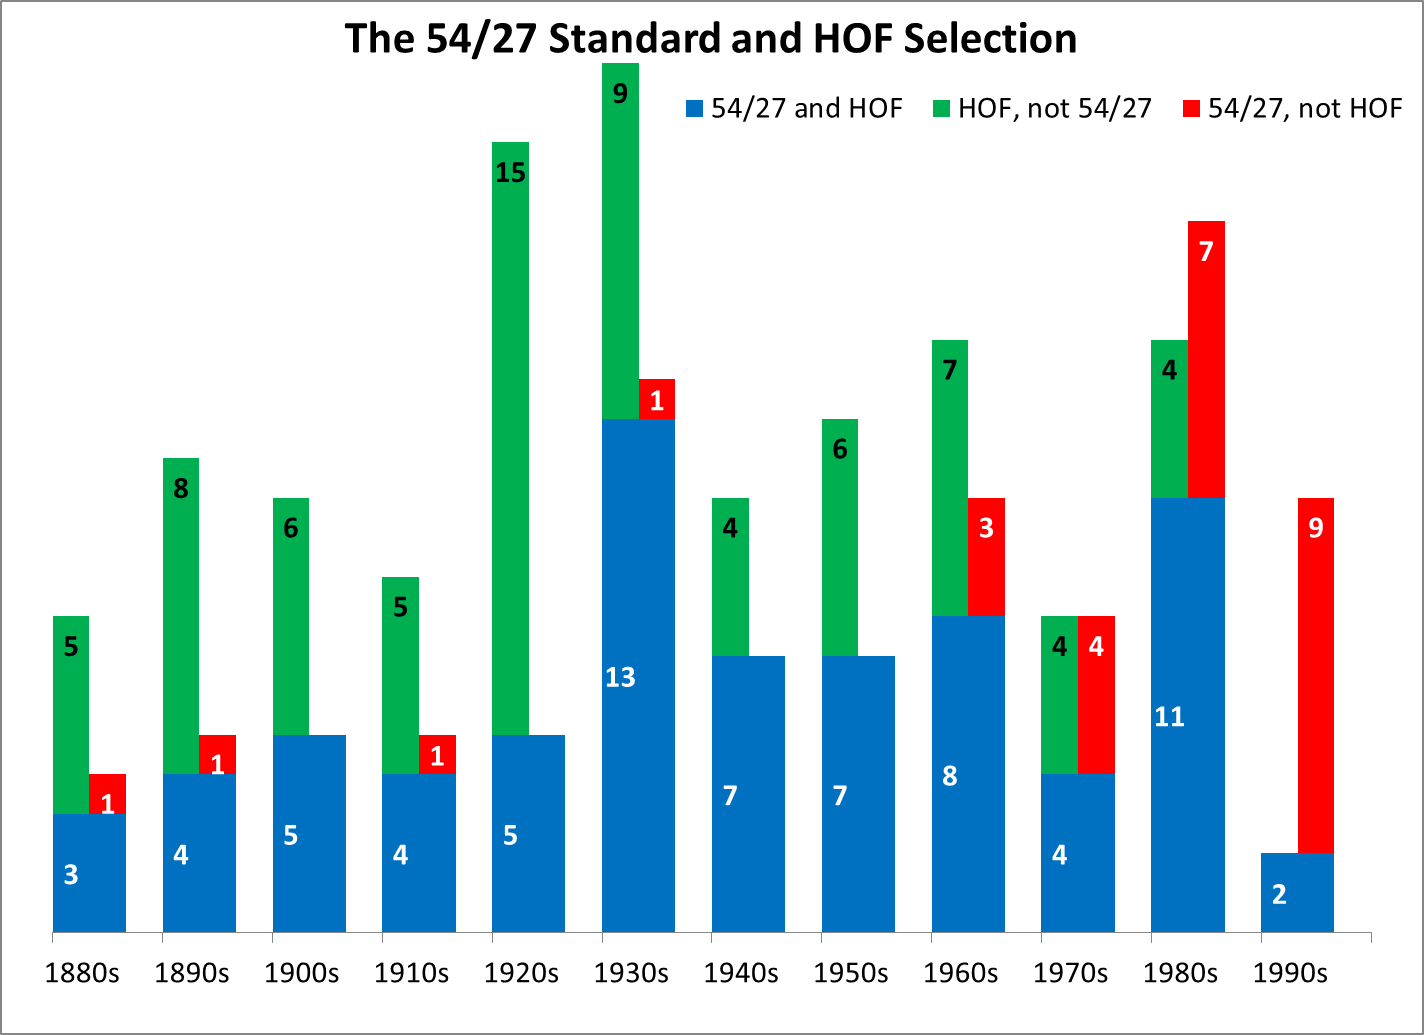
Comparing eras:
- Pre-expansion, 92% of the 54/27 players were elected (48 of 52); for the 1960s-80s, 62% (23 of 37).
- Pre-expansion, only 45% of HOFers met 54/27; for the 1960s-80s, 61% (23 of 38).
The disparity is greatest in the 1980s: 11 of 15 HOFers (73%) do meet the 54/27 standard, while 7 of 18 meeting 54/27 have not been inducted (39%). Both rates are higher than any prior decade.
Conclusion
These WAR-based studies suggest that:
- Outstanding players are pretty evenly distributed across decades, if you adjust for expansion; and
- The Hall of Fame has not adequately adjusted for expansion.
I’m not suggesting that a bunch of expansion-era stars should be voted in, willy-nilly, just as soon as possible. But I do think every Hall of Fame voter should know about this imbalance.
Thank you for reading, and please be sure to sign the guest book below!
This was fantastic, JA! A perfect way to start my morning. So many things to think about. That 54/27 thing is pretty great. And the list of players produced by it was fascinating. The only two I’ve never really seen fanatical support for are Bob Johnson (since there are already so many 1930s inductees) and Chet Lemon (since he wasn’t the best, or even 2nd best, player on his own team, and thus there are other, similar players who deserve it more). Still, it makes me a little sad that they never get the impadsioned pleas that so many others get. Thanks for the really wonderful post!
I certainly think Chester was the best player on those post-Rent-A-Team White Sox before he went to the Tigers, and that beginning at the ripe old age of 24. Of course he wasn’t the most famous player (and some argument could be given to Fisk as the best Sox player in the strike-shortened season), nor were those teams all that much in the first place.
The Jet always flew under the radar (maybe in hindsight he should be re-nicknamed The Stealth), but he was beloved by a certain bleacher contingent in Comiskey. He played very hard and usually very well. I personally couldn’t care less about the Hall of Fame and whether a player deserves to be there, but I will always remember Chet fondly.
One could certainly argue that Lemon was the best player on the ’83-84 Tigers. His 12.4 combined WAR for those two seasons is neck and neck with Trammell’s 12.6.
Good call, Ed. I can’t access WAR stats where I am, but I’d also imagine he was the best player on the Sox the instant he set foot in CF . Even as a, I’m guessing 22-year-old with the great ’77 Southsiders, he probably was the best all-around player, if only because he had to play the outfield between Ralph Garr and Richie Zisk and was no doubt forced to cover whole extra acres of it he’d never had to in the minor leagues or high school. You should get extra combat WAR stars for that kind of duty.
I’m probably missing something, but Chet Lemon as HOF-worthy is a stretch for me. He was a good player, did a bit of everything, but looking at his career box, it’s hard to see one area where he excelled, even accounting for the era:
1) his basic slash stats are nothing special (pretty good OBP, I guess)
2) middling power
3) lousy SB/CS numbers
4) scored 99 runs once, never over 80 in any other season
Okay, I did find two—got hit by a lot of pitches, consistently hit 4-6 triples a year. Also had three really good defensive seasons (take those away and he seems to be in the neutral area), and hit 44 doubles once. I’m surprised he clears the 54/27 bar.
I think you’re understating WAR’s appreciation of Lemon’s fielding. Lemon accumulated 93 Rfield, 10th most all-time for those who made two-thirds of their appearances in center field.
Chet Lemon – very good all-around player, quite comparable to Devon White and Amos Otis, amongst his Similar Batters. Also quite comparable, in that he has a snowball’s chance in h@!l of ever being selected to the HOF; between the three they got ONE HOF vote (Lemon, 1996).
Phil, I get what you’re saying about Chet Lemon. But isn’t it possible that a player who’s consistently good at most things, including CF defense, is as valuable as a player whose skills are more narrowly focused?
Some other points:
— Lemon’s low Run and RBI numbers have a lot to do with batting 5th or lower in almost 3/4 of his career PAs. He was a better offensive player than Amos Otis, but Otis hit 2nd thru 4th more than 70% of the time. Lemon was about the same offensive player as Carlos Beltran (OPS+ of 121 and 122, respectively), but Beltran has batted 2nd-4th 85% of the time. I’m not really sure why Lemon didn’t bat higher, except that when Detroit got him, they had a pretty well set top of the order, and he wasn’t a rock-the-boat guy, so he accepted hitting lower.
— Chet Lemon was sort of a shorter-career Lou Whitaker: Lots of good seasons, rarely a poor one, but no great years. Lemon played 11 full seasons as a CF, and in 9 of those he had at least 3.8 WAR; setting the threshold at 3.5 WAR, just 13 other CFs have 9 or more such years. But his best WAR was 6.2; those other 13 CFs all had at least 2 years at 6.5+ WAR.
— I have no illusion that Chet Lemon will ever get serious HOF consideration. But if he’d played CF for Ruth’s Yankees instead of Earle Combs, Lemon would be in.
Looking at the players from the 70s and 80s who meet John’s 54/27 criteria and aren’t in the Hall of Fame, it seems like the distinguishing characteristic is great defense. Here are the Rfields of those 11 players:
Bell – 174
Lemon – 93
Randolph – 114
Hernandez – 117
Whitaker – 77
Trammell – 77
Raines – (-7)
Smith – 78
Grich – 82
Bando – 36
Bonds – 48
So 8 of the 11 have an Rfield of 77+ and two others are above 36. Only Raines has a negative Rfield (and of course he contributed 100+ runs via his legs).
Kind of strange that right about the time defensive metrics improved, the voters decided to stop putting great defensive players in the HOF. Or maybe the voters were confused because these guys weren’t just defensive specialists, they could also hit. And oddly, the player who has the best chance of getting in (Raines) is the one with the worst Rfield.
Beautiful piece, John. The last chart is a masterpiece in encapsulating your points.
Your point about HOF selections not keeping up with expansion is undoubtedly true. But, since there were only a handful of 54/27 players who were overlooked before the 1960s (and many more who didn’t meet 54/17 and were chosen, some undeservingly), it could perhaps be said that the new, stricter, HOF standard is the better way to go. Deserving players who are overlooked always have a chance via the Veterans committee, but undeserving players who get in will always be in.
Question about your method: did you just look at calendar decades, or did you look at making the 27 WAR (or 30 WAR) standard in any 10 consecutive seasons? In other words, does the 1960s bar mean only only 1960-69, or any 10 year span from (for example) 1956-65 to 1965-74?
Thanks, Doug. To your question, I did use strictly ’00 to ’09 decades, not 10-year spans. My methods require an Excel worksheet for each period that is to be evaluated, so the latter method would have taken over 100 sheets — too bulky for this amateur.
P.S. “Deserving players who are overlooked always have a chance via the Veterans committee” — Yes, but I feel very pessimistic about the immediate prospects. I find it very disturbing that they named a committee for “The Expansion Era” and then defined its range as 1973-present. Maybe it’s just a meaningless name, but I worry that if you can’t get the first thing right, you’re unlikely to improve much on the next tasks.
And my concern only deepened when I learned of their finalists. No disrespect, but Steve Garvey and Dave Parker are the very sort of player who are already over-represented in the Hall.
Thus far the Historical Overview Committee that devises the Expansion Era ballot has taken their cue from BBWAA voting and put players who lasted the full 15 years on the BBWAA ballot on the Exp Era ballot. I can understand that in some ways but it is time for Dwight Evans, Keith Hernandez, Bobby Grich and others to have their second chance at Cooperstown
” it could perhaps be said that the new, stricter, HOF standard is the better way to go. ”
One problem with that is that you end up with ballots over-flowing with well qualified players and you end up with many of the same issues the original HOF voters had- an over-abundance of qualified players splitting the vote so no on gets in. There is no rational explanation for Bagwell or Piazza not getting in. And while the BBWAA isn’t as responsible for as many clunkers as the Veteran’s Committee was in the past they’ve certainly had enough.
From 1992 thru today the BBWAA have selected exactly 30 players- among them Rollie Fingers, Tony Perez, Kirby Puckett, Bruce Sutter & Jim Rice. Jack Morris stands poised to be elected and Lee Smith isn’t far off.
To me, if a player is as good as or better than the average Hall of Famer at his position then not electing them is a miscarriage of justice. And by my calculations there are probably something in the neighborhood of 20 players who’s careers were centered in the post-expansion (meaning 1961) era who meet that criteria and yet are either off the ballot entirely or stand next to no chance of ever getting elected by the BBWAA,
Well said, Hartvig. My point was just that weak selections of the past should be avoided in the future, if at all possible. But not (as you’ve said) at the expense of deserving players.
If we’re ever to get through the current backlog, some amendments to the voting process will have to be made. I would start with:
– amended rules whenever backlog exceeds some limit, based on eligibility criteria plus a certain WAR total (for pitchers and hitters)
– requiring voters to fill out a complete ballot in preferential order (but can be any eligible player, regardless of WAR total)
– adopting a points system, based on ballot placement
– players with the top 10 point totals are elected, or all players with a point total exceeding a qualifying level, whichever is less
Hartvig – you nailed it! Excellent comment, sadly I feel like the wheels will just continue to spin with the Hall of Fame selections leaving many of quite frustrated with the whole process – but – I will keep hope alive.
Great study and a fun read. Just one question – do you make any adjustments regarding the catchers position? Ted Simmons comes to mind.
Thank you
tunatuna — No, I didn’t make any adjustment for catchers. I had too many other balls in the air. 🙂
But you’ve raised a good point. Catchers tend to amass less WAR per year than other positions, so they are disadvantaged by the 54-WAR half of the “54/27” standard, and also in compiling 30-WAR decades. Only 6 retired catchers meet 54/27, whereas 15 shortstops and 14 second basemen do so.
BTW, Ted Simmons falls short on *both* sides of 54/27, as he totaled just over 50 WAR and averaged less than 21 WAR per 1,000 games. Which doesn’t mean he shouldn’t be in the HOF; just that he’s not a no-doubter.