
A companion to my earlier piece on AL teams, here is a rundown of unusual team accomplishments in the senior circuit. More after the jump.
NL West
The Dodgers won 35 of their first 60 games of the season, a nice .583 clip, but shifted into another gear for their next 60, going 51-9 (.850). Those 51 wins over that stretch are the most in any season since at least 1913 (I did a spot check of the 1906 Cubs; they went 46-12-2 for games 61-120, but were 37-2 for games 101-139). Two pitchers (Clayton Kershaw, Alex Wood) with 20 starts and 150 ERA+ ties the franchise record set in 1957 (Don Drysdale, Johnny Podres) and equaled in 2015 (Kershaw and Zack Greinke). Hands up if you guessed that Koufax and Drysdale did it at least once!
The D-Backs have almost wrapped up a wildcard berth on the strength of their starting pitching that has consumed almost two-thirds of their IP (66.0%), the fourth best result in the majors this season. The rotation includes five pitchers with 20 starts and 120 ERA+, and four with 140 ERA+; the latter mark is a live ball era first, and the former has also been achieved since 1920 only by the 1942 Tigers.
For the Rockies, it’s a tale of two halves of the season, going 44-26 over their first 70 games, but only 31-39 since. Colorado will shortly have two players (Nolan Arenado, Charlie Blackmon) with 80 extra-base hits, tied with 34 other teams (incl. three Rockies teams) for the most on one club. If both reach 90 XBH (a stretch but not inconceivable, as Arenado needs 12 more, and Blackmon 13), the Rockies would match the 1927 Yankees (you know who the players were) as the only teams with two such players. Blackmon needs one more double and one more triple to record the twelfth 30/15/30 season (2B/3B/HR), but only the second (after Jimmy Rollins in 2007) of the expansion era.
The Padres will record their 7th straight losing season, their longest streak of mediocrity since a 9-year run (1969-77) starting from the franchise’s inception. San Diego’s typically anemic offense is sporting four players with 350 PA and more strikeouts than hits, matching last season’s club, and marking the fifth straight year with at least three such players (the Astros with four seasons, and Nats with three, are the only other teams with more than two such seasons in the last five).
The power surge that has swept through the majors this season somehow missed San Francisco, as the Giants‘ current total of 112 HR is easily the lowest in the majors, 24 fewer than the next-to-last Pirates. But, that’s not really news, as the Giants are poised to record their fifth season of the last 10 with only one 15 home run man, something that had previously occurred in the expansion era only in the strike season of 1981, and in 1975 (when no Giant had 15 dingers).
NL Central
It took a while, but the Cubs are finally looking more like the team that scorched the NL last season en route to a world championship. Taking a 43-45 record into the A-S break, Chicago has rebounded with a 34-18 second half to move 5 games clear of the pack with three weeks left in the season. What has held the Cubs back this year and may ultimately prove their undoing is a reliance on older pitchers who, as is their wont, haven’t been able to match their performance of a year ago. Currently, Chicago has turned to pitchers aged 31 or older for 53.3% of the team’s innings, their highest level since World War II and far ahead of the 2016 level of 43.3% that itself is the sixth highest mark since 1946.
The surprising Brewers have hung tough all season but a 9-18 slide coming out of the A-S break may ultimately deny them the NL’s second wildcard berth, The Brewers have a decent shot at having three qualified batters (Eric Thames, Travis Shaw, Domingo Santana) aged 30 or younger with 120 OPS+ and 25 home runs, a trio seen in Milwaukee only three times previously, most recently in their division-winning 2011 season. On the mound are three under-30 pitchers (Jimmy Nelson, Chase Anderson, Zach Davies) with 20 starts and (currently) 115 ERA+, the most in franchise history. Things are looking up for the Brew Crew!
The Cardinals are keeping pace with the Brewers thanks to a 20-12 run since Aug 5. Eight Redbirds should reach 20 doubles, with an outside shot at tying the franchise record of 9 players if Aledmys Diaz gets a call-up (he needs four more). If Jedd Gyorko can get over a hamstring strain, seven of the eight have a decent shot at also reaching 200 total bases; that would tie the long-standing franchise record established in 1930 and not equaled since 1953.
The Pirates should finish the season with all of their games started by pitchers in their age 30 season or younger. It would be the 11th such season for the franchise since 1901, seven of them between 1995 and 2011. Like those seven seasons, this one will likely be a losing campaign; Pittsburgh’s only winning seasons with a starting corps all aged 30 and under came in 1971 and 1972.
Cincinnati has a shot at having a franchise record-tying 5 players with 25 home runs and 100 OPS+, with Eugenio Suarez and Scooter Gennett both needing just one more blast, and Adam Duvall (103 OPS+) and Scott Schebler (105) needing to stay above the century level. The last time the Reds had five such mashers was not in the Big Red Machine days but, rather, as the Redlegs in Frank Robinson‘s 1956 rookie season.
NL East
It’s been almost three months since the Nats last lost three games in a row. That’s what happens when three of your rotation men (Gio Gonzalez, Max Scherzer, Stephen Strasburg) are sporting a 150 ERA+. Those three qualified seasons almost match the franchise total of four for all seasons before this one. Three such pitchers who, like the Washington trio, are also posting a .700 W-L% has happened only once before, on the 1906 Cubs with Mordecai Brown, Jack Pfiester and Ed Reulbach.
Miami‘s massively talented outfield all stayed healthy this season and will all crest 4.0 WAR, just the eighth outfield to do so with all aged 27 or younger. (Quiz: which outfield did this twice?) The ageless Ichiro Suzuki has reinvented himself, at age 43, as an elite pinch-hitter, batting .289 in that role with 26 pinch-hits. Ichiro’s next PH appearance will set a new major league record for the most in one season; he needs three more pinch-hits to break John Vander Wal‘s 1995 major league record of 28 in one season.
Just two years removed from their pennant-winning season, the Met front office reached the conclusion that the window of opportunity for the present group had closed. After blowing up the team mid-season, it will be a very different club that takes the field next year. Met watchers, though, have seen this movie before; one year removed from a pennant, the 1987 club used 7 different pitchers for 12 or more starts, a total not equaled until this season with 7 pitchers having already made 13 starts.
The Braves have been better this season but their methods continue to baffle this observer. For the second year in a row, Atlanta will give 45% of its PAs to players aged 31 or older. The Braves have done this before, in 2002-03, 1999-2000, 1969-70 and 1948-50, but all but two of those teams were winners, and six of the nine made the post-season. Losing with older players just doesn’t make any sense; much better to get the same result but develop your younger talent at the same time.
For a team taking a different approach from the Braves, look no further than Philadelphia. The results haven’t been pretty this season, but only one Phillie regular is older than 27. Five of those 27-and-under players will reach 25 doubles this season, one less than the franchise record set by the 2001 club. Oddubel Herrera should post 40 doubles, a level not reached by a Phillie outfielder aged 25 or younger since Del Ennis in 1948.
I’ll try to make sense of the Braves method:
C – Flowers/Suzuki. Both have hit well, and having veterans at Catcher makes sense if there’s not a G Sanchez ready to go.
2B – Brandon Phillips. They got him for next-to-nothing, and once Ozzie Albies was ready B-Phil was jettisoned.
3B – Adonis Garcia. Has had only 167 PA, as they’ve been figuring out what they have with Camargo, Peterson, and Ruiz.
LF – Matt Kemp. They got him in a bad-contract trade for Hector Olivera.
RF – Nick Markakis. He is an average and dependable player.
Ronald Acuna should push Kemp out of the picture next year.
Thanks Voomo. I guess if you don’t think your youngsters are ready, then you stick with what you have. But, if that was my view, my bias would be towards giving those youngsters the chance prove me wrong.
I can see keeping Markakis as a character guy (though he would be far more valuable to a contending team), and Flowers as a veteran catcher. But, why even trade for Kemp? Even if another team is paying for him, he’s only helping (a little bit) with his bat, and costing you a lot (according to dWAR) with his glove.
I should also note that the Braves would not have met the 45% threshold this year without the 1.4% of batting batting PAs contributed by R.A. Dickey and Bartolo Colon.
I mostly agree with you on Kemp. Perhaps the logic was, we can pay for this guy who we’ve determined is worthless, or roughly the same amount of money for this greatly flawed player whose might hit like it is 2011 again.
They were on the hook for (looks like) 32 million for Olivera. And they’re hemmorhaging about 50 mil for Kemp.
But they unloaded about 10 million worth of Jim Johnson and Bronson Arroyo when they got Olivera
(but they gave up Alex Wood).
Yeesh. It’s a big drawn-out mess.
In retropsect, they probably would have beeb better off releasing Olivera and absorbing his salary. But hindsight is 20-20 and I’m sure they were gambling on a Kemp bounceback.
As for Doug’s other point, the problem with letting the youngsters play is that you start their FA clock before you may want it to start. And if it turns out that they’re not ready (but will be later on), then you’ll lose them sooner than you had to.
Max Scherzer is currently 6th all-time in lowest H/9 for a season.
5.2606 … Nolan Ryan
5.2955 … Luis Tiant
5.3064 … Nolan Ryan (age 44)
5.3088 … Pedro Martinez (greatest season ever?)
5.3257 … Ed Reulbach (almost identical IP and H to Pedro)
5.5514 … Max Scherzer (current)
5.5682 … Dutch Leonard (0.96 ERA, age 22)
5.6522 … Carl Lundgren
5.7065 … Sid Fernandez (age 22!) (4th best career mark, behind Ryan, Kershaw, and Koufax)
5.7398 … Tommy Byrne (125 hits, 179 walks !)
_________________________
Seasons with Walks more than 1.4* Hits
(sorted by IP):
196 .. Byrne
109 .. Mitch Williams
74 … Carlos Marmol
67 … Mark Clear
65 … Jeff Nelson
63 … Mike Naymick
53 … Dellin Betances (current)
50 … Aroldis Chapman
49 … Ryne Duren
42 … Jose Leclerc (current)
Meanwhile Corey Kluber is leading the AL in Hits/9 and W/9. No AL pitcher has led in both categories since Walter Johnson in 1913. Other AL pitchers to pull off the feat include Adie Joss (1908) and Cy Young (1901). In the NL, it’s been done by Juan Marichal (1966), Ray Prim (1945), Carl Hubbell (1934), and Christy Mathewson (1909). Hmmm…which one does NOT belong with the others???
Prim logged only 165.1 IP that season, but that was almost half of his career workload. Pitched almost 3000 minor league innings.
Prim was 38 that season and is the oldest of the pitchers to accomplish this double. He pitched for the Cubs in the ’45 WS and remains the oldest NL pitcher to start game 4 of the WS.
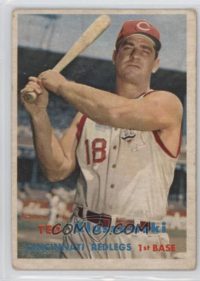
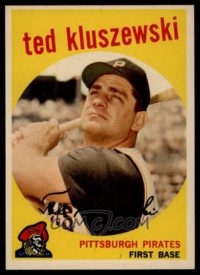
The 1956 Redlegs—I remember that team well from when I was a kid, and it wasn’t Frank Robinson’s team then, Doug, but big Ted Klu’s. They came out of nowhere after 11 consecutive losing seasons to go down to the wire with the Dodgers and Braves in a three team race. Ed Bailey and Smokey Burgess combined for 40 HRs out of the catcher’s position, and George Crowe put up 10 subbing at first for Big Ted. This was the year Kluszewski started having the back problems that sank his career, and although his 35 dingers failed to match the 40 or more he’d bang the previous 3 years, it wasn’t a bad total for 130 starts. He led the team in RBIs despite the games missed. The team total of 221 HRs, by the way, matched that of the 1947 Giants as the then Major League record, and although I haven’t time to check this out, I’ think the figure of 221 remained the NL record into the 1990s.
A team of contrasts: glovemen Johnny Temple and Roy McMillan at 2nd and short had 5 HRs between them, while the outfield of Robinson (38) Gus Bell (29) and Wally Post (36) belted 103.
Good recollection, nsb. With his uniform sleeves cut off so his enormous biceps could show, Kluszewski looked like a different species. It was hard to imagine he could have an injury. Where I live now, he’s remembered as a football star.
Like this.
With today’s loss, the Dodgers now have a 10+ game win streak and a 10+ game losing streak within the same season.
Has any other team pulled that off?
I was just logging on to ask that question, David, although I was going to add the wrinkle of multiple 10 game winning streaks.
1953 Yankees came close. 18 game winning streak, 9 game losing streak.
Still more than two weeks left in the season and LA already has the second most losses after game 125 among the 18 teams since 1913 with 85 wins over their first 125 games. With 7 more losses this season, the Dodgers will have most losses after game 125 of the 75 teams with 80 wins over their first 125 games.
Dodgers are the first team since at least 1913 with a season including multiple 10+ game winning streaks plus a 10+ game losing streak. Here are all the teams with double-digit winning and losing streaks in same season.
Indians – 1931, 1979, 2008
Senators/Twins – 1921, 1927, 1985
Orioles – 1987, 1999
Cubs – 1944, 1970
Reds – 1957, 1998
Dodgers – 1943, 2017
Braves – 1982
White Sox – 1976
Athletics – 1959
Giants – 1951
Mets – 1991
Phillies – 1955
Pirates – 1932
Rays – 2004
Thanks for resolving this, Doug.
Thanks for referencing my earlier note on Charlie Blackmon, Doug. He now has 31 doubles, 34 home runs, and is still stuck on 14 triples.
Only 8 players have had a 35-15-35 season, and no one since Stan Musial in 1948 has managed the feat. Just two collected more than Blackmon’s current total of 13 stolen bases: Babe Ruth (17) and Chuck Klein (20).
Gehrg in 1927: 52-18-47.
Wow!
David, Ruth edges him out by two (119 to 117) with 44-16-59 in 1921, the most ever.
Klein had 100+ extra-base hits twice in his career: 1930 (107) and 1932 (103). There have been a mere 15 player-seasons that reached the century mark in XBH, and only two other players reached the plateau twice: Lou Gehrig (1927 and 1930), and another underrated hitter, Todd Helton, who did it back-to-back in 2000-01.
Off on a tangent—well, not even a tangent. B-R’s list of recently deceased players has highlighted the name of Tom Wright. Who? Spent nine years in part or whole with four AL teams as a pinch hitter-outfield sub, 1948-1956. Missed three years, ages 19-21, due to WWII, but when he got back, wow: .380 BA in class C 1946, .325 in AA 1947, .307 in AAA 1948, a league leading .368 in AAA 1949 with an OPS of .988 playing beside Piersall who managed .271/.674. Wright went up to the bigs to stay in 1950 at age 26, while Piersall languished and then declined, dropping to AA for the 1951 season, before his rise to the BoSox. Wright, I suspect, wasn’t very good in the field, and without much power his batting prowess was limited. Still, he deserves a comment, I think.
Wright’s .318 BA in 1950 is highest by a Red Sox rookie in season with 30+ PH appearances, and T-19th among such rookies for all teams since 1901. The Reds and Pirates seem to have specialized in such rookie seasons, with 7 of the 18 spots ahead of Wright (only the Tigers have more than one of the other 11 spots).
Wright’s other big problem, given his limited power, was his strikeouts, with a career mark above 16% of PAs, one of only 28 players with SLG under .400 and SO above 15% of PAs, among non-pitchers with 500 PA careers from 1920 to 1960. None of those players had a 3000 PA career.
Thanks for sharing NSB! I always enjoy reading about these obscure players.
He actually has a SABR bio and want jumped out at me is that the Red Sox originally tried to assign him to a team in Canton, OH which just happens to be my hometown. But Wright didn’t want to go that far from home so they sent him to Florence, SC instead.
http://sabr.org/bioproj/person/567542f2
May I take a crack at the quiz question? I think I stumbled into it…
Oakland A’s, 1980 and 1981:
Rickey Henderson, (ages 21, 22): 8.8, 6.6
Dwayne Murphy (25, 26): 6.9, 4.4
Tony Armas (26, 27): 5.9, 4.2
Thanks for letting me play, longtime reader of the site (since way before the switch to HHS, even), keep up the great work!
You’ve got it Mark.
Thanks for being a loyal reader.
Thanks Doug! I hope this doesn’t clutter the post (or your time!) too much more, but as good a place as any, since it’s also quiz-related…
Have certain quiz posts been broken out of the main RSS feed? I noticed when in the middle of the Don Baylor “regular” post it referenced back to a quiz involving Baylor that I hadn’t seen, and sure enough, there’s also that whole “PLAYER STATS QUIZ” menu up there now, with others I’d been missing in recent weeks/months (this all comes from a place of just not wanting to miss a single piece of content from you all! Plus, your quizzes in particular are always extra cool. 🙂 ).
Thanks again for allowing me to play here (literally and figuratively) — the virtual (and self-bequeathed) gold star from my correct quiz answer will be the highlight of this Pirates fan’s September…
Glad you like the quizzes, mark. I started posting them on the alternate page, as they tended to have more limited appeal than the regular articles on the main page.
Here’s a fabulous Metropolitans stat:
It is possible that Jose Reyes will be the Metsies only qualifying hitter.
Asdrubal Cabrera will get there barring injury in the next 72 hours, but jeepers what a nightmare of a season.
DeGrom will being their only qualifying pitcher, and nobody else is even close.
Them Metsies is amazin, that’s for sure. How about this: there’s a good likelihood that Rhys Hoskins, who came up on August 10, will wind up the season leading Phillie position players in WAR. He had a lousy game today, but when it started he was only 0.1 off the pace of the two leaders: Herrera and Hernandez (who also had pretty bad games today).
Ichiro since July 5th, 96 PA’s…
.341 BA
.432 OBP
.427 SLG
Remarkable; talk of his demise was greatly exaggerated.
Ichiro does not have enough plate appearances (205) for a qualified age-43 season (310), according to Baseball Reference. If he did, his batting average would be one point below Pete Rose for 10th all time, and amazingly, his slugging percentage (.344) would rank ninth.
Ichiro is now the first player with 100+ PH appearances in a season, but is still looking for those two more pinch-hits (he is hitless in his last 8 PH PA’s) to tie John Vander Wal’s season record.
In total, Ichiro has played 130 games this season to become the first player to do so each season aged 40-43, and joining Pete Rose as the only players to play 75% of their team games in each of those seasons (Pete’s 121 games played in 1984 is fractionally below 75% of 162, but above 75% of 160; I’ve used the latter test since the Reds had played two more games than the Expos when Rose was traded back to Cincy in mid-season).
Don’t know where to post this so I’ll do it here. On Twitter, Highheatstats posted a request concerning the highest 7 year peak period of WAR. I did an analysis using fWAR and the results are posted below showing all 7 year periods of at least 62.0 fWAR. The Year Ending column is the final year of the 7 year period.
Year
WAR Ending ….. Player
76.8 ….. 1926 ….. Babe Ruth
76.5 ….. 1927 ….. Babe Ruth
75.8 ….. 1924 ….. Babe Ruth
74.5 ….. 1929 ….. Babe Ruth
74.2 ….. 1925 ….. Babe Ruth
73.3 ….. 1932 ….. Babe Ruth
73.2 ….. 1928 ….. Babe Ruth
70.0 ….. 1930 ….. Babe Ruth
70.0 ….. 1949 ….. Ted Williams
68.5 ….. 1909 ….. Honus Wagner
68.3 ….. 1925 ….. Rogers Hornsby
68.2 ….. 1931 ….. Babe Ruth
68.0 ….. 1933 ….. Babe Ruth
67.6 ….. 1950 ….. Ted Williams
67.2 ….. 1927 ….. Rogers Hornsby
67.2 ….. 1948 ….. Ted Williams
66.7 ….. 2004 ….. Barry Bonds
66.6 ….. 1966 ….. Willie Mays
66.6 ….. 1926 ….. Rogers Hornsby
66.3 ….. 1908 ….. Honus Wagner
66.3 ….. 1910 ….. Honus Wagner
65.5 ….. 1929 ….. Rogers Hornsby
65.5 ….. 1965 ….. Willie Mays
65.3 ….. 1961 ….. Mickey Mantle
65.0 ….. 1928 ….. Rogers Hornsby
64.8 ….. 1923 ….. Babe Ruth
64.5 ….. 1964 ….. Willie Mays
64.3 ….. 1911 ….. Honus Wagner
63.7 ….. 2003 ….. Barry Bonds
63.7 ….. 1951 ….. Ted Williams
63.6 ….. 1933 ….. Lou Gehrig
63.4 ….. 1932 ….. Lou Gehrig
63.2 ….. 1936 ….. Lou Gehrig
62.7 ….. 2002 ….. Barry Bonds
62.6 ….. 1924 ….. Rogers Hornsby
62.5 ….. 1915 ….. Ty Cobb
62.4 ….. 1967 ….. Willie Mays
62.4 ….. 1963 ….. Willie Mays
62.1 ….. 1937 ….. Lou Gehrig
62.0 ….. 1907 ….. Honus Wagner
62.0 ….. 1912 ….. Honus Wagner
There are a total of 9 players on the list. From 2012-2017 Mike Trout has an fWAR of 53.2. Assuming he finishes the season with 53.5 fWAR he would need 8.5 fWAR in 2018 to join that list.
The word “Year” should appear above the word “Ending”.
Richard, did you exclude pitchers for a reason? At least Cy Young, Walter Johnson, and several 19th century pitchers would make the list.
I should have mentioned that I did it for position players only. I will do pitchers.
I made the search for pitchers but the results were a bit strange. I extract my database from Fangraphs and I make a quick spotcheck with BR for some of the players. I saw that Fangraph produces significantly lower values of WAR for pitchers (Johnson, Mathewson, Grove, etc.) in the early part of the 20th century providing results that I do not confidence in. Accordingly I have decided to not publish the results.
My own spotcheck on B-R, filing through the leaderboard for pitching WAR only, yielded only Cy and Walter, Kid Nichols, John Clarkson, and Pud Galvin. Pete Alexander was very close, and when I add in his B-R batting/fielding WAR he gets to 61.9 for his initial seven years.
Here are Walter Johnson’s WAR values for 1910 to 1919, BR value first, then Fangraphs.
11.2/9.6
8.5/5.9
13.5/9.3
14.6/8.5
11.9/7.8
11.2/8.2
9.7/8.8
6.8/6.7
10.2/6.5
10.5/6.8
One year the two (BR and FG) are really close, and another within one WAR. But, the rest – those are big differences!
Late in life, Confucius said, “Give me a few more years to learn, fifty or so, and I could avoid big mistakes.” At roughly the same age, my feeling is that with a few more years of study, fifty or so, I could understand bWAR and fWAR. But since those extra years aren’t currently on offer, I’m just going to offer up some big mistakes.
It seems to me that one reasonable aim of any WAR system should be to develop a metric that will place pitcher and hitter WAR in a universe where the two types of players can be measured on a single scale. Clearly, bWAR seems to accomplish that and fWAR does not. For this reason, when fWAR is the chosen metric, any question asking for the best WAR totals in some category will effectively exclude pitchers. In this case, although Richard has shown that nine players have reached 62 WAR over seven years, none of the pitchers I mentioned gets particularly close. For me, that significantly reduces the interest of WAR.
More fundamentally, on doing ten minutes of exhaustive research, it appears to me that the root cause of the divergence of the two WAR systems for pitchers is that bWAR starts from runs allowed, while fWAR starts from FIP. Now, I think FIP is an interesting stat, but I do not think it is really legitimate to judge a pitcher’s total contribution on a basis that excludes singles, doubles, triples, ground outs and fly outs. Games generally include a few of those events, and pitchers have something to do with them.
Look at Walter Johnson in 1913. For the stats that mattered most when I was the height of the bubble-gum card counter, Walter was 36-7 (.837) with an ERA of 1.14 over 346 IP (just to clarify, that ERA is 1.14). Fangraphs says, “Nice year, Walter: your WAR is 8.5, which makes you a strong MVP candidate for 1913.” (What??) B-R says, “Bow! Bow! Bow to The Big Train, the 20th century single-season WAR leader, with a 14.3 WAR for pitching alone (not to mention 16.0 overall)!”
The reason for the difference is that while Walter allowed just 56 runs in his 346 IP, for a total run average of 1.46 — a great start for bWAR, since the league ERA was 2.93, more than twice Walter’s total run average (these figures are almost identical to Gibson’s in the 1968 NL) — he also led the league in a key negative stat that accounts for his FIP standing at 1.90 (vs. league average 3.00). It seems Walter allowed so many HRs that he alone counts for 1.5% of the league total. In 2017, prorating HRs for the equivalent of an eight-team league, this means that Walter allowed almost 100 HRs — naturally that’s going to sour his FIP, despite his striking out 243 and walking only 38. When Walter pitched, balls flew out of the park by the flock!
Except that in 1913, the league hit only 159 HRs, and Walter’s league leading figure was exactly 9 — and in 1913, a good percentage of those HRs would have been of the inside-the-park variety, which means they were not truly Fielding-Independent. (Walter pitched in the pastures of the then-new Griffith Stadium, which was 407′ down the left field line – 6 of the 9 HRs Walter allowed were in Griffith Stadium.)
Walter’s W-L record must be seen in context, of course: he did, after all, play for a contending team that year, and the Senators finished in second place. That team, however, had an OPS+ of 86, and its WIP (Walter Independent Performance) was 54-57 — not quite the power outfit that their actual 90-64 record suggests.
If we use bWAR, Walter’s 1910-16 seven-year run yielded 80.5 pitching WAR (excluding an additional 6.2 WAR as a position player), exceeding Ruth’s bWAR high of 71.4 for 1918-24 (excluding 3.3 pitching bWAR). Perhaps that goes too far in the other direction (though the key difference is really simply that Ruth has no seven-year run without an off year), but I think the comparability of Johnson and Ruth as dominant pitchers and hitters is better captured by bWAR than by fWAR.
On Closing Sunday, Padres pitcher Luis Perdomo hit his fourth triple of the season. Four interesting things about this:
1) All other major-league pitchers combined to hit three triples in 2017.
2) Perdomo is the first major-league pitcher since Robin Roberts, 1955, to hit four triples in a season.
3) Perdomo ties Dixie Howell (1957 White Sox) and Rick Wrona (1994 Brewers) for the most hits in a season, five, that were all for extra bases.
4) Perdomo, 2017, is the first player with four or more triples whose triples account for as many as half of his total base hits,
The 2017 Padres also are the first team with an actual W-L percentage more than 70 percentage points greater than its Pythagorean W-L percentage to finish with an actual W-L percentage below .500. (Actual record 71-91, .438; Pythagorean record 59-103, .366.) The 2017 Padres’ 72-percentage-point discrepancy is the ninth highest since 1901.