
One of the lesser known and seldom discussed offensive metrics is RE24, a measure for batters (or pitchers) of how much better or worse they were in improving their team’s run expectancy in their plate appearances. Last year’s league leading batters were Mike Trout and Anthony Rendon, and most often (but not always) the RE24 leaders are the same leading players as evaluated by other metrics. But, what RE24 provides that other metrics don’t is that each player is evaluated on how well he did in his own individual context. More after the jump.
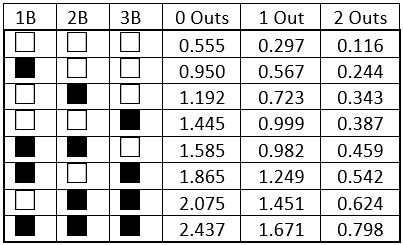
Let’s start with the name. RE refers to run expectancy and 24 denotes the 24 possible base-out scenarios attending each PA (that is, the 8 possible configurations for empty or occupied bases times the 3 possible number of outs). For this metric, run expectancy means the expected future runs in an inning starting from any of these 24 base-out states, assuming average batters and pitchers. Of course, expected runs depends on the run scoring environment in a particular season, so specific “coefficients” are determined to calculate RE24 for each season. As an example, here are those coefficients for a season averaging 5 runs per team game.
RE24 could also be normalized (quite easily) for ballpark but, alas, this normalization has not been performed for the versions in Baseball-Reference and FanGraphs. Note that RE24 does not distinguish between innings or game situation, a characteristic that can perhaps be viewed as a weakness. Thus, with no outs and the bases empty, the same future runs in an inning are expected starting the 1st inning, after four runs have scored in an inning, in the 7th inning of a tie game, or in the 9th inning when trailing by eight.
So, how actually is RE24 calculated? It’s really pretty simple, being:
- (RE after PA) minus (RE before PA) plus Runs Scoring
Using our table above, a bases loaded home run with two outs would yield:
- 0.116 RE (after PA) – 0.798 RE (before PA) + 4 Runs Scoring = 3.318 RE24
Similarly, striking out in the same situation would result in:
- 0 RE (after PA) – 0.798 RE (before PA) + 0 Runs Scoring = -0.798 RE24
In the 5 run per game environment illustrated above, consuming an out to move up a baserunner does not yield positive RE24 unless you also drive in a run. Similarly, of the 8 possible base/out situations in which a sacrifice fly is possible, in only one (one out, one runner on base) will a sac fly yield positive RE24 (a measly 0.117).
So, while the expected future runs in an inning are interesting, numerically the part of the equation carrying the freight is actual runs scoring. You can achieve positive fractional RE24 by moving baserunners up (without making an out), but if you want to “cash in” with a big RE24 number, you need to drive the runs in.
A few other notes:
- a solo home runs always yields exactly 1 RE24, regardless of the run scoring environment or the number of outs, as one run scores and the base/out state remains unchanged.
- Runs Scoring means runs scoring as a result of the batter’s actions. Additional runs scoring due to errors are not included.
- After RE refers to base/out state resulting from the batter’s actions. Runners taking extra bases because of fielding plays (or getting caught trying to do so) do not factor into the After base/out state.
- Before RE refers to the base/out state before the final pitch of a plate appearance, which may be different from the base/out at the beginning of the PA
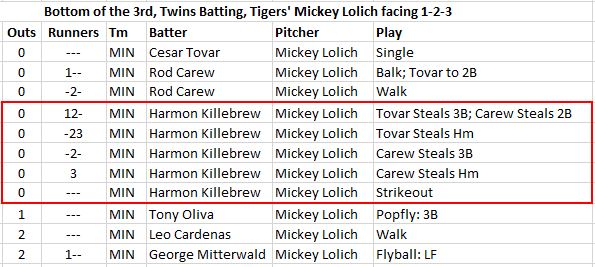
- As an aside, possibly the biggest change in RE during a PA occurred during Harmon Killebrew‘s 3rd inning PA facing Mickey Lolich and the Tigers on May 18, 1969. Killer came to the plate with runners on first and second, but ended up striking out with the bases empty, after both runners scored on the strength of 5 combined stolen bases.
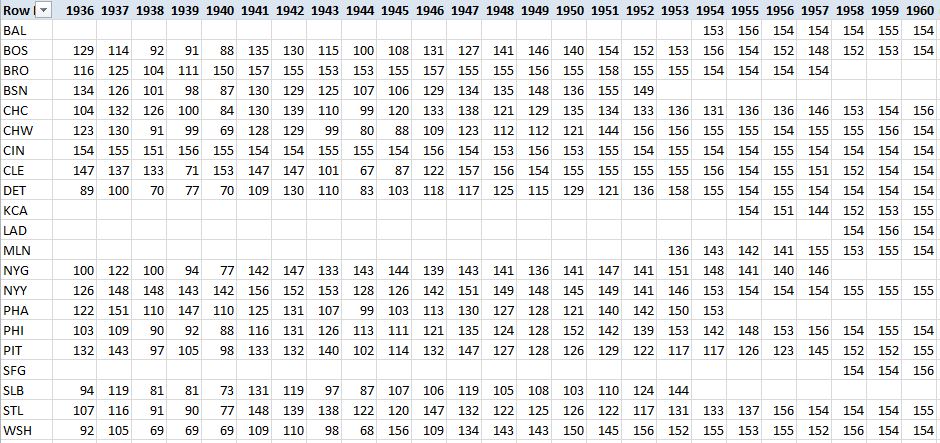
It will be immediately apparent that calculating RE24 requires accurate game logs which, at present, are 100% complete only since 1973. However, these are virtually 100% complete for the expansion era and ~80%+ complete back to the mid-1930s. So, most of the statistics I’ll be presenting are for the periods since 1961, or since 1936, to completely capture the careers of some of the all-time greats of the post-Ruthian era. Pre-expansion players, of course, will have asterisks next to their totals on account of missing data. Unlike most counting metrics for which data are missing, the true RE24 numbers may be higher or lower, depending on which game data are missing. For those who may be interested, these are the numbers of games for which game log data are available for each team for the 1936 to 1960 period.
Let’s start with the season RE24 leaders. For the 84 seasons since 1936, these are the only players to lead their league in RE24 in multiple seasons.
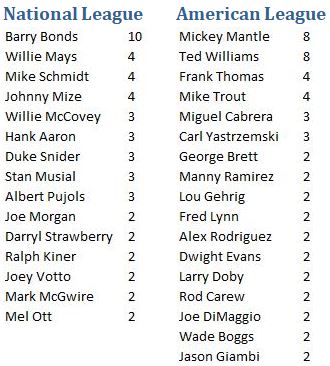
So, the names you’d expect to see, for the most part. In addition to the above, Frank Robinson (1962, 1966) and Dick Allen (1966, 1972) enjoy the distinction of leading both leagues in RE24. The full list of RE24 season leaders is here.
These are the top RE24 individual seasons, since 1936.
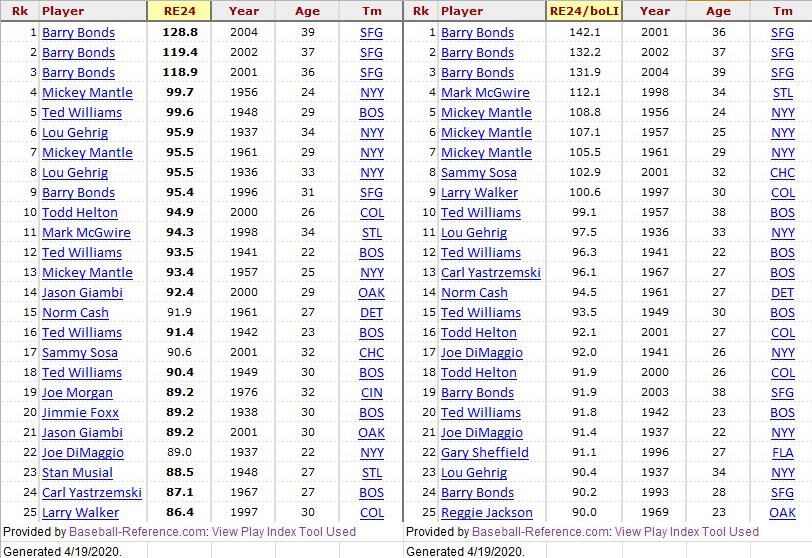
So, two metrics here, one is RE24, the second is RE24/boLI, which is RE24 divided by base/out leverage index. The latter figure is essentially a normalized version of RE24, recognizing that some players will have more or less “opportunity” depending on the base/out state during their plate appearances. Thus, Mark McGwire‘s 70 HR season in 1998 ranks only 11th in RE24 but 4th in RE24/boLI, indicating that McGwire had less opportunity (than some others did in their leading seasons) to do damage in base/out situations with large future run expectancies (for the record, McGwire had RISP in only 26.5% of his PA in 1998, compared to an MLB average that year of 28.7% for 3rd place hitters).
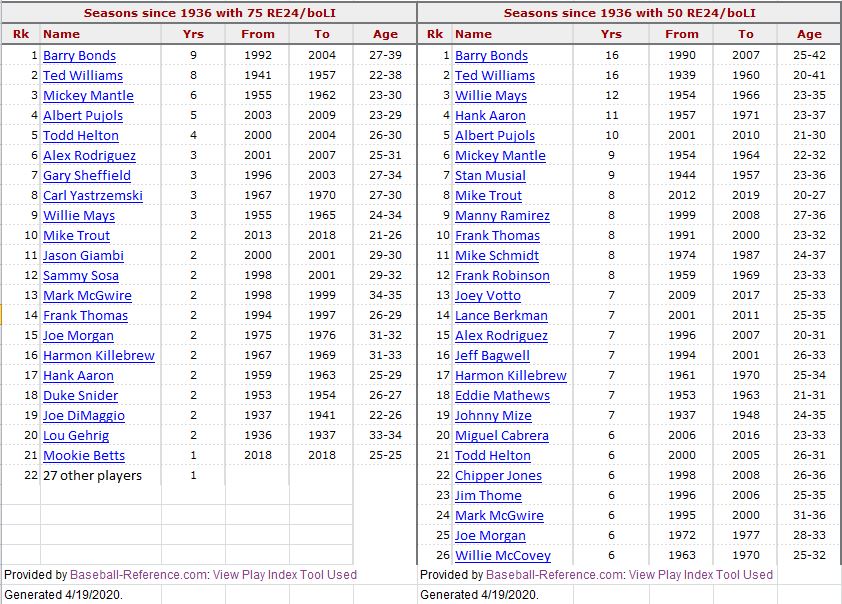
While the best RE24 seasons can reach triple digits, a 50 RE24 season is still a great year, one which only the best players will achieve consistently. Here are players having he most seasons with 75 and 50 normalized RE 24.
So far, I’ve been talking about great RE24 seasons, but what about great RE24 games. Since we’re talking about individual games, I can look at whatever game log data are available all the way back to 1908. Here are all the games with 7.5 RE24 or more:
| Rk | Player | Date | Tm | Opp | Rslt | PA | AB | R | H | HR | RBI | BB | WPA | RE24 | aLI | BOP |
|---|---|---|---|---|---|---|---|---|---|---|---|---|---|---|---|---|
| 1 | Mark Whiten | 1993-09-07 (2) | STL | CIN | W 15-2 | 5 | 5 | 4 | 4 | 4 | 12 | 0 | 0.347 | 9.506 | .868 | 6 |
| 2 | Anthony Rendon | 2017-04-30 | WSN | NYM | W 23-5 | 6 | 6 | 5 | 6 | 3 | 10 | 0 | 0.402 | 9.345 | .590 | 6 |
| 3 | Phil Weintraub | 1944-04-30 (1) | NYG | BRO | W 26-8 | 7 | 5 | 5 | 4 | 1 | 11 | 2 | 0.298 | 9.267 | .677 | 5 |
| 4 | Norm Zauchin | 1955-05-27 | BOS | WSH | W 16-0 | 5 | 5 | 4 | 4 | 3 | 10 | 0 | 0.225 | 9.085 | .302 | 5 |
| 5 | Alex Rodriguez | 2005-04-26 | NYY | LAA | W 12-4 | 5 | 5 | 3 | 4 | 3 | 10 | 0 | 0.490 | 8.614 | .660 | 5 |
| 6 | Fred Lynn | 1975-06-18 | BOS | DET | W 15-1 | 6 | 6 | 4 | 5 | 3 | 10 | 0 | 0.293 | 8.480 | .385 | 4 |
| 7 | Scooter Gennett | 2017-06-06 | CIN | STL | W 13-1 | 5 | 5 | 4 | 5 | 4 | 10 | 0 | 0.278 | 8.286 | .764 | 5 |
| 8 | Jim Bottomley | 1924-09-16 | STL | BRO | W 17-3 | 6 | 6 | 3 | 6 | 2 | 12 | 0 | 0.244 | 8.274 | .640 | 4 |
| 9 | Mark Reynolds | 2018-07-07 | WSN | MIA | W 18-4 | 5 | 5 | 3 | 5 | 2 | 10 | 0 | 0.371 | 8.109 | .786 | 5 |
| 10 | Tony Lazzeri | 1936-05-24 | NYY | PHA | W 25-2 | 6 | 5 | 4 | 4 | 3 | 11 | 1 | 0.219 | 8.092 | .572 | 8 |
| 11 | Walker Cooper | 1949-07-06 | CIN | CHC | W 23-4 | 7 | 7 | 5 | 6 | 3 | 10 | 0 | 0.192 | 7.991 | .344 | 4 |
| 12 | Orlando Cepeda | 1961-07-04 (1) | SFG | CHC | W 19-3 | 5 | 5 | 2 | 5 | 1 | 8 | 0 | 0.276 | 7.910 | .624 | 5 |
| 13 | Reggie Jackson | 1969-06-14 | OAK | BOS | W 21-7 | 7 | 6 | 2 | 5 | 2 | 10 | 1 | 0.248 | 7.841 | .413 | 3 |
| 14 | Edwin Encarnacion | 2015-08-29 | TOR | DET | W 15-1 | 5 | 5 | 4 | 3 | 3 | 9 | 0 | 0.250 | 7.813 | .514 | 4 |
| 15 | Gus Bell | 1955-09-21 | CIN | MLN | W 14-5 | 5 | 4 | 2 | 4 | 1 | 8 | 1 | 0.263 | 7.777 | .655 | 5 |
| 16 | George Mitterwald | 1974-04-17 | CHC | PIT | W 18-9 | 5 | 4 | 3 | 4 | 3 | 8 | 1 | 0.388 | 7.604 | .698 | 7 |
| 17 | Lou Gehrig | 1934-05-10 | NYY | CHW | W 13-3 | 4 | 4 | 4 | 4 | 2 | 7 | 0 | 0.157 | 7.576 | .488 | 4 |
| 18 | Jimmie Foxx | 1933-04-24 | PHA | BOS | W 16-10 | 6 | 5 | 3 | 5 | 1 | 7 | 1 | 0.576 | 7.567 | 1.050 | 4 |
| 19 | Roy Smalley | 1982-09-05 | NYY | KCR | W 18-7 | 5 | 4 | 3 | 2 | 2 | 6 | 1 | 0.347 | 7.509 | .834 | 7 |
| 20 | Josh Hamilton | 2012-05-08 | TEX | BAL | W 10-3 | 5 | 5 | 4 | 5 | 4 | 8 | 0 | 0.372 | 7.506 | .446 | 3 |
I would draw your attention to the game result column for these contests, nearly all of which were blowouts. Obviously, the winning team was having its way with its opponent’s pitchers who, on that day, were likely performing well below league average level. For the best RE24 performance in more meaningful games (with a 1.5 aLI), it’s these contests, all with 6 RE24 or more.
| Rk | Player | Date | Tm | Opp | Rslt | PA | AB | R | H | HR | RBI | BB | WPA | RE24 | aLI | BOP |
|---|---|---|---|---|---|---|---|---|---|---|---|---|---|---|---|---|
| 1 | Didi Gregorius | 2019-07-23 | NYY | MIN | W 14-12 | 6 | 5 | 2 | 5 | 1 | 7 | 1 | 0.845 | 7.457 | 1.817 | 5 |
| 2 | High Pockets Kelly | 1924-06-14 | NYG | CIN | W 8-6 | 5 | 4 | 3 | 4 | 3 | 8 | 1 | 1.117 | 7.377 | 2.302 | 4 |
| 3 | Lou Gehrig | 1930-07-31 | NYY | BOS | W 14-13 | 5 | 3 | 3 | 3 | 1 | 8 | 1 | 0.656 | 7.316 | 2.052 | 4 |
| 4 | Jimmie Foxx | 1932-07-10 | PHA | CLE | W 18-17 | 10 | 9 | 4 | 6 | 3 | 8 | 1 | 1.307 | 7.227 | 2.212 | 5 |
| 5 | Mo Vaughn | 1999-06-24 | ANA | SEA | W 12-7 | 6 | 6 | 2 | 5 | 2 | 6 | 0 | 0.698 | 6.998 | 1.585 | 3 |
| 6 | Ted Williams | 1946-07-14 (1) | BOS | CLE | W 11-10 | 5 | 5 | 4 | 4 | 3 | 8 | 0 | 1.072 | 6.916 | 1.838 | 4 |
| 7 | Mike Greenwell | 1996-09-02 | BOS | SEA | W 9-8 | 5 | 5 | 2 | 4 | 2 | 9 | 0 | 1.054 | 6.678 | 2.422 | 8 |
| 8 | Harmon Killebrew | 1969-09-07 | MIN | OAK | W 16-4 | 3 | 2 | 2 | 2 | 2 | 7 | 1 | 0.513 | 6.604 | 1.693 | 4 |
| 9 | Barry Foote | 1980-04-22 | CHC | STL | W 16-12 | 6 | 6 | 2 | 4 | 2 | 8 | 0 | 0.952 | 6.546 | 2.169 | 6 |
| 10 | Pie Traynor | 1930-07-23 (2) | PIT | PHI | W 16-15 | 8 | 7 | 4 | 5 | 1 | 4 | 1 | 0.877 | 6.508 | 1.930 | 5 |
| 11 | Vladimir Guerrero | 2004-06-02 | ANA | BOS | W 10-7 | 5 | 4 | 2 | 4 | 2 | 9 | 0 | 0.648 | 6.463 | 2.054 | 3 |
| 12 | Cory Snyder | 1992-06-06 | SFG | HOU | W 12-6 | 5 | 5 | 2 | 4 | 1 | 7 | 0 | 0.781 | 6.419 | 2.092 | 4 |
| 13 | Elmer Valo | 1949-05-01 (1) | PHA | WSH | W 15-9 | 6 | 5 | 3 | 4 | 0 | 7 | 1 | 0.618 | 6.396 | 1.651 | 2 |
| 14 | Frank White | 1986-08-19 | KCR | TEX | W 9-8 | 6 | 5 | 2 | 4 | 2 | 7 | 1 | 0.964 | 6.265 | 1.827 | 5 |
| 15 | Jeromy Burnitz | 1993-08-05 | NYM | MON | W 12-9 | 7 | 5 | 2 | 4 | 1 | 7 | 2 | 0.481 | 6.254 | 1.557 | 5 |
| 16 | Chris Iannetta | 2017-09-22 | ARI | MIA | W 13-11 | 5 | 4 | 2 | 3 | 2 | 8 | 1 | 0.622 | 6.218 | 1.712 | 5 |
| 17 | Nippy Jones | 1949-06-15 | STL | BRO | W 9-5 | 4 | 4 | 1 | 4 | 1 | 6 | 0 | 0.583 | 6.207 | 1.545 | 7 |
| 18 | Craig Wilson | 2004-05-11 | PIT | COL | W 15-10 | 7 | 5 | 4 | 4 | 2 | 7 | 2 | 0.551 | 6.184 | 2.024 | 5 |
| 19 | Tim Foli | 1979-05-09 | PIT | ATL | W 17-9 | 6 | 4 | 3 | 4 | 0 | 4 | 0 | 0.584 | 6.178 | 1.579 | 2 |
| 20 | Dave Henderson | 1991-04-16 | OAK | CAL | W 8-5 | 6 | 6 | 2 | 5 | 1 | 5 | 0 | 1.002 | 6.161 | 1.987 | 2 |
| 21 | Gee Walker | 1936-08-08 (1) | DET | SLB | W 9-7 | 5 | 5 | 2 | 4 | 1 | 7 | 0 | 0.853 | 6.135 | 2.788 | 1 |
| 22 | Mel Ott | 1936-05-11 | NYG | PHI | W 13-12 | 6 | 5 | 3 | 3 | 1 | 8 | 1 | 1.078 | 6.121 | 2.290 | 4 |
| 23 | Albert Belle | 1999-07-25 | BAL | ANA | W 8-7 | 6 | 4 | 3 | 4 | 3 | 6 | 1 | 0.978 | 6.108 | 1.542 | 4 |
| 24 | Hoot Evers | 1950-09-07 | DET | CLE | T 13-13 | 6 | 6 | 3 | 5 | 1 | 6 | 0 | 0.867 | 6.077 | 1.935 | 5 |
| 25 | Joe Foy | 1970-07-19 (2) | NYM | SFG | W 7-6 | 5 | 5 | 2 | 5 | 2 | 5 | 0 | 1.001 | 6.063 | 2.022 | 6 |
| 26 | Dave Kingman | 1978-05-14 | CHC | LAD | W 10-7 | 8 | 7 | 3 | 4 | 3 | 8 | 1 | 1.033 | 6.026 | 2.080 | 4 |
Barry Foote? Nippy Jones? Joe Foy? Just goes to show, on any given day …
Well, the Babe has been shut out of this discussion so far, but no longer. Since we’re talking about high RE24 games, here are the players with the most games in a career with 3 RE24.
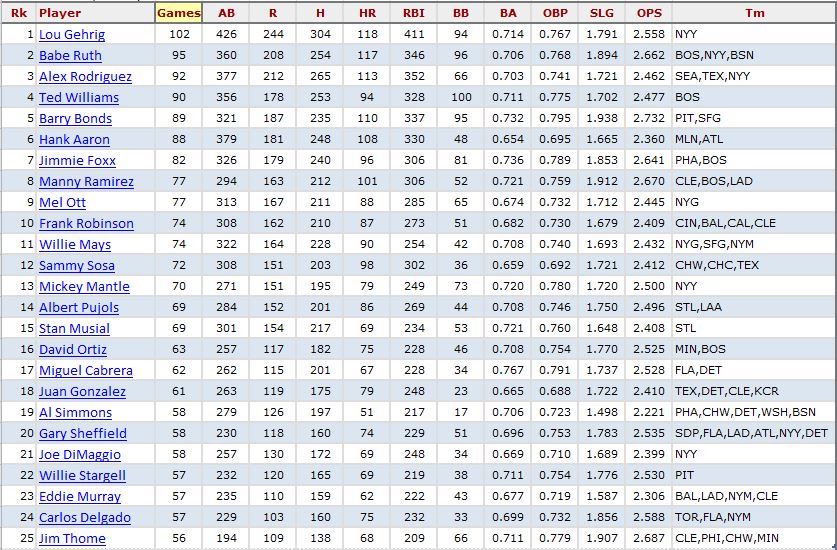
So Gehrig and Ruth top the career list, even with numerous games missing from their dockets. But, notice that the career totals are fairly modest, with a per season average of only 5 to 7 games with 3 RE24.
Here are the players with the most 3 RE24 games in a season (you’ll need to crank up the zoom to read the next chart).
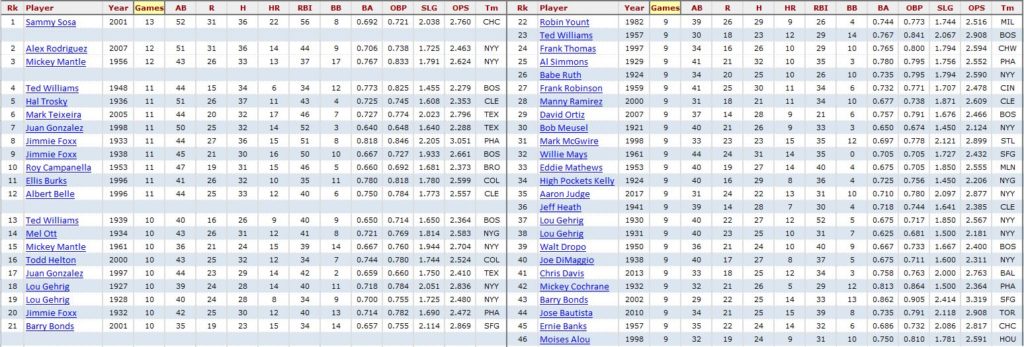
Aaron Judge‘s 52 HR season in 2017 is here, and Christian Yelich‘s 2018 campaign leads the group with eight 3 RE24 games in a season.
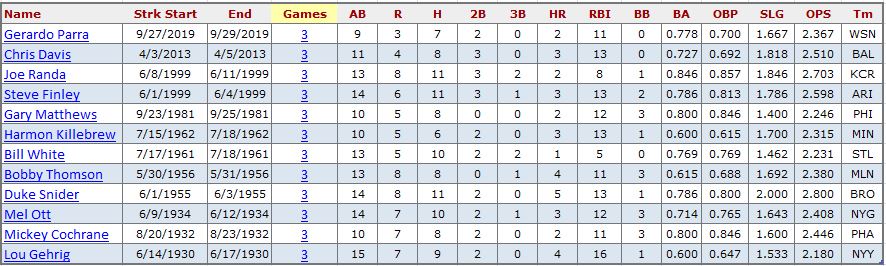
With 3 RE24 games as scarce as they are, lengthy streaks of high RE24 games are even scarcer. Only these players have recorded even three straight 3 RE24 games.
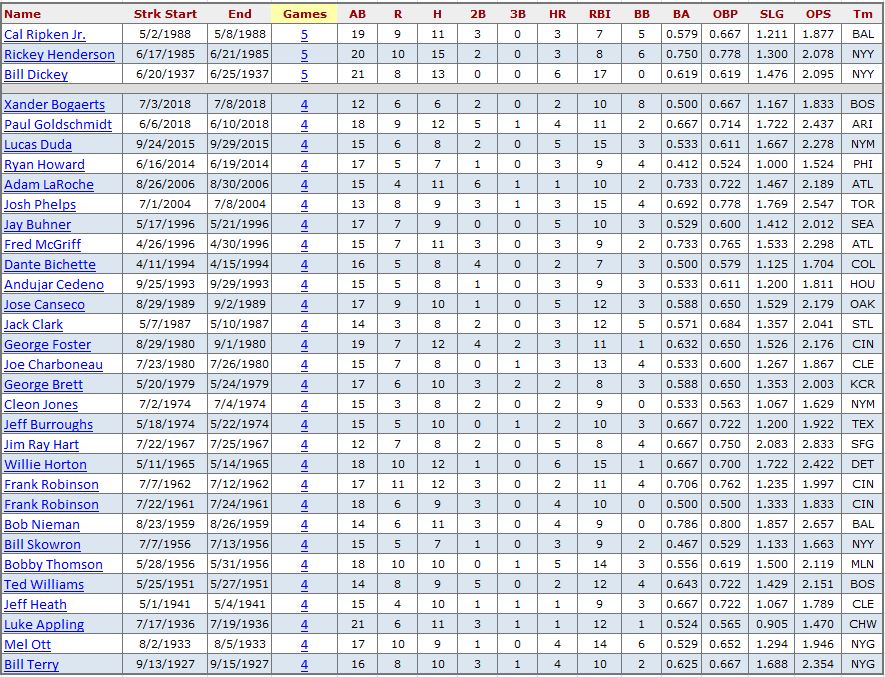
Lowering the bar to games with 2 RE24 adds only a couple of games to the longest streaks.
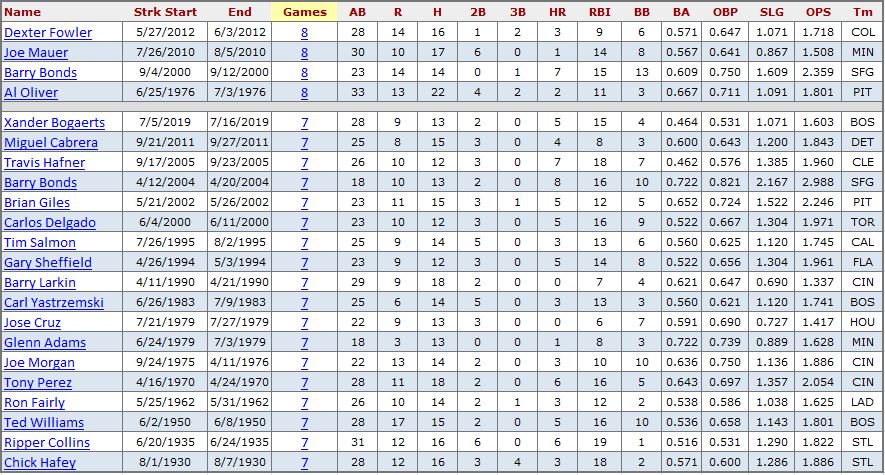
And, lowering again to games with 1 RE24 again adds only a few more games to the longest streaks.
You may be asking yourself whether RE24 correlates at all with any other metric. My thought turned to WAR Batting Runs (Rbat on Baseball-Reference) as a possibility, since both are measuring runs above or below average. Here are the career totals, side-by-side, for the top expansion era players.
| Rk | Player | Rbat | RE24 | From | To | Age | Tm |
|---|---|---|---|---|---|---|---|
| 1 | Barry Bonds | 1128.6 | 1357.796 | 1986 | 2007 | 21-42 | PIT-SFG |
| 2 | Frank Thomas | 690.8 | 743.694 | 1990 | 2008 | 22-40 | CHW-OAK-TOR |
| 3 | Albert Pujols | 678.2 | 738.616 | 2001 | 2019 | 21-39 | STL-LAA |
| 4 | Manny Ramirez | 651.5 | 700.505 | 1993 | 2011 | 21-39 | CLE-BOS-LAD-CHW-TBR |
| 5 | Alex Rodriguez | 639.6 | 723.769 | 1994 | 2016 | 18-40 | SEA-TEX-NYY |
| 6 | Hank Aaron | 592.7 | 697.241 | 1961 | 1976 | 27-42 | MLN-ATL-MIL |
| 7 | Jeff Bagwell | 591.2 | 697.826 | 1991 | 2005 | 23-37 | HOU |
| 8 | Jim Thome | 587.5 | 652.468 | 1991 | 2012 | 20-41 | CLE-CHW-LAD-MIN-BAL-PHI |
| 9 | Miguel Cabrera | 576.2 | 636.436 | 2003 | 2019 | 20-36 | FLA-DET |
| 10 | Gary Sheffield | 560.8 | 629.086 | 1988 | 2009 | 19-40 | MIL-SDP-FLA-LAD-ATL-NYY-DET-NYM |
| 11 | Chipper Jones | 558.4 | 686.005 | 1993 | 2012 | 21-40 | ATL |
| 12 | Frank Robinson | 556.3 | 644.820 | 1961 | 1976 | 25-40 | CIN-BAL-LAD-CAL-CLE |
| 13 | Rickey Henderson | 555.5 | 654.171 | 1979 | 2003 | 20-44 | NYY-OAK-TOR-ANA-SEA-NYM-SDP-BOS-LAD |
| 14 | Mark McGwire | 545.5 | 577.767 | 1986 | 2001 | 22-37 | OAK-STL |
| 15 | Edgar Martinez | 531.6 | 509.435 | 1987 | 2004 | 24-41 | SEA |
| 16 | Mike Schmidt | 527.1 | 624.304 | 1972 | 1989 | 22-39 | PHI |
| 17 | Reggie Jackson | 477.3 | 549.829 | 1967 | 1987 | 21-41 | KCA-OAK-BAL-NYY-CAL |
| 18 | Mike Trout | 470.1 | 498.885 | 2011 | 2019 | 19-27 | LAA |
| 19 | David Ortiz | 455.2 | 568.510 | 1997 | 2016 | 21-40 | MIN-BOS |
| 20 | Willie McCovey | 452.5 | 606.815 | 1961 | 1980 | 23-42 | SFG-SDP-OAK |
| 21 | Joey Votto | 452.3 | 544.210 | 2007 | 2019 | 23-35 | CIN |
| 22 | Joe Morgan | 450.3 | 695.094 | 1963 | 1984 | 19-40 | HOU-CIN-SFG-PHI-OAK |
| 23 | Carl Yastrzemski | 449.8 | 668.819 | 1961 | 1983 | 21-43 | BOS |
| 24 | Willie Mays | 444.0 | 556.398 | 1961 | 1973 | 30-42 | SFG-NYM |
| 25 | Jason Giambi | 443.0 | 567.144 | 1995 | 2014 | 24-43 | OAK-NYY-COL-CLE |
The RE24 results are generally somewhat higher (but consistently so) for these leading players. Park effects do seem more pronounced for RE24 than for Rbat, possibly because players on high-scoring teams will have more PA in a season that are reflected in their RE24 result. Whatever the reason, there are larger differences between RE24 and Rbat for players who played mainly in hitter’s parks. As an example, Carl Yastrzemski’s RE24 is almost 50% higher than his Rbat, while Edgar Martinez, playing in Seattle’s pitcher-friendly ballpark, actually has RE24 slightly lower than Rbat.
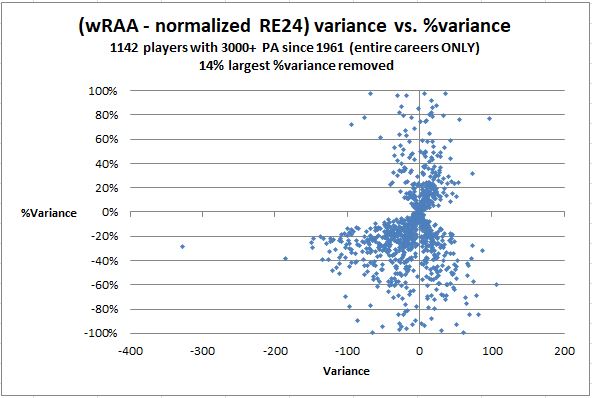
I’m not going to pursue a mathematical analysis of the two metrics but, suffice to say that they’re calculated about as differently as they could be, with RE24 derived at the micro level from game level situations, and Rbat at the macro level from linear weights applied to season counting stats. So, despite those massive differences, the rough level of apparent correlation between the metrics could be supportive of both. That apparent correlation can be visualized in the chart below which compares RE24 and wRAA (Weighted Runs Above Average), the latter being the basis for Rbat.
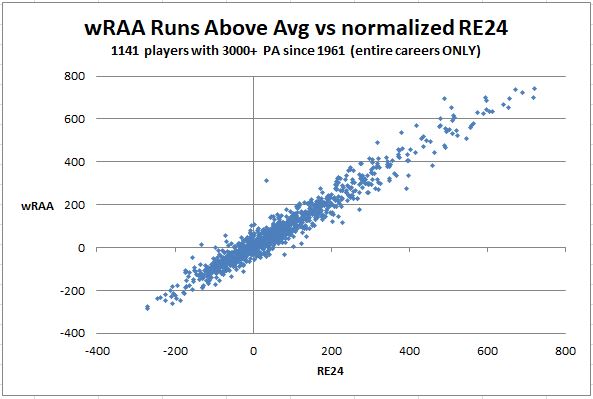
The variance between RE24 and wRAA is shown below, with distortions from the largest percentage differences (generally large percentages of very small numbers) removed to provided greater visual detail.
A few thoughts:
1. Doug, RE24 has been normalized for run environment… as REW (which is the acronym for RE24 Wins). Now, that’s not RE24/boLI… but you could calculate that, if you really wanted to. Anyway, for Edgar Martinez, the R:W calculation is 10.8:1; for Yaz, it’s basically 10:1. FWIW, Rbat is not normalized, either; that happens in the R:W conversion. Personally, I wish we measured EVERYTHING in runs; if I ruled the baseball world, at the very last stage, after calculating WAR or REW or anything, I’d run everything back into runs. That’s just my preference, though.
2. I realize you’re not specifically arguing that this is wrong, but I do have to say that I disagree with those who would argue, “Note that RE24 does not distinguish between innings or game situation, a characteristic that can perhaps be viewed as a weakness.” If one were to distinguish between innings or game situation (and by “game situation,” I think one would mean score)… you’d just have re-created WPA, and you wouldn’t have an independent statistic. Personally, I think RE24 is probably the happy medium between those who think we should go whole-hog into WPA and considering “clutch,” and those who think that “clutch” is nonsense. If one were to, as you’ve said, normalize RE24 for individual context
Thanks for the correction on Rbat. I guess I assumed it must be park adjusted since many of the largest deviations from RE24 were for players like Yaz who played in hitter’s parks (Rockies players are well represented in having the largest deviations from RE24). I was going to present the REW numbers, but they’ve been removed at present from B-R for some reason (perhaps they’ve discovered an error in the calculation and are in the process of fixing it).
Tango et al went after the “clutch” question in “The Book” but did so, I thought, in a curious way, arguing that because a player isn’t always better in the clutch, therefore there’s no such thing as a clutch hitter, Maybe I’m oversimplifying or missing their point, but I wasn’t convinced. To me, clutch hitting must be real, because the pressure is real and different people handle pressure better than others. I just ran a Split Finder for bases loaded hitting with 200 such PA (which fewer than 150 players have had). The tOPS+ results (measuring a player’s OPS in this split vs. his overall OPS) range from 163 for Eddie Murray to 48 for Jason Varitek. Tango would tell you that variation is just chance: Murray was lucky, Varitek wasn’t; but I just have a hard time seeing it that way.
If I recall correctly the way that these things have been studied in the past, the main thing you will find in clutch hitting is that it’s not predictive. For example, you could take 100 random players with, let’s say, 200+ career PAs* in clutch situations, and then divide them into two groups: the “good” clutch hitters in Group A at the top, the “bad” clutch hitters in Group B at the bottom – but do so using only the first half of their PAs; ignore their second half (so, their first 100 PAs for guys with exactly 200 such PAs, their first 150 for guys with 300, etc.). Then, check the numbers over the second half of their careers. I’d bet you that there’s less than a 10% difference between the two groups – maybe less than 5%. Much like individualized pitcher-batter matchups, they’re not predictive of future ability. If you don’t see a predictive nature to it, the effect is probably not real.
Now, it could be real for some guys and not others; it could be that some players improve or get worse. Or it could be random distribution. I’m not going to actually do such a study, but I would be willing to bet that if you did the above study again, looking only at the second halves of careers, dividing players into “good” Group C and “bad” Group D, you’d find in fact that the overlap between Group A and Group C was significantly closer to 50% than it was to 100%, indicating that it’s basically random. Now, I’d be extremely interested if I were proven wrong; so I’d love to see someone do the work. But, personally, I’m not interested enough to do the work, because I suspect that the conclusion of such a study would match the many, many other studies out there that prove there’s no such effect.
*If anyone thinks 200+ PAs is too many, feel free to suggest another number. But if the suggestion is “it has to be REAL clutch situations – bottom of the 9th in postseason games” – well, such a study would never have enough members to draw ANY conclusions, much less ones you could buy. Yes, you could figure out that David Ortiz had a lot of important hits in clutch situations; but you’ll also find a surprisingly large number of failures in hardcore clutch situations (9th or later; only looked in games the Red Sox lost by 2 or fewer, so there may well be more). That’s just my guy instinct on the matter, anyway. If I ever saw something really convincing that demonstrated a real repeated skill possessed, not by a few individuals (because, as you say, Doug, that COULD be random), but by a group of truly “clutch” players, I could be convinced. But for now, I think the likelier outcome is that, if there IS such a skill, it’s a small one, and it’s far, far less a skill than the differences between players, so I’d bet more on overall statistics rather than those.
Alas, the Split Finder doesn’t do splits within splits, but I’ll see if I can take that group of 140 odd hitters and break it into sub-groups based on when they played, and see if I can do the approximate first half/second half breakdown from there.
What occurs to me, though, is that clutch hitting, if it is a skill, is one that a player develops as he progresses in his career, becoming more relaxed in pressure situations because he’s become more confident in his abilities. But, we’ll see what the numbers show.
Doug, that’s a fair thing to think. But if true, then ALL players will see that effect across their stats, so you’ll still have a “good” group and a “bad” group. Also, I would bet – again, just spitballing here – that increased ability in pressure situations over the course of a career would have to be balanced against the natural decline of skills and abilities with age. So I’m not sure how much of a difference you’d actually see. But that’s just a thought.
I did the Before/After comparison to see if there was anything predictive. Here are the results.
– 37 players since 1961 with 100 bases loaded PA in seasons 1-8 and also after season 8
– 20 saw improved OPS in this split in second half, by average of 16%; 17 saw decline, by average of 17%
– 17 saw their split OPS and overall OPS trends match (both increased or both declined); of remaining 20 (with diverging trends), 12 saw their split OPS improve
– 12 were better in split than overall in both periods; 7 were worse in split than overall in both periods
– 5 were 10% better in split than overall in both periods; 2 were 10% worse in split than overall in both periods. Best and worst were Eddie Murray (+39%, +31%) and Jason Varitek (-25%,-27%).
Pretty mixed bag, so I would have to agree there isn’t much predictive value. But, a few players did seem to be able to elevate their game in this split or, conversely, allowed the pressure get to them.
I think what you’ve described is more or less exactly what random variation would’ve predicted. I would argue that perceived “improvement” or not is just putting a narrative on top of random numbers… but that’s just me. But thanks for looking at this!
(Another study, which I’m not encouraging you to do, would be to take this identical list of players and see if the same ones perform well or poorly in a different and unrelated split – say, by B-R’s “late & close” or postseason PAs or something. My guess? It’d be, as this study was, all over the map.)
There was also a bit of selection bias, as only one of the 37 players (Johnny Bench) began his career before 1970, and only three more (Winfield, Murray, Bob Boone) before 1980. Apparently, I would have to lower the PA threshold to pick up more of the players from the lower-scoring ’60s and ’70s, but then you have to be concerned whether there are enough PA in these specialized splits to be meaningful in any way.
Regarding clutch, I’ve never seen more hero-worship thrown at a major leaguer than Reggie Jackson with the possible exception of Derek Jeter.
1996-2012 162 747 .313/.382/.448 297TB 65BB 135K’s Jetes reg.seas. the years NYY made post-season
Postseason 158 734 .308/.374/.465 302TB 66BB 109K’s When the same immortal made history
1971-1986 162 .266/.358/.493 33HR 102RBI Reggie regular season when his teams made the post-season
Postseason 78 .278/.358/.527 18HR 48RBI (per 162G that’s 37HR 100RBI)
If THESE guys aren’t putting on Superman costumes in October, then nobody is…..with the possible exception of Nails Dykstra. Funny thing about Jackson, his playoff numbers (ALCS) numbers are poor and his WS numbers are exceptional – pretty random. But, obviously, the more PA’s any ballplayer gets, the more likely he is to perform as his usual self.
As a side note, I loved it when Jackson used to refer to Arod as “Al”.
sorry, Jeter’s strijkeouts are backwards-135 in the post-season…..
What about predictive in-season, instead of year to year?
Also, I think it can be helpful to ignore the stat line mentality and think in terms of individual games. Yearly stat lines, which are just a set of numbers divorced of context, can be misleading.
Doug,
Thanks for all the work. That’s a lot of “dat-er”
Doug,
Not to be “that” guy, but your list of multiple season RE24 leaders doesn’t include Frank Robinson (NL 1961/AL 1966) and Dick Allen (NL 1966 / AL 1972). I completely understand the oversight on Allen since he was Richie in 1966 and Dick in 1972 🙁
I don’t know if there are any other guys who may have switched leagues and led both leagues for a single season
Thanks again
Those are the only two to lead both leagues. I’ve updated the narrative to give them a mention.
Pingback: Can’t Fight this Stealing: Making Sense of the Stolen Base Craze - Raise Reward