
Pitchers tend to hold the upper hand to start the season, with batters warming up with the weather. But, some batters buck that trend and are hot to start the season, including some who do so on a regular basis. So, who are April’s heroes? Spoiler alert: they’re also the heroes in the other months of the season. More after the jump.
To illustrate the fortunes of pitchers and batters on a monthly basis, here are the results for the past 20 seasons (2004-23).
| Mar/Apr | May | June | July | August | Sep/Oct | |
| OPS | .726 | .734 | .739 | .741 | .744 | ,733 |
| ERA | 4.13 | 4.15 | 4.21 | 4.24 | 4.27 | 4.20 |
To identify the best hitters starting the season, we could also look at the Mar/Apr split, Except that, with the season now starting two to three weeks earlier than in pre-expansion days, that split would contain considerably more games in the recent past than in the 154-game season era. Thus, I’ve chosen to normalize those seasons by looking at player performance over their teams’ first 20 games of the season. Those 20 games occupy different weeks of the calendar in the 154 and 162 game eras but, as a warming climate has permitted progressively earlier season starts, the weather for those first 20 games in 2024 may not be that much different than for the first 20 games of 1924.
So, let’s first look at career performance over a team’s first 20 games of the season. Ideally, we could look at OPS+ as a metric of choice for offensive performance. Alas, that number is not available for specific chunks of games so OPS will be used instead. As you’ll see, I’ve chosen to focus on 1.000 OPS as a number indicating superior performance in any era, but obviously more so in lower offensive eras and less so in higher offensive eras. Thus, the lists you will see will tend to over-represent periods like 1925 to 1935, and 1995 to 2005, but under-represent periods like 1905 to 1915 and 1965 to 1975. To give you a very general idea of the impact on stats on players of those eras, here are some notable players who were in their primes during those eras, showing their actual and neutralized OPS.
| Player | Seasons | Actual OPS | Neutralized OPS | OPS Impact |
| Ty Cobb | 1905-1915 | .942 | .966 | -2.4% |
| Lou Gehrig | 1925-1935 | 1.083 | 1.027 | +5.5% |
| Tony Perez | 1965-1975 | .834 | .849 | -1.8% |
| Manny Ramirez | 1995-2005 | 1.019 | .966 | +5.5% |
So here are the top career OPS results for the first 20 games of the season, for 1901 to 2023, with a minimum 175 total bases over this portion of the season.
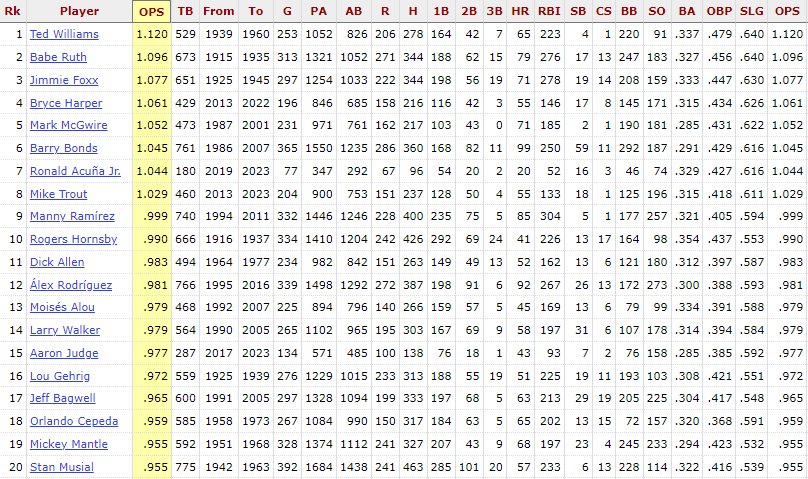
Admittedly, 175 TB is a low career threshold, but one that was chosen so as not to exclude some of the best players of the present day. That said, those currently active players will very likely see these career numbers decline once their careers have finished. Not surprisingly, there are only two players in the top 20 (three if you count Mantle) from the low offensive era of the 1960s and 1970s, and none from the dead ball era. Most surprising name in the top 20 (for me) would be Moises Alou, but more understandable given the offensive era he played in.
Looking at individual seasons yields this list of the best OPS scores over the first 20 games of the season, with a minimum 40 total bases over that period.
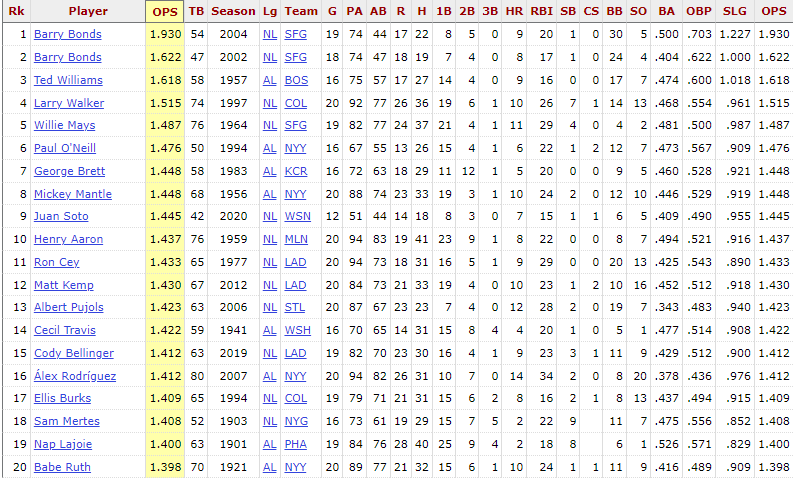
So, the top 20 shows a mix of a number of baseball’s all-time top offensive seasons with some other seasons that only began with a very hot start, including several from recent memory.
In all, 638 players turned in 1113 seasons with 40 TB and 1.000 OPS over their teams’ first 20 games of the season. On the premise that doing so once could be a fluke, and doing it twice might just be good luck, I’m going to focus on those players with three or more such seasons. That reduces the list considerably, to these 113 players.
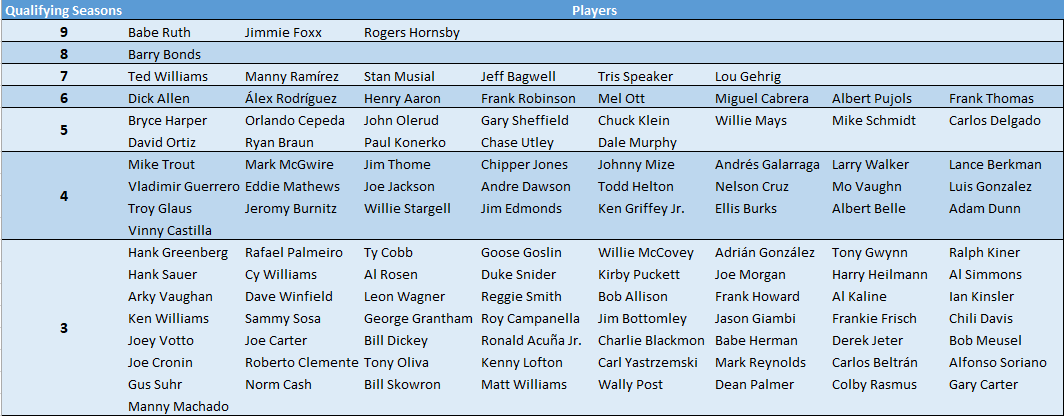
The term qualifying season here refers to seasons with 40 TB and 1.000 OPS over a team’s first 20 games. Mostly all-time greats at the top of the table, mixed in with good to very good players in the lower reaches, and a few quirky names (but not Jamie Quirk) at the bottom. Dick Allen is notable with six seasons in a considerably shorter career than many of these players, and in a challenging offensive environment. At his current pace (3 of 6 qualifying seasons), Ronald Acuna Jr. could be challenging for the top of this table before his career is done.
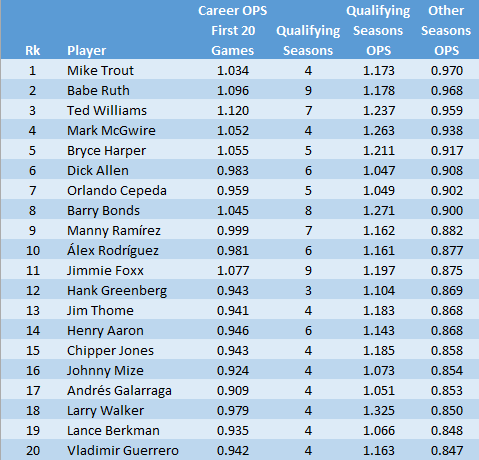
These 113 players posted these results in their qualifying seasons.
As a reminder, Qualifying Seasons OPS denotes OPS over first 20 team games for all seasons with 40 TB and 1.000 OPS over that part of the season. In some cases, the Qualifying Seasons OPS and Career OPS numbers are relatively close, but not so close for some other players, including Harry Heilmann at the top of the list.
Looking at the same group of the players for the non-qualifying seasons of their careers yields this result.
So, the top 3 on this list, especially, came close to a 1.000 OPS over the first 20 team games of the season for all of the seasons of their careers (Other Seasons OPS) that they did not reach that level. Quite the accomplishment!
To close, we’ll crown the best early season hitters by combining their first 20 game OPS for their Qualifying Seasons (40 TB and 1.000 OPS) and for all of the other seasons of their careers. Just to be a little exotic, I’ll use a harmonic mean of these two OPS results rather than the arithmetic mean or average of the two numbers. What is a harmonic mean? Well, here is the formula.
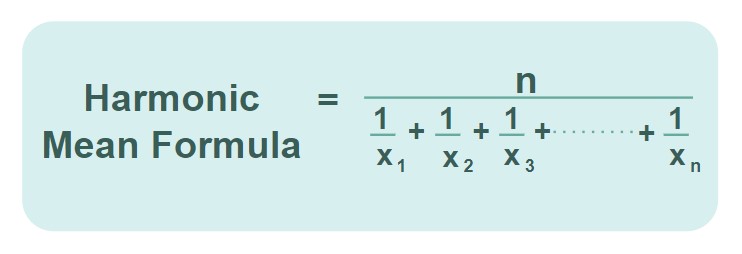
Clear as mud? For our example, n = 2, signifying two variables, the Qualifying Seasons OPS (x1) and Other Seasons OPS (x2). The highest values for the harmonic mean will result from high values for both of these variables that are close together. That may be more readily appreciated by reformatting the above equation to the one below for our case of n = 2.
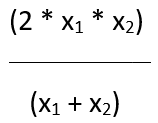
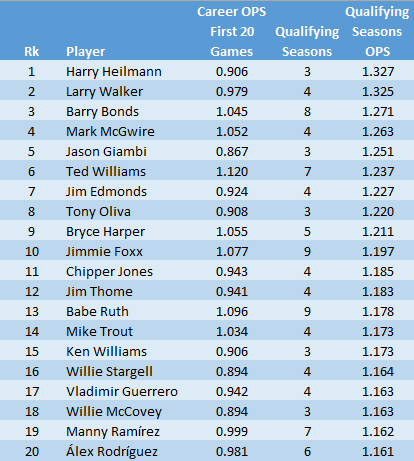
Thus, the harmonic mean will show us the players with the best and most consistent results for first 20 game OPS for all of the seasons of their careers. Here are those results.
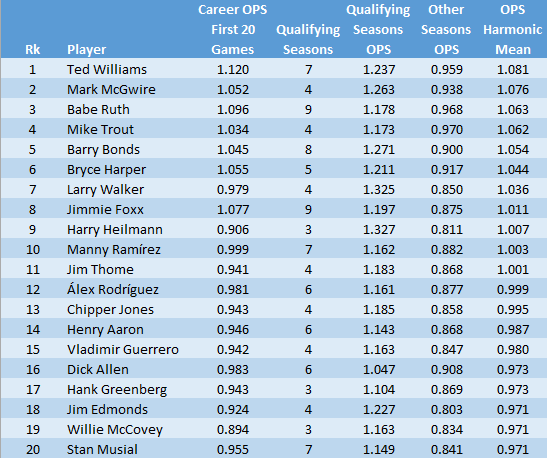
So, the Splendid Splinter takes the top prize, followed closely by Big Mac and the Babe. Current stars Trout and Harper are in hot pursuit, though they will likely not be so close once their careers are finished.
Doug:
This post reminded me of the one from about a year ago that addressed a somewhat similar subject—forgive the alliteration— of batters who were hitting .400 or better after 65 games.
Is there any correlation between the list of 20 individuals seasons focussing on OPS in your second chart above and the 29 seasons listed in the previous post that centered on BA?
Lajoie’s 1901 season and Walker’s 1997 season appear on both, but I’m wondering, in other words, whether there are any others that come close, or whether possibly even most of them do.
Hope I’m not asking the impossible.
nsb.
It looks like you spotted the only two seasons common to both lists.
Surprising there isn’t more overlap, especially considering the .400 hitters were, with just two exceptions, sporting gaudy OPS figures above 1.000 after 65 games, including ⅔ of the list above 1.100.
Here are the OPS/OPS Rank after 20 games for the seasons in .400 BA list.
Cobb 1911 – 1.054 / 708
Sisler 1922 – 1.124 / 381
Galarraga 1993 – under 1.000 or 40 TB
Sisler 1920 – under 1.000 or 40 TB
Heilmann 1921 – 1.339 / 38
Heilmann 1923 – 1.281 / 82
Lajoie 1901 – 1.400 / 19
C. Jones 2008 – 1.175 / 231
Hornsby 1925 – 1.261 / 94
Zimmerman 1912 – 1.186 / 206
Foxx 1929 – 1.193 / 194
Jackson 1913 – 1.186 / 207
O’Doul 1930 – 1.039 / 806
Carew 1983 – 1.009 / 1038
Manush 1934 – 1.114 / 414
Williams 1941 – under 1.000 or 40 TB
Walker 1997 – 1.515 / 4
Cobb 1925 – under 1.000 or 40 TB
Honrsby 1921 – 1.143 / 318
Olerud 1993 – 1.150 / 299
Ruth 1931 – under 1.000 or 40 TB
Klein 1930 – 1.141 / 322
Jackson 1912 – under 1.000 or 40 TB
Cobb 1915 – under 1.000 or 40 TB
Fernandez 1999 – under 1.000 or 40 TB
Arraez 2023 – under 1.000 or 40 TB
Lajoie 1910 – under 1.000 or 40 TB
Gehrig 1936 – 1.091 / 525
Musial 1948 – 1.066 / 645
Doug,
Interesting that your final (harmonic-mean-derived) list has possibly only one “suspect/oddity” (Jim Edmonds) of the 20. The others were, basically, year-round mashers whose career OPS+ numbers are probably entirely top-40 all-time (excluding Negro Leagues). That being said, Edmonds was a pretty darn good babseball player…..
sorry, Edmonds was a “baseball” player
Here is a list of the HOF position players since 1901 whose April batting averages were at least 30 points below their career averages. Slow starters, in other words, not fast ones. This doesn’t correspond exactly with Doug’s super-comprehensive approach, but it gives a rough idea, being dissonant and totally un-harmonic, although perhaps a little mean, especially if my columns don’t line up.
PLAYER APRIL BA CAREER BA DIFFERENCE
Edd Roush .263 .323 .060
Ryne Sandberg .230 .285 .055
Frank Baker .255 .307 .052
M. Cochrane .270 .320 .050
H. Manush .281 .330 .049
R. Ashburn .265 .311 .046
Ross Youngs .277 .322 .045
Max Carey .243 .285 .042
Johnny Evers .230 .271 .041
George Brett .264 .305 .041
Johnny Mize .272 .312 .040
Chick Hafey .278 .317 .039
Yogi Berra .247 .285 .038
Luke Appling .273 .311 .038
Ty Cobb .329 .366 .037
A Vaughan .284 .318 .034
Travis Jackson .260 .291 .031
Earl Averill .287 .318 .031
The player whose name stands out in this approach is Ryne Sandberg. Followers of Chicago Cubs baseball in the 1980s and 1990s such as myself may recall how carefully the media tiptoed around the fact that in most years their golden boy’s bat was ice cold in April. Sandberg himself, being a modest, hardworking guy, was far more frank.
Some random comments:
I doubt the Tigers were too much impacted by Cobb’s mere .329 April performance.
Sandberg and George Brett are the only players on the list from later than the 1960s. Five are associated with the dead ball era, six with the twenties and thirties, three with the forties and fifties. Domed stadiums and teams in warmer climes may have had an effect.
Despite their slow starts:
-Mize had 4 seasons with 1.000 OPS over first 20 games, and Cobb and Vaughan had 3 such seasons
-Brett in 1983 posted the 7th highest single season OPS over first 20 games
Happy Birthday to former Yankee and Oriole pitcher Art Schallock, the oldest living major-leaguer at age 100.
Schallock in 1954 became the 18th and last Yankee pitcher with a CG in his only start of the season (a marathon effort facing 44 batters and allowing 10 hits and 6 walks). That Yankee list includes two seasons by Babe Ruth, both aged 35+. Greg Harris, in the first start of his career in 1988, is the last pitcher for any team with a 9 inning CG in such a season.
Harris’s career is also notable for the 2.40 ERA he posted over his first three seasons and his 5.64 mark for his final three campaigns. The 3.24 difference is the largest (by a wide margin over 2nd worst David Cone with 2.89) of the expansion era among pitchers with 200+ IP in both periods. Softball quiz question: who is the only HOF pitcher to make to worst 10 on that list?
Harris wrapped up his career with a not-too-stellar 4-25 W-L record in 38 starts between COL and the Twins. Clocked in at ~ 6.90 ERA and an ERA+ of ~ 72. The “other” Greg Harris was ambidextrous…..
Gotta be either Carlton or Halladay for the “only HOF pitcher” on the list?
Mile High and the HomerDome will do that to you. Not surprisingly, Harris’s .138 W-L% over his final 50 games is the worst of any expansion era pitcher with 30+ starts and 20+ decisions over that part of his career. Only worse result prior to 1961 was Jack Nabors‘ 1-23 record (.042) for the A’s in 1915-17.
Carlton is correct, with a 2.75 ERA difference between his last three and first three seasons. He also finished his career in the hitter-friendly confines of HHH.
I went back and checked after guessing the two former Phillies. I did not realize how mediocre Halladay was initially with the Blue Jays. He sure improved 🙂
I believe Carlton had to hang on due to some theft by a sports agent? It was pretty sad to watch him struggle all over the place getting released and re-signed – kind of like a shot trial horse in boxing. In his prime, he would have an occasional rough initial few innings (i.e. 3 earned runs in the opening stanza) and he wouldn’t get lifted. Lucchesi, Ozark, Owens, Green – they all knew he was better than any alternative in the bullpen and, inevitably, he’d go 8 or 9 innings and they’d be back in the game.
Kyle Schwarber is on pace for a fascinating and horrifying statistical line of:
124 Runs
129 Hits
0 Doubles
0 Triples
37 HR
97 RBI
106 BB
240 Strikeouts
240 Total Bases
.206 / .315 / .382 / .697
100 OPS+
_______
If I manipulated the free version of Stathead correctly, the lowest SLG for a player with 35+ HR is Joey Gallo in ’21 with .458
Most plate appearances in a full season without a double (excluding pitchers):
Duke Sims with 133 in ’65
https://www.baseball-reference.com/players/s/simsdu01.shtml
Scwarbs is at 162 so far.
Breathtaking. I’ll go with zero doubles as the biggest anomaly, but it’s tough to choose with so many other contenders:
Strikeouts = Total Bases
35+ HR, yet sub.400 SLG
120+ runs with runs nearly equal to hits – but only 100 OPS+
All while leading off for the club with the best record in baseball. Go figure.
Schwarber’s teammate Nick Castellanos, who had 37 doubles in 2023, just got his first today in his 143rd plate appearance. Entering today, Castellanos was slashing .185 / .243 / .246 / .489 for a 42 OPS+.
So far, all the teams the Phillies have played are currently .500 or under with the exception of the Braves who took 2 of 3 from Philadelphia
And Aaron Judge is on pace for 45 GIDP. Jim Rice and his 36 are putting some champagne on ice…
Off subject a little, hot start vs sustainable. I was looking at the NYY (guilty, fine, I admit it) ERA vs FIP and it just seems unusually jacked. Then I went back all the way to 2019 and they have continually out-performed their FIP but maybe not to that extent. I guess I was more under the impression that ERA and FIP tend to balance out given enough sample size almost by rule. Maybe there’s a Mariano Rivera oddball out there who out-performs by drastically limiting contact quality, but then there’s a flyball pitcher who always seems to give up more quality contact than average.
Has there ever been a complete season with the kind of ERA-FIP (currently -0.84) advantage the 2024 Yankees are pulling off? does this tend to converge over the seasons months to zero? How much hot start vs cold start can we see in this ERA-FIP metric?
It’s gone UP to -0.94. Yankee defense seems to be better than people expected with Verdugo at +9 DRS, Soto and Judge at +5 and +2 respectively. I don’t think anybody had the yankees outfield as a +50 DRS over 162.
Another early season anomaly.
The Nats, Cards and Braves this season all recorded 10 or fewer errors over their first 30 games, joining a group of teams now numbering 30. Of those 30 teams, 24 are from the past 12 seasons, and only two are from seasons prior to 2000. Have official scoring standards changed appreciably over that period, or are teams just way better defensively than in prior years?
While it took this year’s Nats 32 games to reach 10 errors, they added 7 more in the following two games, becoming the first of those 30 teams from the current century to post back-to-back 3+ error games. The two teams in that group from the 20th century both had a pair of streaks of 3+ error games, including a back-to-back-to-back run by the 1960 Reds.
Subjectively, I have seen a lot more hits called even when the ball hits the glove. In years past, that was an error, even on a 120mph stanton liner to third.
Thanks for that feedback, mosc. Glad to know it’s not just me with that same observation.
Rule 10.12 uses the standard of “ordinary effort” (but makes no attempt to define the term) for the scorer to decide if an error should be called. I suppose any effort to field the Stanton line drive might be construed as extra-ordinary, given the threat to life and limb 🙂
Corbin Burnes tonight (Mon, May 13) recorded his 9th consecutive start allowing 3 runs or less. That is a new franchise high for players beginning their tenure with the Orioles. The old record of 8 games was set by lefty Rick Krivda in 1995.
I gotta believe that if Burnes stays healthy, he’ll be pitching in the post-season with an opportunity to exponentially increase his free agent winnings in the off-season. Negotiations probably starting at 6 years/$200,000,000 ?
Krivda, OTOH, appears to have earned MLB minimum (or close to it) in each of his four seasons.
Elly De La Cruz did something no other player has done (again) on May 16th, with 4 hits, 4 SB and a CS in 4 AB against the Dodgers. Scott Podsednik had the same totals on May 1, 2006 but needed 5 AB to do it. Four players have done De La Cruz one better, with 5+ SB and 4+ H, incl. a H in every AB, led by Carl Crawford with 6 SB and 4 H on May 3, 2009, and Johnny Neun with 5 SB and 5 H on Jul 9, 1927.
With 65 SB, 134 H and 66 RBI through 142 games, De La Cruz is currently on pace to record the most SB through his first 150 career games. among players with twice as many hits as SB, and as many RBI as SB over that part of their careers. These are the 8 players (plus De La Cruz) who reached those markers while swiping 50 or more bags. Note that current leader Benny Kauff played all but 5 of his games in the Federal League.
Starts of 5+ IP with 0 Hits, 0 Runs, 10+ K’s, earliest from start of career:
game 2 – Paul Skenes (2024)
game 15 – Chris Heston* (2015), Don Wilson* (1967), Johnny Lush* (1906)
* CG no-hitters
Highest SO/9 over first two games of career, for pitchers with starts in both games.
1) 16.76 – Freddy Peralta (2018)
2) 16.2 – Paul Skenes (2024)
3) 16.05 – Stephen Strasburg (2010)
4) 15.26 – Yariel Rodriguez (2024)
5) 14.90 – Kyle Harrison (2023)
6) 14.4 – Sawyer Gipson-Long (2023), Dinelson Lamet (2017)
8) 14.29 – Matt Harvey (2012)
9) 14.25 – Tim Hudson (1999)
10) 13.5 – Dane Dunning (2020), Reynaldo Lopez (2016), Karl Spooner (1954)
Complete Game Shutouts among the above starts.
2 – Karl Spooner
0 – all the rest