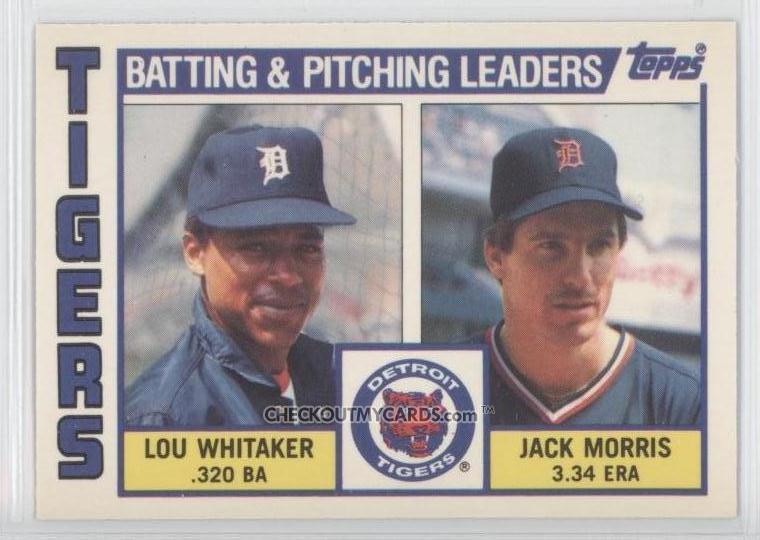
OK…let’s get one of the big franchises out of the way. The Tigers are another team that joined MLB in 1901 (although they were founded in 1894). In 111 years, the Tigers have had only 12 first-place finishes. Three of them came in 1907 to 1909 but they lost the World Series each year. They made 7 more World Series and won it in 1984, 1968, 1945, and 1935. Continue reading
Author Archives: Andy
The Mount Rushmore of the Texas Rangers
Let’s take a look at the Texas Rangers, including their years as the second version of the Washington Senators.
When the Senators came into the league in 1961, they were pretty bad. In their first four seasons, they lost at least 100 games every season. They didn’t finish higher than 6th until their 9th season in 1969, and that’s only because the leagues were split into divisions. From 1972 to 1993, the relocated Rangers finished 2nd six times and were in first when the season was aborted in 1994.
The Rangers finally made the playoffs for the first time in 1996 and had a nice run of 3 post-season appearances in 4 seasons, but won only 1 game over all the series. They didn’t make the playoffs again until 2010, when they made the World Series, a feat they duplicated last year. The franchise is at its peak right now.
Continue reading
The Mount Rushmore of the Oakland Athletics
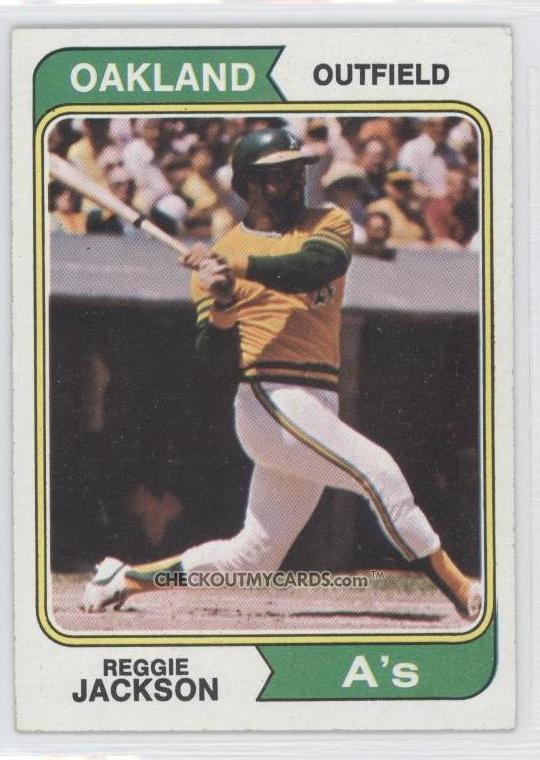
Well, we’re back into the truly classical era now, moving to a franchise that was founded in 1901. For our purposes, this poll includes the Philadelphia, Kansas City, and Oakland A’s.
The year that Tony Gwynn hit .400
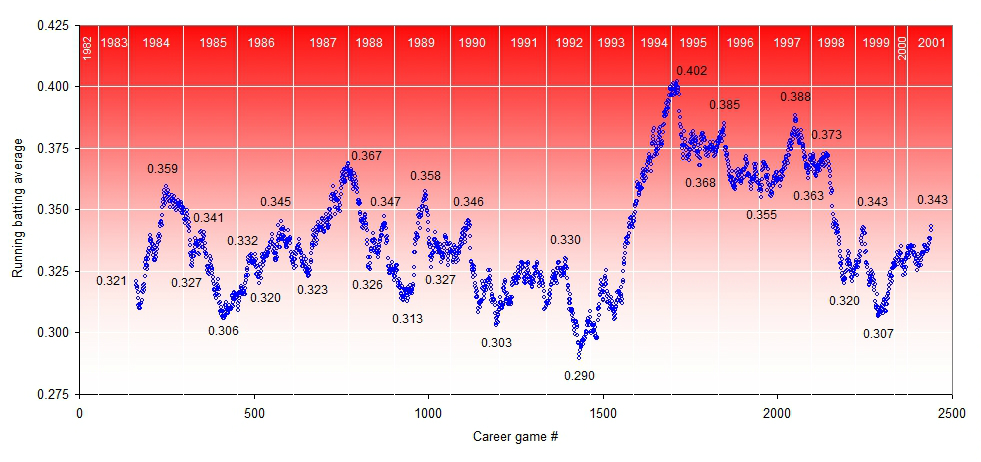
Here’s a treat for you. Following is a graph of Tony Gwynn‘s rolling batting average throughout his career for each 162-game period. The first data point is at his 162nd-career game and gives his batting average for his first 162 games.
Click on the image for a slightly larger version.
I’ve labeled many of the high and low points. Right away, you’ll notice that Gwynn hit .402 over a 162-game period ending in 1995. From July 27th 1993 through May 13, 1995, Gwynn appeared in 162 games, and had 704 plate appearances. He had 624 at-bats with 251 hits (.402 BA), as well as 15 HR, 100 RBI, 121 runs scored, a .457 OBP and a .563 SLG.
Other notes about the fabulous Mr. Gwynn:
- It’s hard not to think of Ted Williams‘ 1941 at this point. That year, Williams batted .406 while leading the league with 37 HR, a .553 OBP, a .735 SLG, and a 235 OPS+. Gwynn was obviously not the same kind of hitter as Williams, never showing that same kind of power. Still over the 1994 season (all of which was encompassed in his .400 season) Gwynn had an OPS+ of 169, his career high. Gwynn also gets high marks for maintaining his average over 624 at-bats. In Williams’ season, he had only 456 at-bats thanks mainly to his very high walk total (and the fact that he didn’t play 162 games.)
- The lowest “rolling-162” batting average of Gwynn’s career was .290 (actually .28952), which he had after the game on August 1, 1992. His full stat line for the preceding 162, covering back to June 23, 1991, was 702 PAs, 639 at-bats, 8 HR, 51 RBI, 88 runs scored, with a slash line of .290/.348/.388. Decidedly un-Gwynnish, but a “worst” career line that hundreds of ballplayers would gladly take, especially the .348 OBP.
- Dude closed out his career batting .343 in his final 162 games, slightly higher than his career mark of .338.
- Those 251 hits Gwynn got over his .400 “season”–that’s an extremely high number. Ichiro had 262 in 2004 (with the benefit of 704 at-bats) and before that the last guy to have so many in a regular season (within a single year) was Bill Terry, with 254 in 1930.
The Mets have had more than their share of complete game 1-hitters
Some quick math, 1962-present
Mets: 26 complete-game 1-hitters
All other teams: 467 complete-game 1-hitters
Mets: 8,020 total games
All other teams: 201,898
So all other teams have produced 467 1-hitters in 201,898 games, or a rate of 0.23% of the time.
The Mets have produced 26 1-hitters in 8,020 games, or a rate of 0.32% of the time.
It may not sound like a lot, but it means that the Mets should have had 18 or 19 1-hitters in their existence instead of the 26 they’ve actually had. What does this tell us? What we already knew–they had been overdue for a no-hitter.
10 Amazin’ Mets facts about Johan Santana’s no-hitter
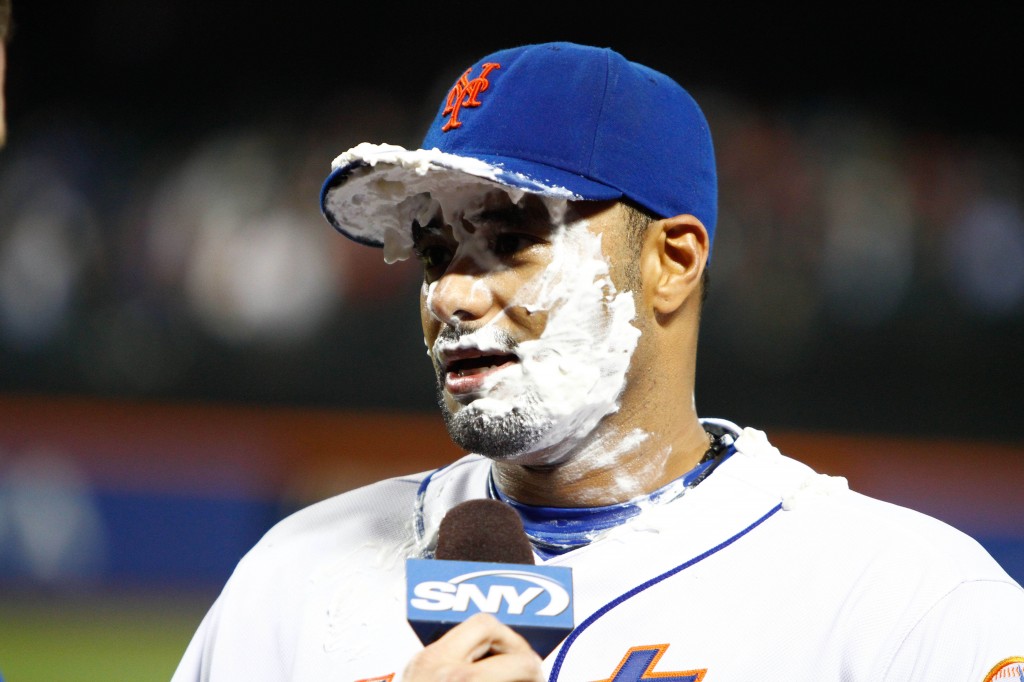
Here are 10 facts about The Mets and Johan Santana following his no-hitter for the Mets. Continue reading
Photo of the day: Carlos Gonzalez hovers in mid-air
Radio interview now available
Yesterday’s radio interview is now available online here. Right now it’s playing in the main media player on that page (5/31 show). At some point it will get archived further down that page as the Week 4 show.
My appearance starts around the 39-minute mark.
Hear Andy from High Heat Stats live on ESPN Radio tonight
I will be appearing on ESPN Radio 1510 AM in Kansas City tonight to discuss the results of our Royals Mount Rushmore poll. The folks from the Kansas City Baseball Vault have invited me on as a guest and I expect to be heard around 7:30 ET / 6:30 CT.
You can listen live at 1510.com or, if it’s already aired, check out the show archive at the link above.
3-homer games since 1992, split by stadium
I just did a manual workup of all 3-homer games since 1992, split out by team’s home stadium. Note that this doesn’t take into account stadium changes–for example the numbers for Washington include all 3-HR games by Expos or Nats hit at home, and all 3-HR games by visitors at the Expos’ or Nats’ home stadium.
Team   H    V   Total
CHC    9    8   17
COL    8    9   17
TEX    9    7   16
CIN    9    6   15
BOS    6    5   11
TOR    6    5   11
MIL    7    3   10
PHI    2    8   10
CLE    5    3    8
ARI    4    3    7
BAL    3    3    6
DET    3    3    6
KCR    0    6    6
NYY    5    1    6
WSN    2    4    6
ATL    1    4    5
CHW    1    4    5
HOU    2    3    5
LAD    3    2    5
SEA    2    3    5
STL    3    2    5
OAK    3    1    4
SDP    1    3    4
LAA    2    2    4
PIT    1    2    3
SFG    1    2    3
TBR    2    1    3
FLA    1    1    2
MIN    0    2    2
NYM    0    0    0
So these are 3-HR games by home-team players, and by visiting players, and the total.
Check out the disparities for the Brewers, who have hit a lot more at home than their visitors have, and the Phillies, who have yielded a lot more at home than they’ve hit.


