
Here’s a pretty simple graph showing the breakdown each year of hits distribution.
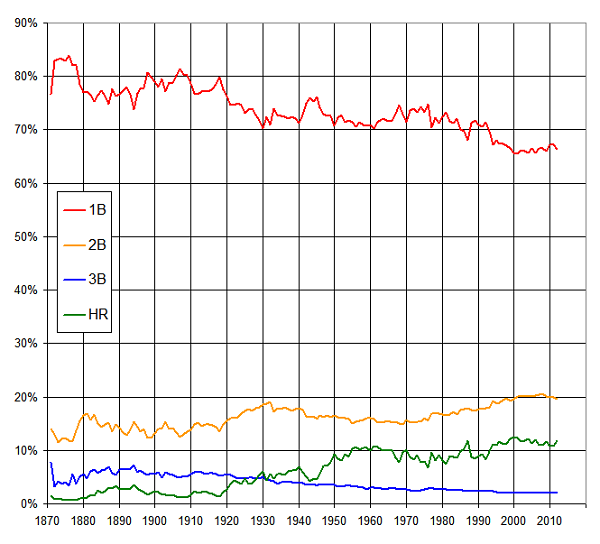
So, for any given year, this shows the percentage of total hits for that year that were singles, doubles, triples, or homers.
Some observations / conclusions:
- Singles have, understandably, fallen off considerably. At the dawn of the game, they represented more than 80% of all hits but in recent years have been right around two-thirds. 2012’s percentage of 66.4 is among the lowest ever–just slightly above figures between 65 and 66 in the 2000’s.
- Triples increased in the 1880s and 1890s but have declined pretty steadily since except for renaissances in the 1910s and 1970s. The rate has hovered right around 2% for several years now.
- Doubles are quite interesting. You might have expected that they peaked in the late 1990s or early 200s (like homers) but their two peak seasons are actually 2007 and 2008, at 20.4% and 20.5% respectively. Doubles are off a bit in the last couple of years, probably largely because home runs have spiked again.
- Homers took a huge upward turn when Babe Ruth came on the scene, then took subsequent big jumps in the 1940s and the 1990s. They peaked in 2000 at 12.6%, fell as low as 10.8% in 2011 but rebounded last year to 11.8%.
- 1987 shows up again as a really fluke year. Home runs spiked up that year (then back down in 1988) and singles spiked way down (and then back up in 1988).
I wonder what singles will look like 50 years from now. The decline has been remarkably linear so far, losing just about 8/10ths of a percentage point each decade. I’m sure that rate will slow, or else singles will account for fewer than half of all hits by about the year 2206. (Although this is an accurate projection from the data, rest assured that my tongue is planted firmly in my cheek right now.)
Fascinating data Andy. A couple of things about the home run data that I find interesting:
1) The HR rate in the mid-50s to to the mid-60s wasn’t all that different from the “steroid era”. And given the natural upward progression of HRs over the years, perhaps the steroids era isn’t really the outlier we think it is.
2) Home runs declined in the 60s but increased after the pitching mound was lowered. But even with that, rates in the 70s and 80s were lower than the mid-50s/mid-60s. Does anyone know why? Was it ballpark size? Seems particularly odd since the introduction of the DH should have led to a (small) increase in the HR rate.
Indeed–in 1961, teams hit 0.95 HR per game. In 2011, it was 0.94.
“The HR rate in the mid-50s to to the mid-60s wasn’t all that different from the “steroid era”.”
Ed, I’m not sure exactly what you meant by “HR rate”:
– HRs as a percentage of hits, which Andy graphed?;
– HRs per game, which Andy referenced in his reply?; or
– HRs as a percentage of plate appearances? (this being my usual meaning of the term)
But by any definition, the rate for the steroids era was significantly higher than the period you mentioned.
For the earlier period, let’s use the years 1955-62. That yields the highest average we could get for a period in that era. (HRs jumped in ’55 and dropped in ’63.) And for the “steroids era” let’s use 1994-2006.
– HRs as a percentage of hits was 10.40% for 1955-62, and 11.78% for 1994-2006, a rise of 13%.
– HRs per game was 0.91 for 1955-62, and 1.08 for 1994-2006, a rise of 18%.
– HRs as a percentage of PAs was 2.37% for 1955-62, and 2.79% for 1994-2006, a rise of 17%.
HRs as a % of hits shows a smaller gain in the steroids era than the other rates, because batting averages in that period were also 3.6% above the first period. But a 13% increase is still significant, given that we’re comparing the two periods of highest HR frequency.
John – Yes, I was basing it off of Andy’s graph. So HR’s per hit.
Anyway, we may disagree on this, but I personally don’t see a 13% increase over a 40-50 year period as that significant, given changes in player size, better conditioning, etc.
Ed, I think we disagree about the HR trends being a “natural upward progression,” as you termed it.
When I look at a graph of HR% (that is, HRs as a percentage of PAs) from 1920-2012, I see 3 broad periods:
1) 1920-62 — Steady increase, except for the WWII years when the ball was made of corn flakes.
2) 1963-93 — Up-and-down between 1.5% and 2.4% (except for the ’87 spike), averaging 2.05%.
3) 1994-2012 — Leaping to 2.66% in ’94 (the 2nd-highest rate ever), the HR% has stayed historically high, averaging 2.72%, without much variation — a high of 2.99% and a low of 2.46%.
That middle period of 1963-93 is 31 years, during which the HR%, despite some variation, averaged 2.05%, well below the high era of 1955-62 (2.37%). And that’s despite the AL using the DH for 21 of the 31 years.
So I don’t really see one long gradual increase from Ruth to now. Thirty years seems too long to be a blip. And that’s why I think the 1994-2012 increase of 15% over 1955-62 is significant.
John – One of the things I appreciate about you is that you never let me get away with sloppy explanations. We may have had several spirited disagreements on HHS but at the end I always know that my thinking has advanced on the issue because of you holding my feet to the fire. So let me try again….
While it’s true that there isn’t a straight increase in the home-run rate post-deadball era, looking at raw home run rates leaves a lot to be desired. Baseball, of course, is a quite unique sport and one of the things that makes it unique is that ballparks are of different and changing dimensions and sizes. So to really know whether home runs have increased or decreased over a given time period, you really have to control for all the extraneous factors that affect home run rates (ballpark size/dimension being just one of those). Perhaps someone’s done that but I really have no idea.
So in the end, when someone says that there was an x% increase in home runs during the steroid era that may be true in the raw sense but if we were to control for other important factors, perhaps the “true” increase was 5%. Or perhaps it was 30%. Who knows?
Ed @7 — And among the things I appreciate about you are (a) you aren’t insulted if I’m a bit argumentative, and (b) you follow up.
To your point, yes, I was thinking about factors in the lower HR rate from 1963 into the early ’90s, and besides the enlarged strike zone and raised mounds of the ’60s, there were some new ballparks in the late ’60s/early ’70s, and I think most were less HR-friendly than what they replaced.
And I agree that, in the broad view of baseball history since the Ruth revolution, HRs have trended upward. And if we could quantify all the external factors, maybe the graph would show a steady rise. But somehow, I still feel that the last 20 years or so could be a quantum leap.
Thanks John. And you could certainly be right about the quantum leap. But I think we’ve already agreed with one another that any increase during the steroid era wasn’t solely due to steroids. There was a lot going on in that time period.
I’d like to see some current MLB teams specialize in singles. Oh wait, here. The Giants had the most singles last year with 1,048. The 2012 A’s were the worst with 821 singles.
For 2012, singles were hit the most in the first inning and in the sixth inning.
1 3278
2 3024
3 3136
4 3190
5 3185
6 3278
7 3100
8 3007
9 2187
10+ 556
Here are the statistics for doubles:
1 1012
2 932
3 947
4 972
5 981
6 926
7 886
8 887
9 584
10+ 134
And home runs:
1 601
2 546
3 524
4 668
5 573
6 596
7 496
8 481
9 378
10+ 71
When I saw the rather dramatic drop-off in singles from the 1st inning to the 2nd inning, I expected that it would be accompanied by a commensurate increase in extra-base hits; my thinking was that the decrease in singles in the 2nd inning was due to 4- and 5-hitters hitting a greater proportion of runs in that inning. However, all types of hits (I excluded triples, since there are so few of them) are abundant in the 1st and scarce in the 2nd, which can mean there are not very many 1st innings in which teams fail to send their 4th batter to the plate, which means batting 4-5-6 in the 2nd is fairly uncommon. It also seems to indicate that teams which have crappy 1-2-3 hitters also have crappy 4-5-6 hitters, which sounds like common sense but I could imagine there are some exceptions. Wait, hold on guys, the 2006 Giants are on the phone…
Home runs peak in the 4th inning, which once again makes sense as this is probably the most common inning for 3-4-5 or 4-5-6 power combos to make their appearances. Then, singles and homers – but not really doubles – are both again high in the 6th, as starting pitchers tire and make their third passes through lineups. Finally, not surprisingly, hits in general decline as progressively better relief pitchers are introduced into the game.
*4- and 5-hitters hitting a greater proportion of extra-base hits
More questions than answers here. Focusing on the last 40 years, the largest change is the increase in doubles as a percentage of hits. But why? Smaller ballparks go a long way toward explaining the increase in homeruns and the decrease in triples, but has ballpark size also had a direct effect on doubles? Can the DH explain an increase in doubles and complementary decrease in singles? Has there been a consistent change in defensive effectiveness, perhaps some combination better positioning and shallower outfield play, that has reduced production of singles? If so, is the increase in doubles just what’s left, given the constraint that all four classes of hits need to sum to 100%?
Speaking of doubles … A while ago, I ran some Excel graphs plotting annual Runs per Game against the percentage of PAs that resulted in Hits, Doubles, Triples, and HRs, since 1901.
To my surprise, the best correlation was with Doubles. It tracked R/G in both the direction and the scale of the change, much better than HRs. Up through WWII, both Hits and Doubles tracked very close to R/G, but since the war Doubles have had a closer tie.
Might be a good topic for a post.
I’d think this is true because doubles have a much bigger impact on runs scored than singles and are much more common than triples or homers.
I would hazard to say that smaller ballparks explain not only more home runs (balls flying over the fences) but also a change in the double/triple ratio. Early baseball stadiums had sick dimensions (Griffith Stadium and Crosley Field both had 400+ foot measurements down the line and Shibe Park boasted 509 feet to dead center. Old Yankee Stadium was 457 in the left field power alley. To get a triple in the modern game, a player needs to be (a) lightning fast and running hard out of the box or (b) the beneficiary of a lucky carom where a ball gets away from an outfielder. Back then, just hitting a line drive that split the outfielders would get you at least a triple. Now these hits more often than not yield two bases for the batter.
The distance to left-center in Yankee Stadium in 1923 when it was built was 500 feet. It was reduced to 457 feet in 1937 when the bleachers were rebuilt.
Some of the old ballparks had long distances to encourage inside-the-park homers.
Early baseball had what to us, are ridiculously deep outfield dimensions, because the fences’ purpose was mainly to keep freeloaders from entering the park, and not to set HR dimensions.
Over-the-fence HRs were so infrequent pre-1920 that I don’t think that was a consideration when outfield dimensions were set. Often the fences just conformed to the dimensions of the plot of land the stadiam was located on.
Lawrence: Braves Field in particular was built with long distances because their owner was anxious to see lots of triples and inside-the-park homers. Until they moved the fences closer in the twenties almost every HR there was inside-the-park or a bounce homer.
Yep, Andrew Clem’s outstanding stadium diagram website claims deep right-center at the old Braves Field was over 520 feet from home plate. In 1928, however, bleachers were added and the the field slightly shifted, leading to dramatically outfield distances.
http://andrewclem.com/Baseball/BravesField.html#diag
In 1927, the last year before the field was altered, the Braves hit 61 triples (33/28 home/away) and 37 home runs (only 5 at home all year). The first year under the new smaller dimensions saw triples fall to 41 (home triples fell to 24) and round-trippers increased to 52 (24/28).
I do also wonder how much of this is due to the approach hitters take at the plate. With teams willing to accept strikeouts (far more than they should IMO), hitters don’t want to or have to try to choke up or slap the ball over the infield any more. When most teams have at least 5 or 6 regulars who have some adequate power it’s less important to try to string together hits.
Also there may be some impact on lighter bats/larger players/increased bat speed. Finally I also believe (could be mistaken) that when a hitter does square up with good contact that the ball will generally travel a bit further. With more pitchers, especially all the relievers nowdays, throwing hard, that may make a very minor difference.
I think it’s just a confluence of larger players, different plate strategy to trade BA for OBP/SLG, smaller park dimensions cutting down on triples but possibly adding to ground-rule or “off-the-wall” doubles, etc. Seems hard to believe it can go down too much further.
I love 1987. Not only did I graduate from high school (unrelated I am sure), but here is another intersting bit of data. The HR spike Andy mentioned is not a surprise, but the fact that singles spike down and doubles remained constant in 1987 thrills me. I am not sure if it is explainable (definitely not by me).
Pingback: Why aren't there more triples in baseball? - Dear Sports Fan