
“The less often the ball is in play, the more likely a no-hitter becomes.”
Tom Verducci wrote that in a June 2012 Sports Illustrated column titled, “Flurry of no-hitters and perfect games reflect changes in baseball.” You’ve probably heard the same claim elsewhere.
It sounds good in theory, and it may hold for individual games. But on a league-wide basis, it’s not supported by results in the current era, once you look beyond a very small sample. The high-strikeout era as a whole has actually seen a decline in no-hitters, compared to prior rates.
_______________
Mr. Verducci’s column ran right after Matt Cain’s perfect game, the fifth no-hitter in less than half a season (including Seattle’s teamwork job). He focused on a very small period, from 2010 through mid-June 2012, and showed a rate of 1 no-hitter per 414 games. (He counted each matchup as one game.) Then he ominously compared that to the 1901-2009 average of 1 per 794 games, and more ominously to the 1967-69 rate of 1 per 345 games. (Uh-oh, look we’re we’re going….)
Reaction to last year’s flurry was inevitable, and Verducci was not the only one to sound an alarm. But such a small sample maximizes the effect of random distribution, as you can see in the yearly raw numbers. Easy example: There was one no-hitter in 1988-89 combined, then 14 over the next two years. You can’t expect to show anything about no-hitters in just a few years, because they are so rare. A small window shows many anomalies like these:
- 1951 had the highest individual no-hit rate in the live-ball era, despite a fairly low K rate (9.7%). Then the K rate soared in 1952-55, while the no-hit rate plunged.
- In 1973 there were 5 no-hitters, the 8th-highest no-hit rate in the live-ball era, despite the lowest overall K rate since 1961. Four of those no-hitters came in the league that had just introduced the DH, and so had the much lower K rate.
Such small samples are meaningless.
In almost a year since Verducci’s column (over 4,000 team-games), we’ve seen just 2 more no-hitters, a very normal rate. We’ve had none yet this year, despite the highest K rate ever. So the individual rate for 2010-present is down from his cited rate of 1/414 games to 1/571 games. But non-events rarely get noticed.
I’m not suggesting that there’s no connection between strikeouts and no-hitters. Obviously, no-hit pitchers are generally strikeout leaders, and especially those with more than one no-no — Ryan, Koufax, Feller, Bunning, Randy Johnson, Verlander, etc.
I only mean to show two things:
(1) Despite the 2010-12 flurry, the current high-strikeout era has actually seen a low rate of no-hitters, compared to historic norms.
(2) A correlation of K rates and no-hit rates can only be seen over a period of many years, and the correlation seems broken during the last 20 to 30 years. For just a small group of years, no-hitters are fundamentally more random than they are predicted by K rates. Their raw numbers are so small that the rate for even a 20-year period can be strongly affected by outliers like Nolan Ryan (4 in a 3-year span) and Sandy Koufax (4 in 4 years).
_______________
Quick notes on my methods:
- The period studied is the live-ball era, i.e., 1920-2012. The current season is excluded.
- I included combined no-hitters, to remove the effect of variance in complete-game rates. In the graphs, the bars for individual and total no-hitters are overlaid, so that any combined no-hitters will appear as a darker extension of the individual bar.
- When I speak of a pitcher game, it means his entire stay in the game. I would have preferred to ignore MLB’s restrictive definition of “no-hitter” and include all games where the starter did not allow a hit for at least 9 innings, regardless of what happened afterwards. However, I can’t get those from the Play Index. For what it’s worth, one source lists 6 such games during the study period: 1934 (Bobo Newsom), 1956 (Johnny Klippstein), 1959 (Harvey Haddix), 1965 (Jim Maloney), 1991 (Mark Gardner) and 1995 (Pedro Martinez). I did include the one non-complete game wherein the starter threw 9 no-hit innings and then left. (Francisco Cordova, this one‘s for you.)
- I express no-hit rates per 10,000 team-games; each game played between two teams counts as two team-games. Strikeout rates (or K rates) are a percentage of plate appearances.
_______________
Now vs. Then
The first thing I wanted to see was how our current era of very high K rates compares to previous norms, in terms of no-hit rates. If there is a strong, direct correlation between K rates and no-hitters, we would expect a high rate of no-hitters in this era.
But how should we define this era? I see two possible starting points:
(1) 1986: In 1986, the K rate jumped from 14.0% to 15.4% — a large one-year change, and a K rate not seen since 1968 — and since then it has never dipped below 14.7%.
So here are the rates of no-hitters per 10,000 team games, for 1986-2012 and before:
- 1986-2012: 4.8 individual (5.2 total); 16.6% K rate for the period
- 1920-1985: 6.4 individual (6.6 total); 11.5% K rate
A hard right to the theory’s chin! The no-hit rate for this 27-year period is significantly lower than for the previous 66 years of the live-ball era.
As an aside, the period just before this one, 1969-85, had a much higher no-hit rate, 6.5 (6.8), very close to the previous norm, but with just a 13.5% K rate. It also had 5 no-hitters by Nolan Ryan. Even for a long period, outliers have a large impact.
(2) 1995: The period 1995-2012 consists of the 18 highest season K rates in MLB history. (And 2013 looks to be another new record.) No-hitter rates for 1995-2012, and before:
- 1995-2012: 4.4 individual (4.7 total); 17.2% K rate
- 1920-1994: 6.1 individual (6.3 total); 12.1% K rate
And a left to the body! Not only is the no-hit rate for 1995-2012 much lower than the previous norm, despite an unprecedented K rate, it’s also lower than for 1986-2012, our alternate definition of the “high-K era.”
Slicing the current era any thinner makes the samples too small to be relevant. Yes, the no-hit rate for 2010-12 was very high, 10.3 per 10,000 team-games — not as high as 1990-92 (11.9) or even 1969-71 (11.1), but still eye-catching. But that eye-catching rate actually underlines my point: Those years stand out starkly against the rest of the high-K era. No other 3-year span in this era reached 7.0, and if you lop off 2010-12, the average was 3.5 for 1995-2009, 4.7 for 1986-2009.
And in terms of K rates, why start a study period in 2010? The K rate has climbed steadily every year starting with 2006. Year by year: 16.8% strikeouts in 2006 (1 no-hitter); 17.1% in 2007 (3 no-hitters); 17.5% in 2008 (2 no-hitters); 18.0% in 2009 (2 no-hitters), 18.5% in 2010 (5 no-hitters). What is the basis for starting with 2010?
I suppose it’s conceivable that there’s a K-rate threshold above which a small rise would have an exponential effect on no-hit rates. But I haven’t seen that argument made.
_______________
But let’s not count out the correlation theory just yet. Let’s look at some graphs of no-hitter rates and strikeout rates over time, to see if we can spot a trend with the naked eye.
Our first graph shows annual rates of no-hitters (the blue bars, graphed against the left axis) and strikeouts (the red line, graphed against the right axis). Again, the no-hit rate is expressed per 10,000 team-games, while the SO% is a percentage of all plate appearances. Individual and total no-hitters are overlaid.
Rates of No-Hitters and Strikeouts by Year, 1920-2012
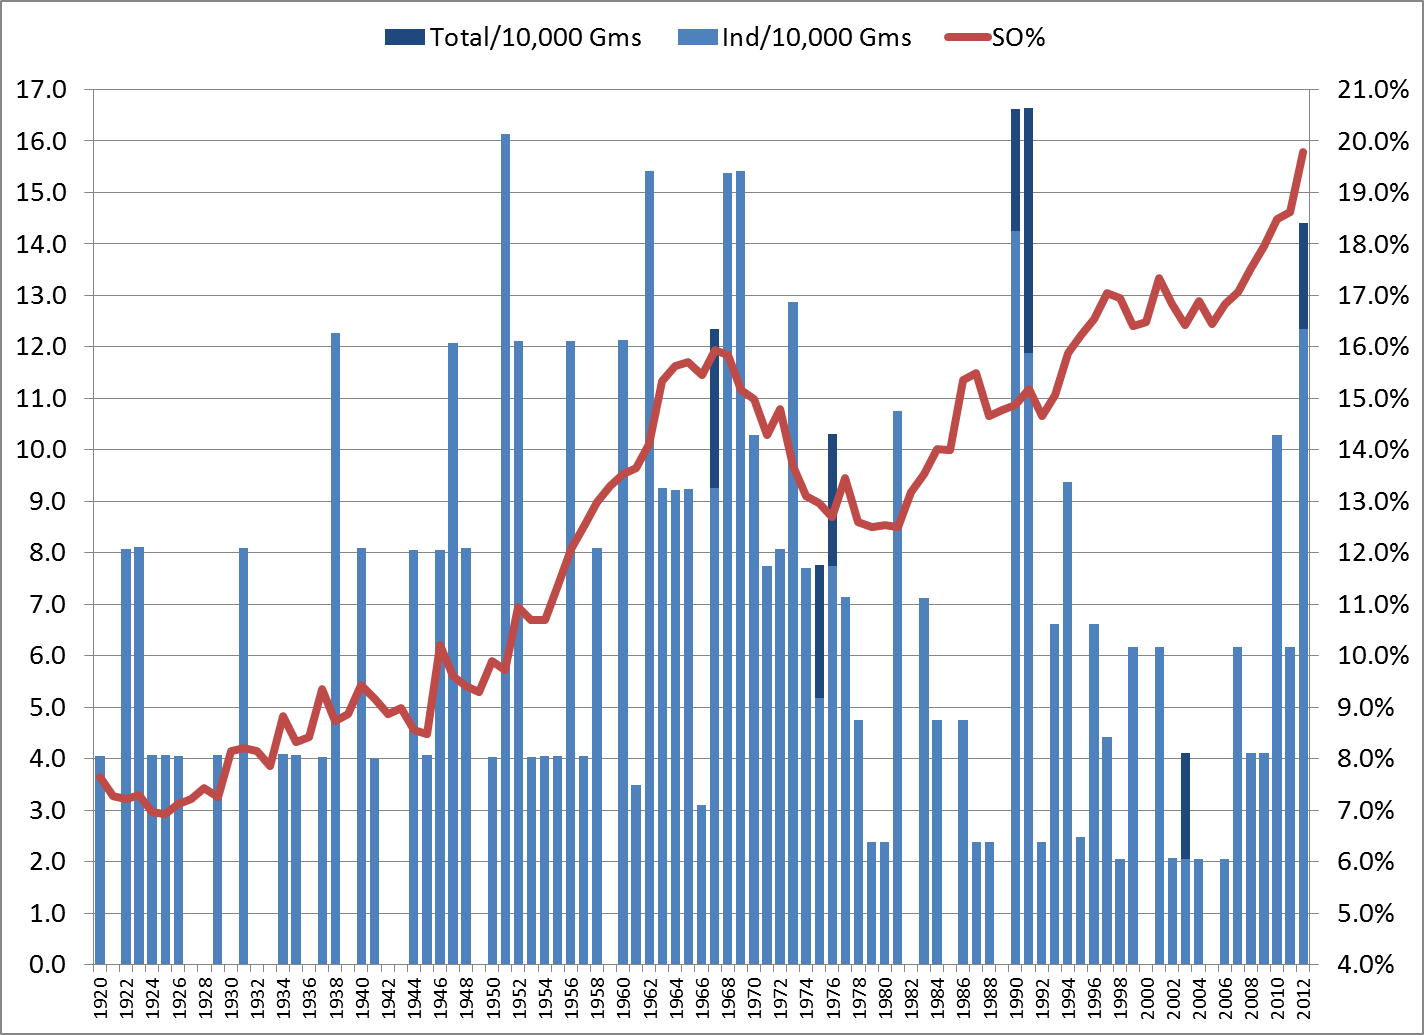
Yikes, what a mess! The only point of this graph was to show that you really can’t learn anything from a couple of seasons; there’s too much annual fluctuation.
But now let’s take the same data in rolling 5-year averages. In other words, the 2012 data points are actually the averages for 2008-12, and so forth. (Except that no pre-1920 data was used, so the points for 1920-23 represent the averages from 1920 through that year.)
Rates of No-Hitters and Strikeouts, Rolling 5-Year Average, 1920-2012
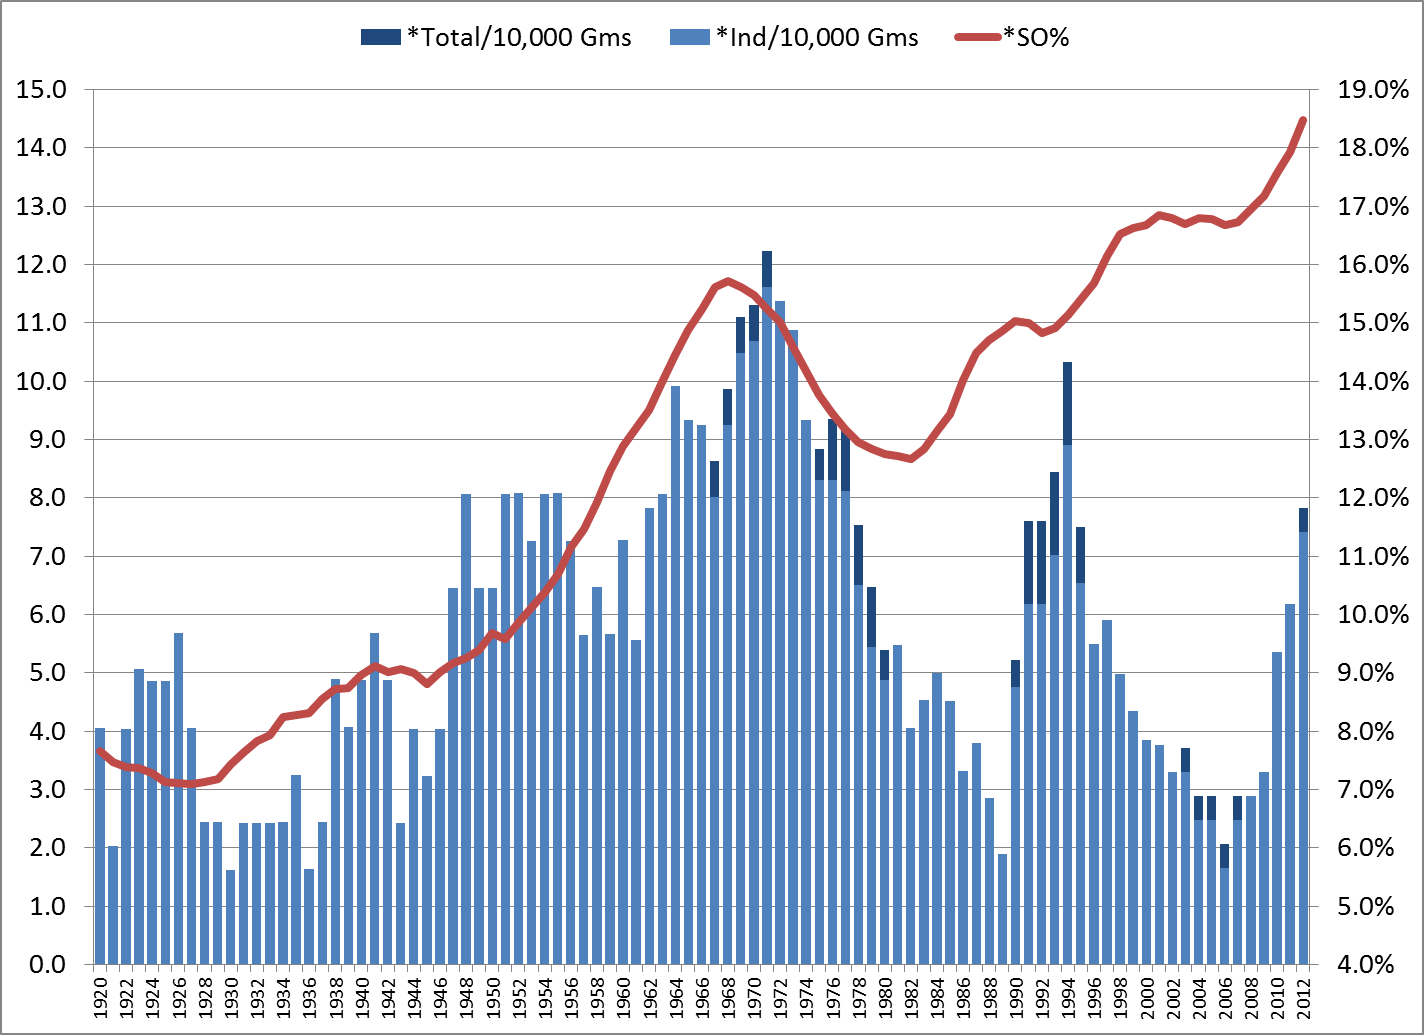
Now, that’s a little more interesting. Starting from the left side, there does seem to be some correlation. But it starts to loosen up in the 1980s, and completely breaks down in the ’90s. Very recent trends might indicate a return to correlation, but it’s too soon to say. And of course, we’ve yet to see a no-hitter in 2013.
_______________
Grouping Like with Like
The next method is to forget about time periods and just group the yearly data by K rates. I sorted the seasons by SO%, then divided them into three equal groups of 31 seasons: Low-K (averaging 8.3% strikeouts), Medium-K (13.2%) and High-K (16.6%). The no-hitter rates, per 10,000 team games:
- Low-K: 4.3 individual (4.3 total); 8.3% K rate
- Medium-K: 6.1 individual (6.3 total); 13.2% K rate
- High-K: 6.0 individual (6.4 total); 16.6% K rate
Conflicting pictures here. The difference between the Low-K and Medium-K groups suggests a correlation. But the no-hit rate is about the same for the Medium-K and High-K groups, despite a sizable difference in K rates (26% more in the High-K group) and a large number of seasons.
Now let’s break it down a little finer.
I formed five groups of 18 or 19 seasons: Min-K (averaging 7.7% strikeouts), Low-K (9.8%), Medium-K (13.2%), High-K (15.2%) and Max-K (17.2%, consisting of 1995-2012). The no-hitter rates:
- Min-K: 3.4 individual (3.4 total); 7.7% K rate
- Low-K: 6.2 individual (6.2 total); 9.8% K rate
- Medium-K: 5.9 individual (6.2 total); 13.2% K rate
- High-K: 7.8 individual (8.2 total); 15.2% K rate
- Max-K: 4.4 individual (4.7 total); 17.2% K rate
The first four groups suggest a pattern. But what happened to Max? Again, those are the 18 highest season K rates in MLB history. Yet the no-hit rate for those years is far, far less than for the next-closest K group. How could you possibly fit that into a theory that no-hitters and overall strikeout rates remain directly correlated?
_______________
You might see where I’m going, but this is the end of Part 1. In Part 2, I’ll discuss the unstated assumption behind the correlation theory, and why that assumption no longer holds true.
_______________
Postscript
Besides small sample sizes, Mr. Verducci made an odd choice in citing the no-hit rate for the late ’60s. If you read the piece, you might have noticed the years that he labeled as the “late-1960s doldrums.” He chose 1967-69 as a point of no-hit comparison to 2010-12 — even though he’d already noted that 1969 was profoundly different from the prior years: “hitting was so bad they … lowered the mound (1969)….”
To further state the obvious: From 1968 to ’69, the K rate fell from 15.8% to 15.1% (the lowest rate since 1962), while batting average rose from .237 to .248. The number of plate appearances per team-game rose by 2.4%, from 37.2 to 38.1, the largest absolute change since 1904. On top of all that, there was an expansion from 20 to 24 teams.
So why lump together 1969 and 1967-68? I surely don’t know, but it’s hard to miss the fact that 1969 had 6 individual no-hitters, tying the live-ball record, while 1967-68 totaled 8 individual no-hitters, and 1966 had just 1. By using 1967-69, he showed a no-hit rate similar to 2010-12, but still higher than 2010-12 — sort of implying that we’re headed that way. Had he used the more reasonably connected 1966-68, it would have shown that the 2010-12 rate was already much higher than “the late-’60s doldrums,” which might have raised questions about small sample sizes. Even those folks who mistakenly think we’re in a sub-normal scoring context know that we’re nowhere near 1968.
If that 1969 data point meant anything, it would be a direct counterpoint to Verducci’s thesis. But one year, or three years, don’t mean anything when you’re studying something as rare as no-hitters.