
On September 1st, Houston’s rookie starter Brett Oberholtzer shut out the Mariners 2-0 as the Astros became the last team to record a complete game in the 2013 season. This is the first time in 3 years that every team has recorded a complete game.
While it’s certainly not news that complete games have been on a seemingly never-ending decline, I thought it would be interesting to take a statistical look at some of the resulting impacts on the game.
More on the complete game and the ever-changing dynamics of pitching after the jump.
I mentioned this was the first time in 3 years that every team has had a complete game. The nadir of having at least one team go an entire season without recording a complete game was first reached in 2007. So, there’s only one way to go from here. Here’s a chart showing the progressive decline in the fewest number of team shutouts through 2012.
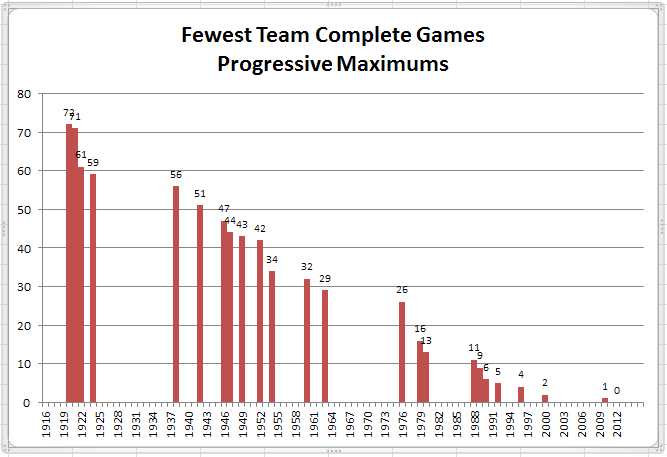
Tips to reading this chart:
- each bar shows the last time that the team with the fewest complete games had the number indicated
- to the right of every bar shown are only lower numbers
- between any two bars shown, the numbers are less than or equal to the bar on the right
So, at the low end of scale, the decline in complete games has been a consistent linear progression. What this trend suggests, of course, is shorter starts and more relief appearances and innings. But, does it work?
Short answer would appear to be Yes. Hitters have had progressively more difficulty producing runs in late innings, as those innings have increasingly been pitched primarily by “fresh” arms (or fresher than the starting pitcher, at any rate). That is borne out by the chart below showing, by season, the percentage of total runs that are scored in innings 7-9.
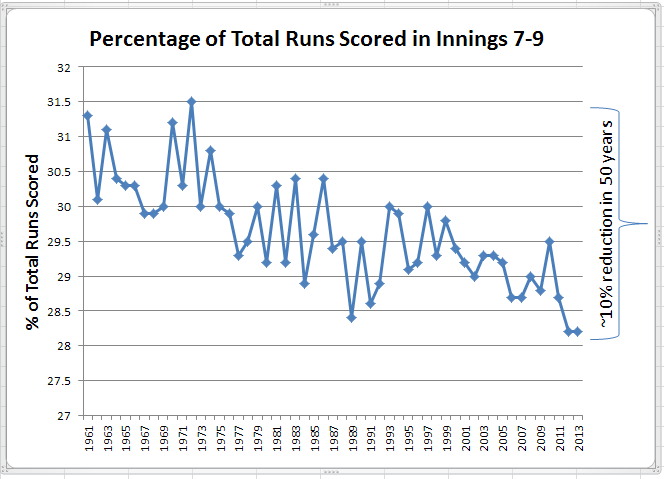
But, aside from fresher arms, is there anything else about late inning pitching that would point to a tougher run-scoring environment?
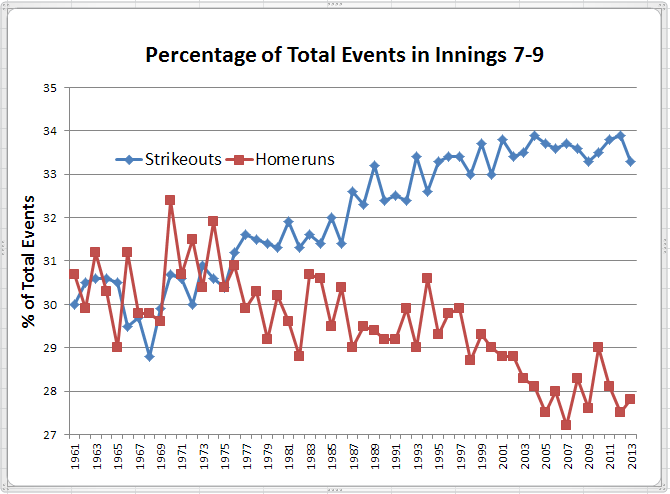
The chart below illustrates that the 10% reduction in the proportion of runs scored in innings 7-9 has been accompanied by a similar reduction in home run proportion in those innings, as well as by a similar increase in strikeout proportion. So, no real surprise that run scoring in late innings has become less frequent relative to other innings.
But, of course, every team has followed the same trend towards earlier and more frequent use of relievers. So, has making it harder to score in later innings actually improved a team’s chances to win? The chart below indicates there has been some improvement in the ability to retain late inning leads, but it has been a pretty small improvement.
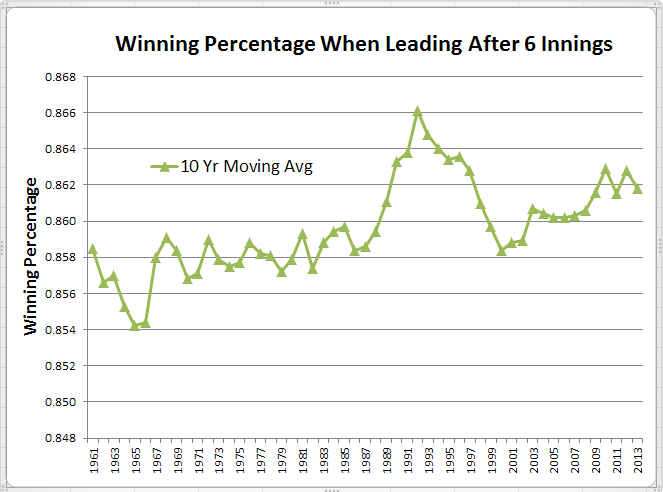
That improvement has been so small it would be difficult to see clearly just showing the winning percentages each year, so instead I am showing a moving 10-year average where the data point for each year is the average of that year and the 9 preceding years.
The improvement in that rolling 10-year winning percentage when leading after 6 innings is on the order of about 7 or 8 points, which is about 1.25 games out of 162. Not a lot but still important (just ask the Texas Rangers if one extra win might have made a difference for them this year).
What is curious, of course, is the break in the overall trend where the winning percentage shot up rapidly (relatively speaking) and then declined almost as rapidly to return to where that trend break had started. What might have caused that? I’ll return to that question further down.
The chart below is showing the change in starting pitcher usage, illustrating the downward trends in the percentage of innings pitched by starters, and of starter decisions.
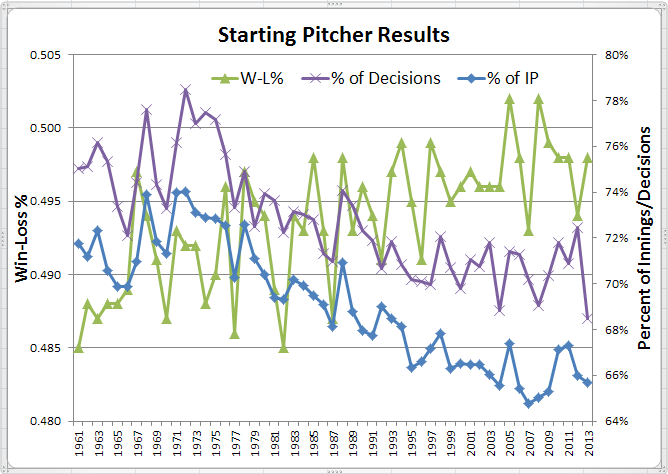 Coincident with the decrease in starter innings has been a steady improvement (albeit with a fair bit of whipsawing) in the W-L% for starters. Why would the starters’ winning percentage be improving?
What seems to have happened with the trend to relieving starters sooner and more often is that that has spared starters losses they might otherwise have experienced. Taking the starter out of the game with a lead means he can only win the game or have an ND. Ergo, fewer losses charged to the starter. But, of course, fewer losses charged to a starter means more charged to relievers as shown below.
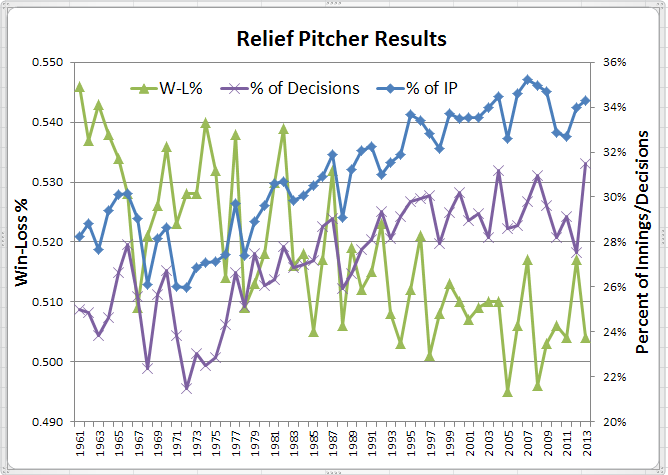
It may seem counter-intuitive at first, but relievers’ winning percentages used to be outstanding, frequently above .530 and sometimes even approaching .550. The reason for this was that in years past the move to the relief pitcher often came after the damage was done. The reliever was coming into a game trailing, so the only way he could lose the game is if his team came from behind and then he blew the lead after that. With the increase in relievers’ share of innings came an increased proportion of appearances with the lead or the score tied. That means more opportunities for a reliever to record a loss and, thus, a reduction in winning percentages.
Now back to the question about that trend break in the the ability to preserve late leads. What follows is merely an hypothesis. I welcome your feedback. Anyway, here goes.
The period when the winning percentage with a lead shot up quickly corresponds with the period in the chart above when the proportion of relievers’ innings shot up most quickly, namely from the late-1970s to the late-1980s. What type of relievers were getting most of those innings?
Back in the 1970s and 1980s, the pattern of reliever usage greatly favored a couple of relievers on each team who shouldered the bulk of the relief pitching duty, especially in game situations. And, when those relievers came in, it was with the intention of finishing the game, whether that took one, two or three innings, or possibly even longer. It was the age of the relief specialist as a fireman, rather than a closer. The difference is significant.
Moving into the 1990s, relievers’ innings are still going up. To the point that the workload is more than can be shouldered by just a couple of principal relievers. Thus, the dawn of specialization where you now have relief corps of 4 or 5 (or more) pitchers who are used on a regular basis with pre-defined roles (long, short, setup, close, loogy, etc.). That’s great, except the more relievers who are being used on a regular basis, the more innings are going to pitchers of a lesser skill level. It’s unavoidable – you can’t have 5 pitchers who are all as skillful as the one or two guys who used to carry the bulk of the relief workload. Thus, the quick decline in late inning lead preservation to levels of the mid-1970s.
And, what about today? In the last 15 to 20 years, that late inning lead preservation has started to inch its way back up even though the growth in the share of innings going to relievers has slowed (it’s still going up, just not as fast as before) and the proportion of relievers’ decisions has been basically flat. I think the contributing factor in recent years has been the loss of stigma associated with striking out; hitters are not embarrassed about it with the result that young arms are groomed solely for the purpose of throwing 15 or 20 pitches as hard as they possibly can with the expectation that they will routinely strike out a third to a half of the hitters they face. Take that many balls out of play and you are going to become more effective at preserving leads. Guaranteed.
So, is current pitcher usage the best strategy yet devised for maximizing winning chances? I don’t think so. To me, specialization has gone too far. Managers are using 3 or 4 pitchers to get out of a jam … in the 7th inning. When the starter is still at 95 pitches. Or, when a team is down a run or tied in the late innings, into the game comes a team’s 4th or 5th best reliever. How does that help your winning chances?
Every pitcher being in a comfort zone because he has a defined role is great. But, too much of a good thing isn’t so great. A couple of guys get on in the 6th, but the starter and the catcher tell the manager his stuff is still good? Then leave him in there, instead of going to your #4 reliever with his 5.73 ERA. Your 7th inning guy has just breezed through the inning in 10 pitches with really wicked stuff? Leave him in there, instead of going to your setup man just because it’s the 8th inning. There’s two out in the 8th, your setup man hasn’t been sharp, and the tying and go-ahead runs are on base? Bring in your closer to get that last out. I mean, this isn’t rocket science. Is it?
Anyway, enough of my ranting. Your turn.