
Alan Trammell‘s Hall of Fame support fell to 21% on this year’s ballot; in two years, he’ll join Lou Whitaker in veterans committee limbo. To channel my grief, I’ve been shaping some thoughts about them. This post is about peak WAR and career value patterns for a 2B/SS tandem.
The preference for high-peak players is one reason that Trammell and Whitaker are not in the Hall of Fame, despite career WAR totals and per-game rates that are above the median for HOFers at their positions. The Detroit duo was unusually consistent at a level just below the top rank, combining for 21 individual seasons of 4.1 to 6.7 WAR, but just one season above that.
High peaks are favored for their pennant impact, and I’m not here to challenge that. But thinking of Trammell and Whitaker as a unit — Trammaker, if I may — made me curious: Would the peak/pennant link hold true for pairs of outstanding teammates? If the members of a 2B/SS tandem each had the same career value as Trammaker, but a more normal high-low pattern, how would their combined value patterns compare?
A normal distribution of high and low years for a tandem should create some double-highs, a few double-lows, and more years that sort of balance out. Let’s see how that looks with some examples.
There aren’t enough actual pairs of long-term star teammates to study properly. So I formed three tandems out of Hall of Famers with WAR totals and rates similar to Trammaker. Career WAR stats:
- 2B Frankie Frisch —- 70.4 WAR … 30.5 per 1,000 G … Best 4 years avg. 7.6
SS Luke Appling —— 74.5 WAR … 30.8 per 1,000 G … Best 4 years avg. 6.9 - 2B Ryne Sandberg — 67.6 WAR … 31.2 per 1,000 G … Best 4 years avg. 7.6
SS Ozzie Smith ——- 76.5 WAR … 29.7 per 1,000 G … Best 4 years avg. 6.7 - 2B Roberto Alomar — 66.8 WAR … 28.1 per 1,000 G … Best 4 years avg. 7.1
SS Barry Larkin ——– 70.2 WAR … 32.2 per 1,000 G … Best 4 years avg. 6.6 - 2B Lou Whitaker —— 74.8 WAR … 31.3 per 1,000 G … Best 4 years avg. 6.1
SS Alan Trammell —- 70.3 WAR … 30.7 per 1,000 G … Best 4 years avg. 7.0
Each pair averaged 68.5-72.5 career WAR, and 30-31 WAR per 1,000 games.
Trammaker had an outstanding 16-year run together, so I took the best 16-year WAR span for each player. For each pair, I just lined up those blocks side-by-side, in chronological order, and summed the tandem’s WAR for the matched years. This method puts each tandem’s members fairly close in age, separated by one to three years. I adjusted the WAR for strike years but not for the 154-game schedule, a decision I’ll explain in the notes.
I looked at the averages in all sorts of ways, and settled on this simple presentation:
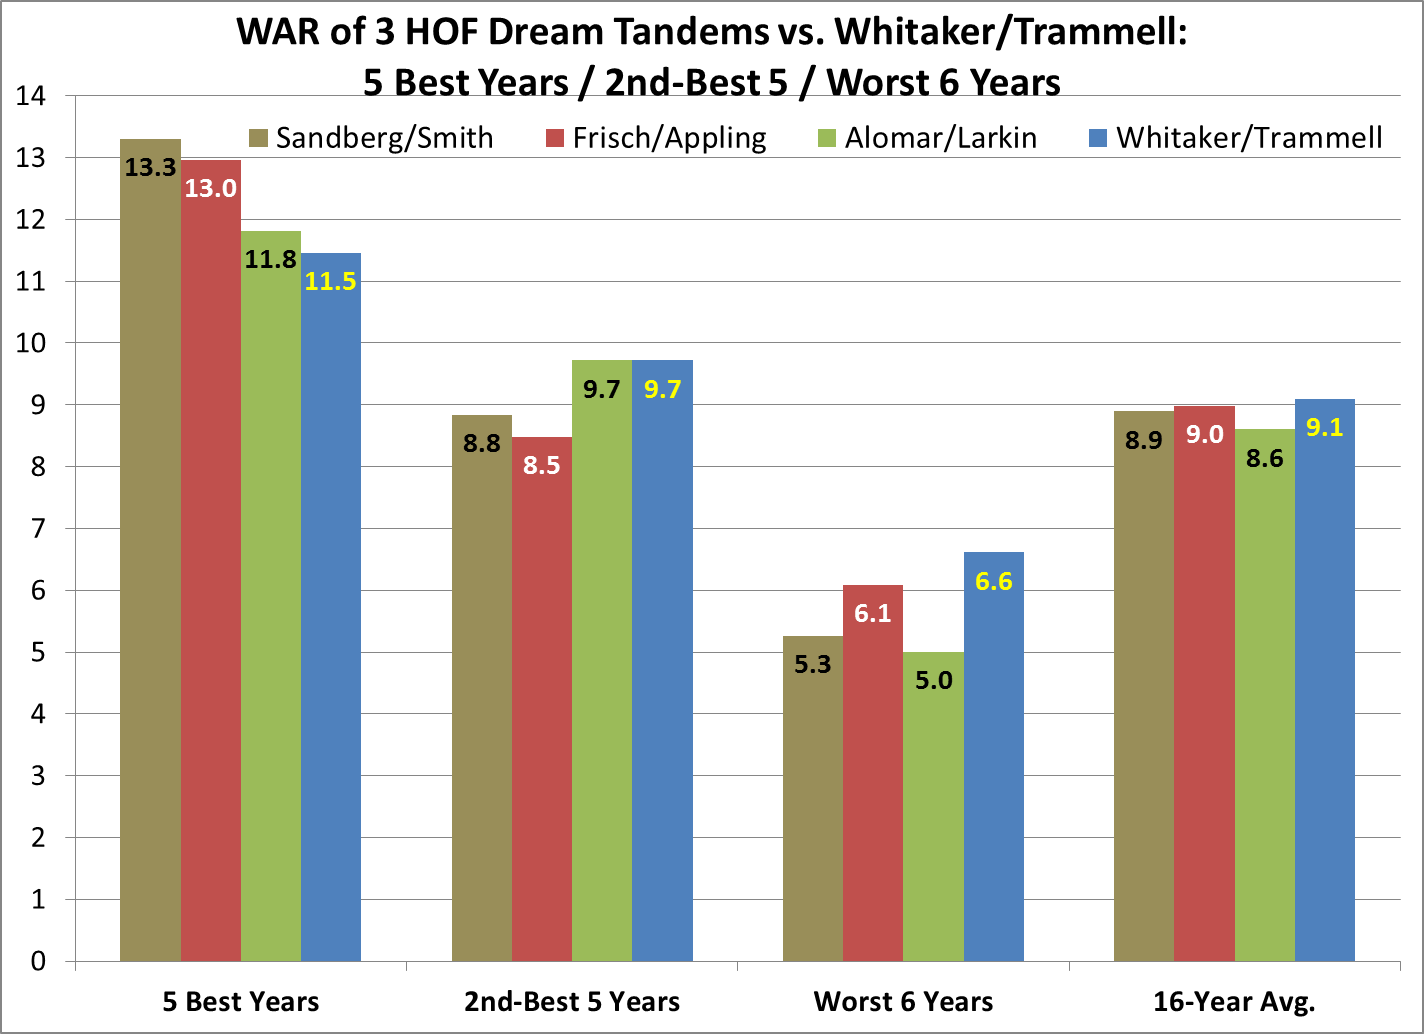
As expected, the HOF tandems all trump Trammaker in 5 Best Years, though the margin in one case is trivial. In 2nd-Best 5 and Worst 6 Years, Whitaker/Trammell are unsurpassed.
Rankings aren’t the point here, but … how would you rank them? I have Sandberg/Smith and Frisch/Appling ahead of the others, and very close to each other. I rate Whitaker/Trammell ahead of Alomar/Larkin, despite a small deficit in 5-best years.
For context, how many times from 1978-93 did an actual 2B/SS tandem besides Trammaker reach some of the levels on that chart?
- 13.0+ WAR (elite of the 5 Best Years) — 2 seasons
- 11.5+ WAR (Trammaker’s 5 Best Years) — 7 seasons
- 9.7+ WAR (Trammaker’s 2nd-Best 5 Years) — 14 seasons
Back to the value patterns. The next charts show the 16 years in chronological order; for a cleaner look at the curves, I’ll show them separately, first the 3 HOF tandems combined, then Whitaker/Trammell. This is more about the shape of the curves than the particular numbers; combining the HOF tandems smoothes the curve for a better sense of what is typical.
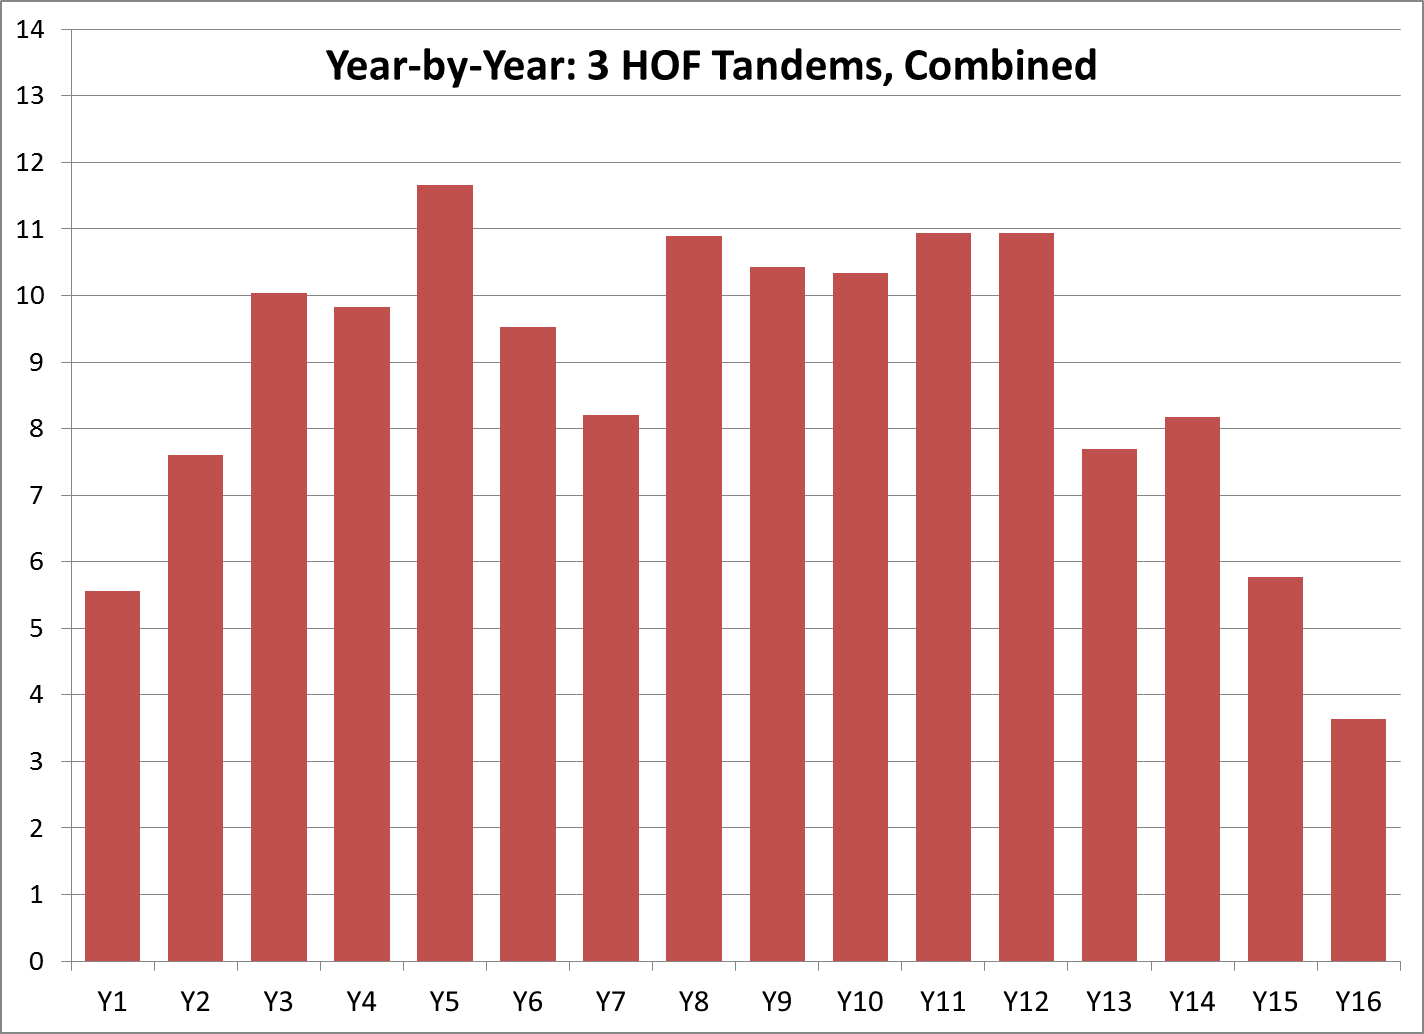
The combined HOF tandems show a pretty normal curve — a little flat in the middle, but otherwise typical. Now for Whitaker/Trammell:
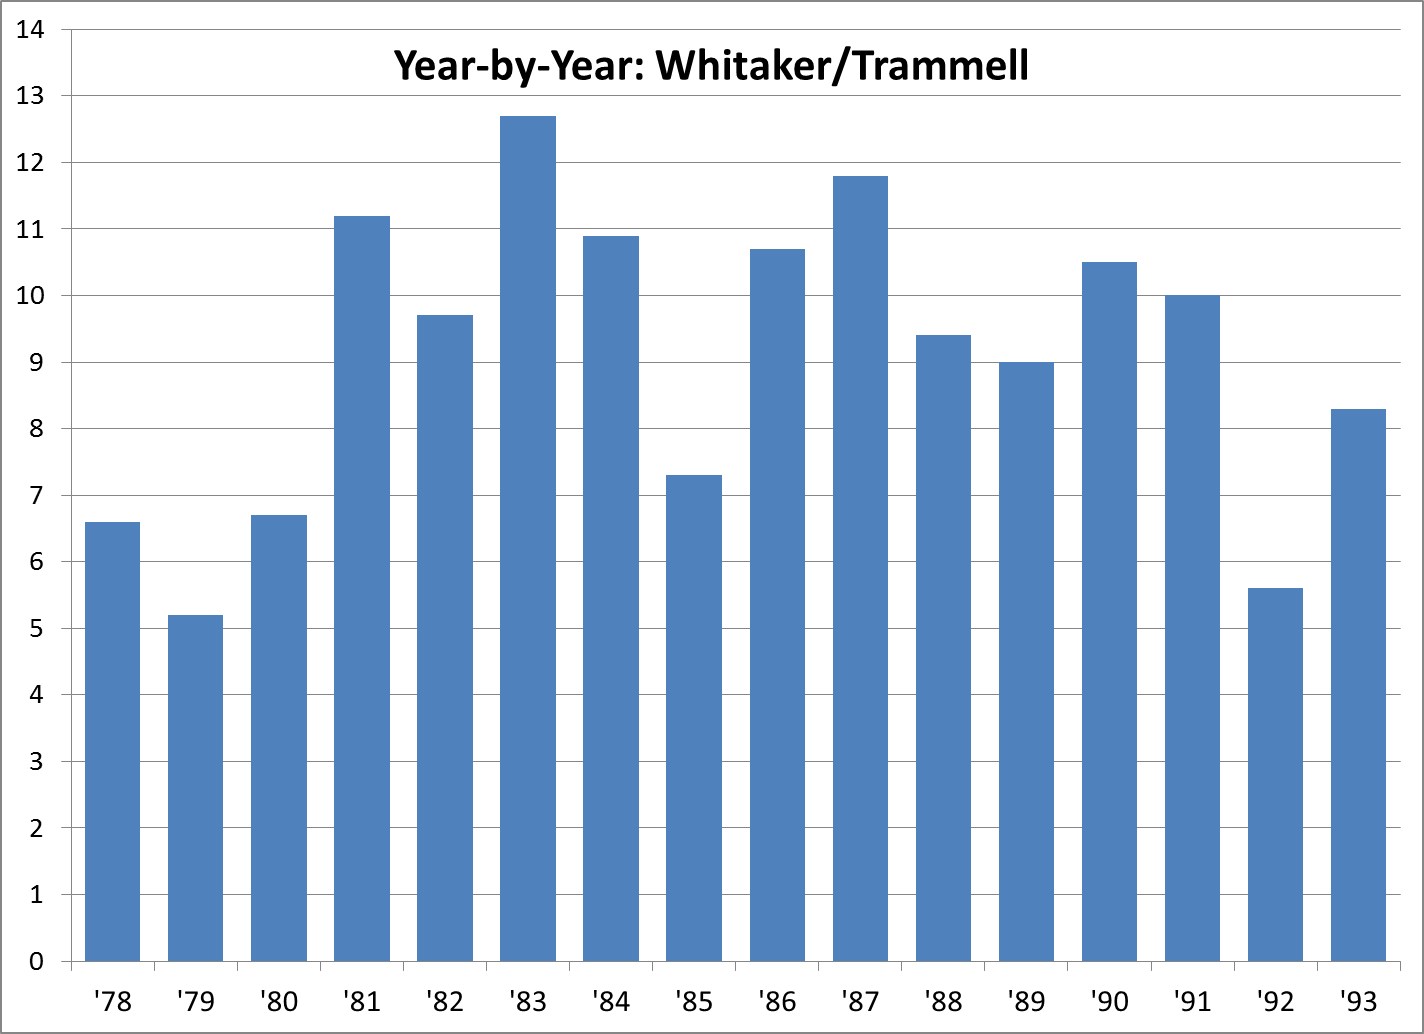
Trammaker peaked a little later, and declined more slowly. Comparing four-year quarters by percent of total:
- Q1 — 23% HOF, 20% Trammaker
- Q2 — 29% HOF, 28% Trammaker (halfway totals 52% and 48%)
- Q3 — 30% HOF, 28% Trammaker
- Q4 — 18% HOF, 24% Trammaker.
Now the 16 years in order of best WAR, for Whitaker/Trammell and for the HOF tandems combined:
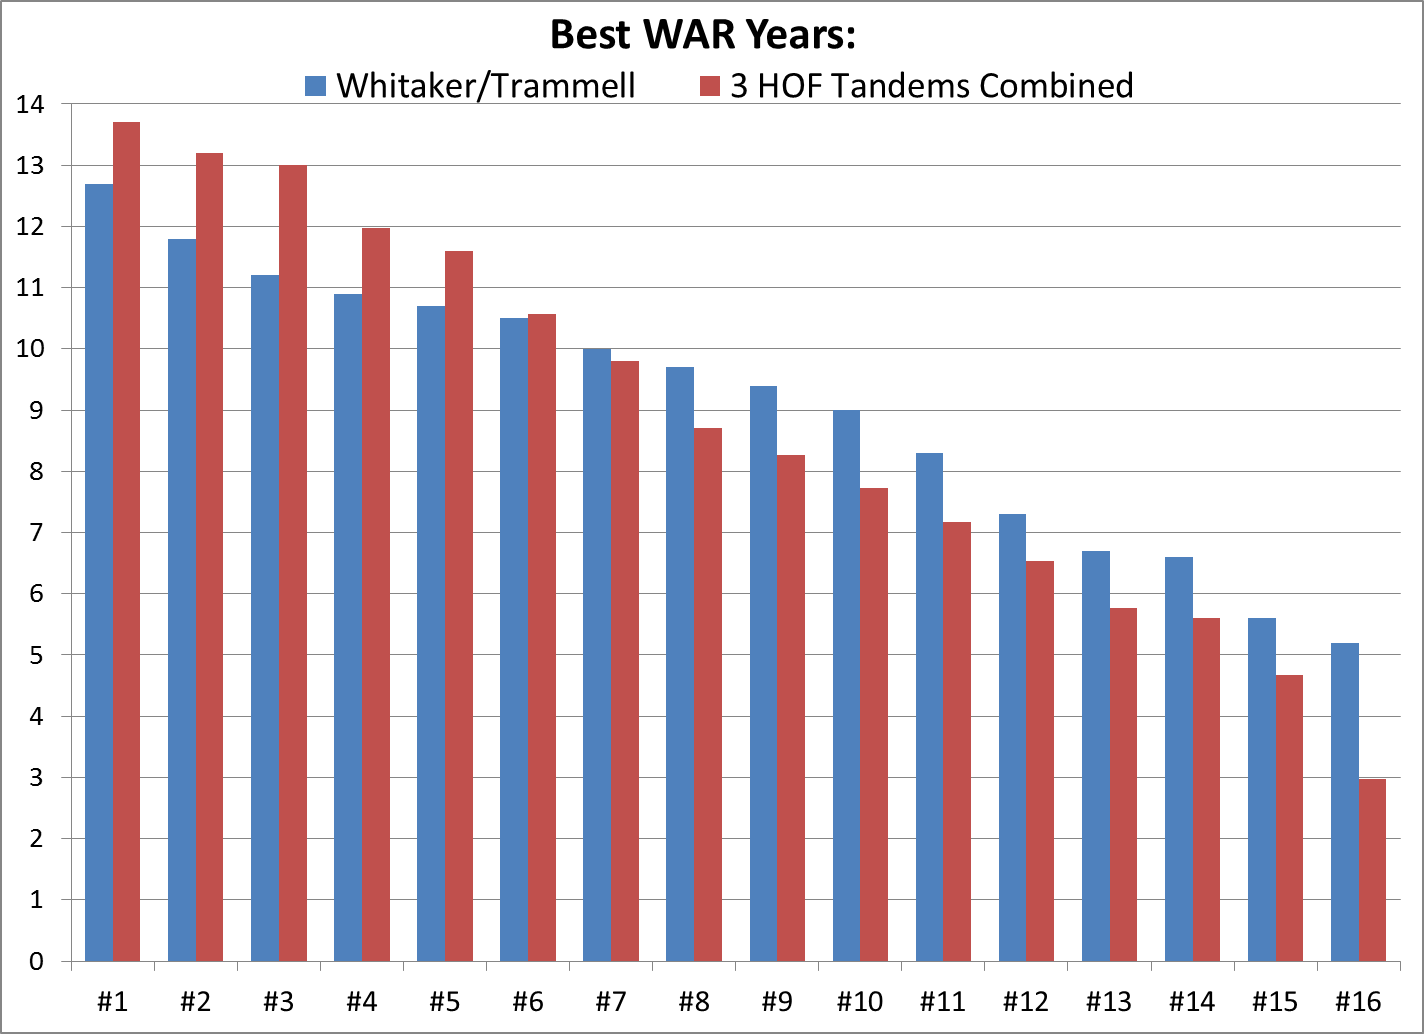
The HOF amalgam lead #1-5 by an average of 1.2 WAR (12.5-11.5). The 6th and 7th years are basically even. Whitaker/Trammell lead the 8th through 16th by an average of 1.1 WAR (7.5-6.4); by year 13, they go ahead in career WAR.
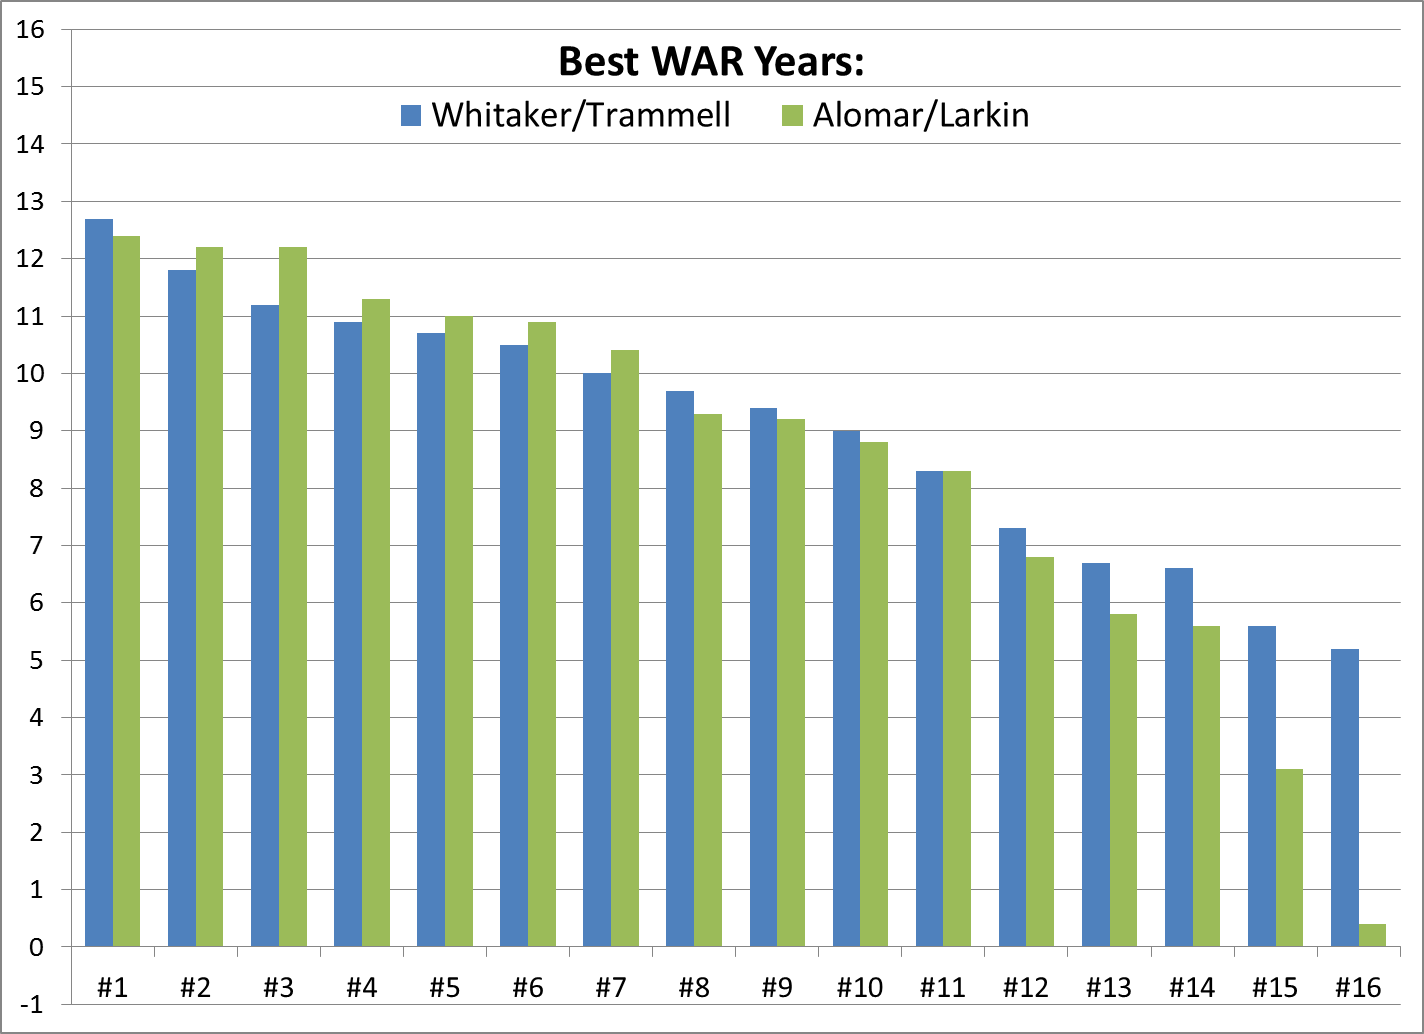
For completeness, the best-years charts for Whitaker/Trammell versus each HOF tandem individually:
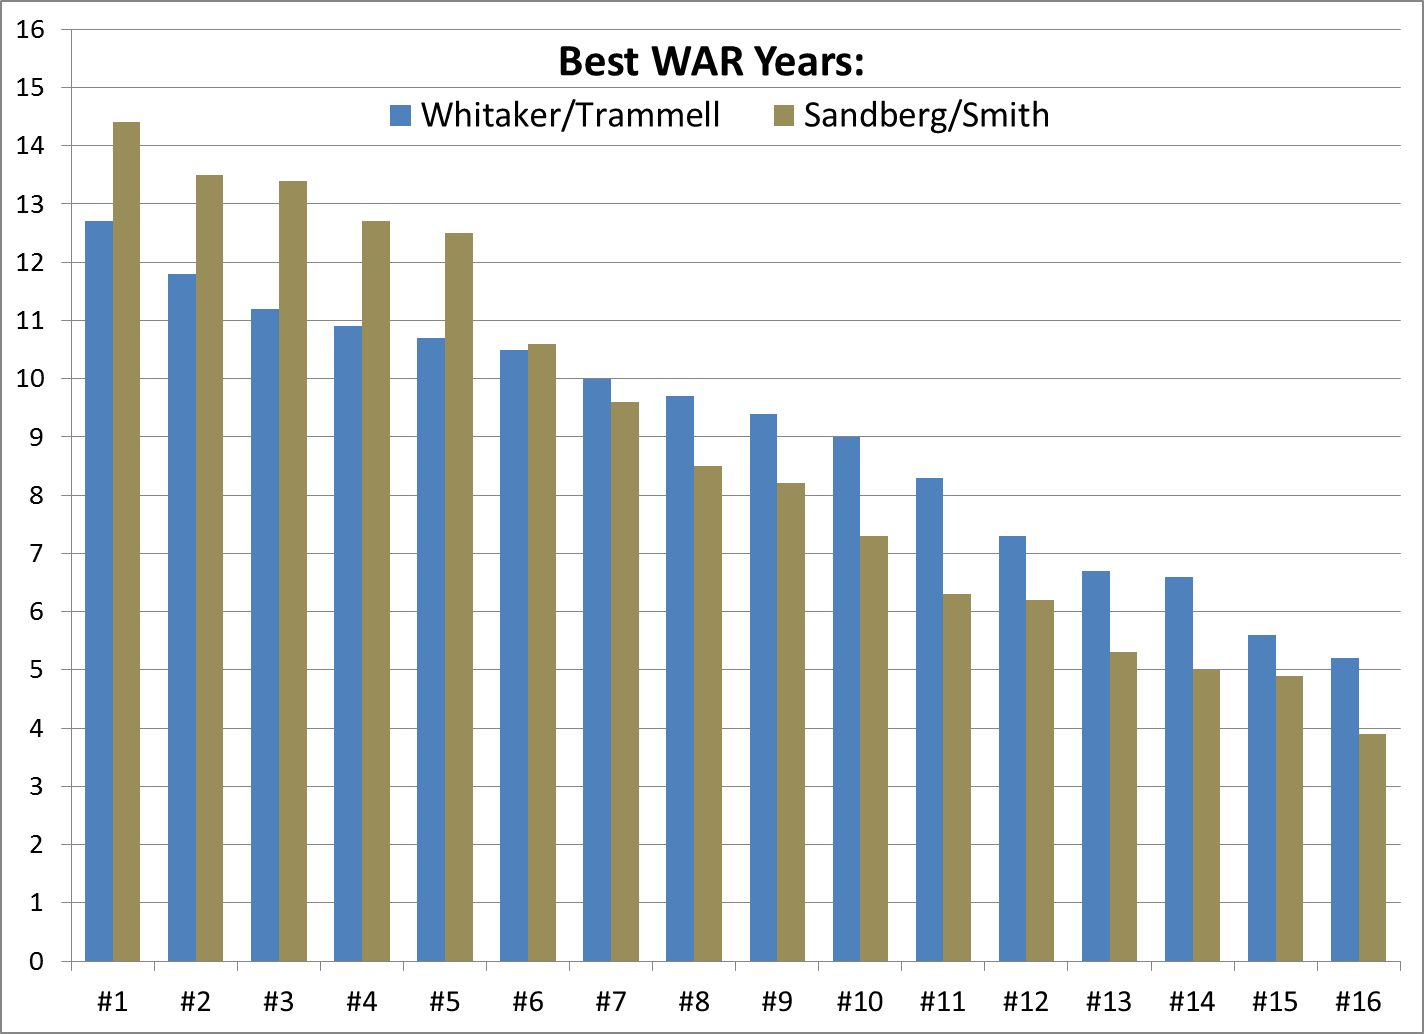
Sandberg/Smith lead handily for #1-5, by 1.8 WAR per year; #6 is virtually even; and Whitaker/Trammell lead #7-16 by 1.3 WAR per year.
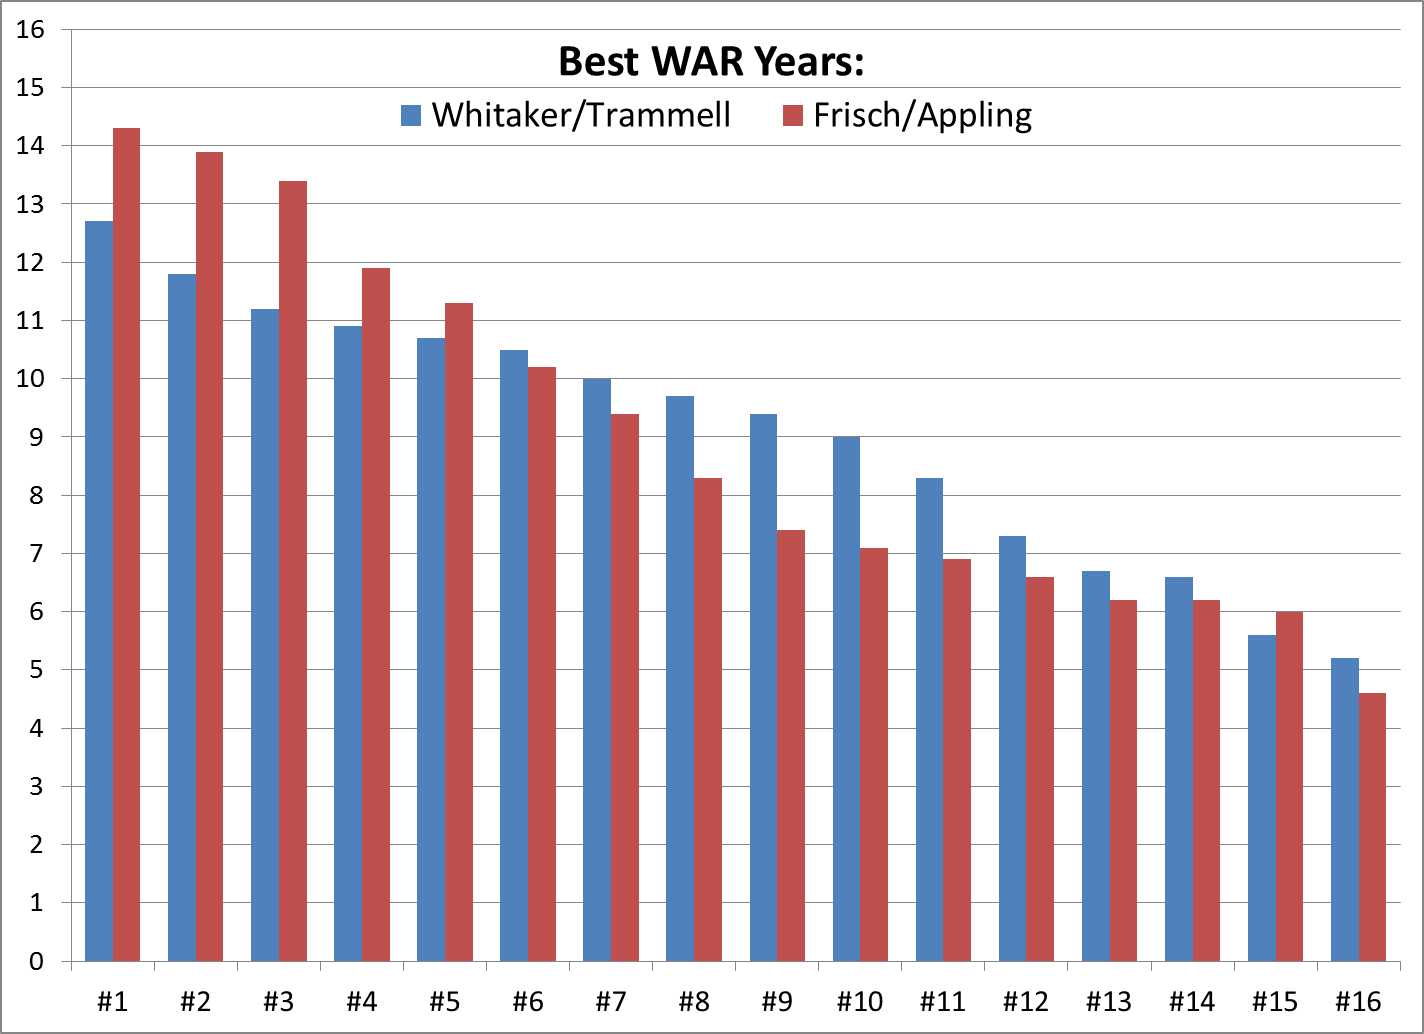
Frisch/Appling lead #1-5 by 1.5 WAR per year; #6 is about even; and Whitaker/Trammell lead all but one of #7-16, averaging +0.8 WAR in that span.
This one’s nip-and-tuck until the last two years.
In summary, the trade-off for the Whitaker/Trammell tandem value pattern, versus the more normal distributions of an equal amount of WAR for these Hall of Famers, was approximately:
- Best 5 Years: -1.2 WAR per year for the tandem combined
- 6th and 7th: Even
- 8th-16th: +1.1 WAR per year
How that affects the career assessments is open to debate.
__________
Notes:
- I didn’t adjust for the 154-game schedule, because Frisch/Appling already have the advantage of playing before integration, when replacement level was lower. The average player in that era was a bit further above replacement level; just compare the Wins Above Average for identical WARs between the two eras. Since we tend to conflate WAR and WAA, I think giving Frisch/Appling more WAR for the short schedule would distort our view of their value. Frisch and Trammell have virtually the same WAR totals and rates, but Trammell has almost 3% more WAA. Maybe I should have based this whole thing on WAA and not WAR, but WAA isn’t searchable.
- Not that it matters, but Alomar/Larkin and Sandberg/Smith were true contemporaries; their 16-year spans overlap by 14 and 12 years, respectively. Frisch/Appling overlap by just 4 seasons; I wanted a pre-expansion pair, and couldn’t find more overlap while staying close to the Trammaker WAR stats.
- I excluded Appling’s two service years from his 16-year block, but I kept Sandberg’s early-retirement year in his block, because that was a choice; plus, he only played 16 years, so the alternative was his negative-WAR first cup of coffee.
- The best-16-years selection included all of the players’ best years. The best years not included were 2.5 WAR (Whitaker) and 2.1 WAR.
__________
Off-Peak Years Can Still Be Good Years
The six HOFers sailed in for various reasons, including offensive context that made their raw stats seem more impressive. But a big reason was their higher peak value: they won MVP Awards, were All-Stars more often than Trammaker, and generally were viewed more as being “among the game’s best.”
Favoring high peaks may be broadly valid, but a blind spot is shown by reductio ad absurdum: A player who scored 5.5 WAR for 20 straight years might never come close to an MVP, but he’d wind up with a WAR total and rate very much like Joe Morgan and Rickey Henderson. Could such a man truly not belong in the Hall?
Trammell and Whitaker don’t approach that level. But their peaks are not far short of typical HOF caliber, and their off-peaks are both better and longer than most HOFers.
In a “best 10 years” average, Whitaker/Trammell trail the HOF tandems by 0.3 WAR (10.6-10.9). But they have six other good years as a tandem. What are those years worth? They averaged 6.6 WAR — more than six of the last eight pennant winners got from their 2B/SS regulars. Their norm for those six years was 3.2 Wins Above Average; a lineup of eight such players would total 12.8 WAA, more than any 2013 lineup save Boston’s. Those six “off-peak” years aren’t just filler; they’re good years that would help almost any contender.
__________
Actual Tandems
Obviously, those HOF tandems are dream matchups. You could form a lot of HOF tandems that would lose the peak race to Trammaker. How often does a team actually get 10+ WAR from its DP tandem? During Trammaker’s 16-year run, there were 13 other 10-WAR tandems.
And how often does a HOFer at 2B or SS have a star-quality partner? For the six HOFers in my study, here are the four best WAR seasons by their DP partners (among years the HOFer had 70+ games at his position):
- Frisch (13 years) — His partners’ highs were 6.0, 4.5, 4.0 and 3.7.
- Appling (16 years) — His DP mates peaked at 5.3, 2.3, 2.3 and 2.2.
- Alomar (16 years) — 6.0, 4.6, 3.2, 3.0
- Smith (17 years) — 5.6, 5.4, 3.7, 2.6
- Sandberg (13 years) — 3.0, 2.5, 2.3, 1.8
- Larkin (15 years) — 4.0, 3.6, 2.4, 2.3
In 90 total seasons as a 2B/SS regular for those six HOFers, their DP partners totaled two years of 6+ WAR, five of 5+, and nine years of 4+ WAR. Their four best partner years averaged 3.6 WAR.
By the way, here are the 13 actual 2B/SS tandems in modern history with 6+ WAR from each player, ranked by combined WAR (adjusted for schedules):
- 1906 Naps, Nap Lajoie/Terry Turner (20.4 WAR, finished 3rd)
- 1948 Indians, Joe Gordon/Lou Boudreau (17.9 WAR, World Series Champs)
- 1949 Dodgers, Jackie Robinson/Pee Wee Reese (17.4 WAR, lost WS)
- 1947 Indians, Joe Gordon/Lou Boudreau (15.0 WAR, 4th)
- 2009 Rays, Ben Zobrist/Jason Bartlett (14.8 WAR, 3rd)
- 1942 Yankees, Joe Gordon/Phil Rizzuto (14.6 WAR, lost WS)
- 1981 Angels, Bobby Grich/Rick Burleson (14.6 WAR, 5th, losing record)
- 2007 Phillies, Chase Utley/Jimmy Rollins (13.9 WAR, lost NLDS)
- 1999 Indians, Roberto Alomar/Omar Vizquel (13.4 WAR, lost ALDS)
- 1919 Yankees, Del Pratt/Roger Peckinpaugh (13.3 WAR, 3rd)
- 1983 Tigers, Lou Whitaker/Alan Trammell (12.7 WAR, 2nd)
- 1976 Orioles, Bobby Grich/Mark Belanger (12.6 WAR, 2nd)
- 1946 Dodgers, Eddie Stanky/Pee Wee Reese (12.4 WAR, 2nd)
And here’s every pairing I found of actual HOF DP tandems lasting 2 years or more (min. 60 games each at the position to count the year):
- 9 years, Johnny Evers/Joe Tinker
- 7 years, Nellie Fox/Luis Aparicio
- 5 years, Jackie Robinson/Pee Wee Reese
- 4 years, Bobby Doerr/Joe Cronin; Joe Gordon/Lou Boudreau
- 3 years, Gordon/Phil Rizzuto; Paul Molitor/Robin Yount; Evers/Rabbit Maranville; Frisch/Dave Bancroft*
- 2 years, Frisch/Travis Jackson;* Billy Herman/Reese
* Double-counting 1923, when Bancroft and Jackson both had 60+ games at SS, with Frisch as the 2B regular.
__________
Does peak theory need tweaking in this era of free agency and long-term contracts? Pennant impact now goes beyond what they do on the field; it’s also what they do to your budget. Most players these days reach free agency after age 30, when they’re at or past their peak. High-peak stars command the biggest investments just when their performance is likely to decline, sometimes sharply. A second-tier star with a modest peak who lasts longer near that level may prove more useful to a team, because of his stable value.
Suppose you need a second baseman, and there are two free agents going into age 31 (like Robinson Cano this year):
- Ryne Sandberg, who averaged 5.4 WAR in age 24-30
- Lou Whitaker, 4.7 WAR in age 24-30
First of all, Sandberg will cost a lot more. In free agency, as in most markets, the marginal gains at the top of the quality scale cost much more than those lower down. (In fact, Sandberg had two years with MLB’s #2 salary, age 33-34, while Whitaker never cracked the AL’s top 10.) But although Sandberg had big years at 31-32, he faded quickly, and Whitaker beat him by 28-23 in total WAR for their next six years played after age 30. If you’re paying superstar dollars and getting so-so performance, you may not have money left to fill in the gaps. That’s another kind of pennant impact.
No one can tell in advance which players will hold their value the longest, nor which top stars will crash. But when it comes to rating careers on pennant impact, today’s economics create a subtle advantage in the long, steady value of players like Whitaker and Trammell, which eludes peak-value assessment.
You’re talking about voters who still look at RBI numbers for god’s sake. Peak WAR? They could care less.
The problem with Whitaker and Trammel is that they both have no areas of excellence. Solid defense, solid bats, solid longevity, WAR even likes their baserunning skills a little. That said, neither where high average guys or power guys or RBI guys so their triple crown stats look very pedestrian. Neither were marquis players in an era that favored RBI’s over BB’s. Outside of the 1984 WS, neither were post season memory makers. Jack Morris was a name with accolades to back it up. That’s why he gets the support from outside of detroit and the middle infield does not.
You may look at Trammel compared to, say, Winfield and roll your eyes. Higher average, more power, lots more RBI’s, MVP votes in 9 different years, post season heroics, perception as the best player in the game, 7 gold gloves, play well into your 40s, etc. None of those things sabermetrics value but a HOF voter does. Hence Winfield gets 84.5% and Whitaker gets 2.9%
mosc, I get your point. But it’s not just the voters caring only for triple crown stats; it’s them not even bothering to view those stats in the context of their times and their positions.
For instance, you say that neither were high average guys or power guys or RBI guys. But in their era, among middle infielders, they rate quite well in all three.
Out of 25 MIFs with 5,000 PAs from 1978-93, Trammell is 4th in BA at .288; only Julio Franco hit over .290 for that span (.300 even). Trammell’s .343 in 1987 was the best BA season by a MIF in that time.
For HRs and SLG in that era, they rank #3-4, behind Sandberg and Ripken.
For RBI, they’re #2-3, trailing only Ripken. And in Runs, they’re #1 (Lou) and #4.
So even if you consider just the T.C. stats, once you factor in their multiple-Gold-Glove defense, how can even a traditional voter not see that they were exceptional?
Well for one thing I don’t think the defensive reputations of Trammel and Whitaker is what it should be. I think they’re both thought of as decent defenders (4GG and 3GG respectively) but both had an unusually long stretch of positive defensive contributions that traditional voters are having trouble recognizing. They both had significant defensive contributions long after they stopped winning gold gloves in the mid 80s. It’s not fair to call them near-average defensive middle infielders but I think that’s the label most voters use.
To talk about them separately for a change, I think Trammel’s main problem is that there were too many amazingly good shortstops who overlapped his career. His defense was “Not as good as Ozzy Smith” and his bat was “not as good as Barry Larkin” and he was less of a complete player than Cal Ripken. Few are, that’s hardly a knock but I think it hurt. Also back in 2002 when Trammel was on the ballot for the first time, we were watching offensive numbers from Arod (57HR in ’02, 298 at age 26), Nomar (56 doubles in ’02, .328 career average), Jeter, and Tejada. You also had plenty of other names like Eckstein, Vizquel, Rollins, and Renteria. Basically the steroids era had begun.
Whitaker to me is a case of two different halves that didn’t line up. He was a defensive stud with a decent bat followed by a HOF middle infield bat with a medicore glove. I think when you watched Whitaker, you were never seeing the total value he would show as a career. You’re talking about a guy that had 1 HR in his third full MLB season and would finish his career slugging .518 at age 38. WAR would tell us that baseball changed a lot over his career and he changed with it, staying consistent, but the raw numbers don’t paint that picture.
Trammell did put together one of the greatest post-season performances of all time in 1984. 1.318 OPS in the ALCS, and then 1.300 (and official MVP) in the World Series.
The fact you had to put together 3 pairs of HOF’ers that never played as teammates just to get comparables says all you need to know about the uniqueness of this tandem.
They should go in together.
John, in the list of the 13 actual DP pairings who had concurrent 6 WAR years, there’s an asterisk next to Lajoie/Turner that doesn’t appear to be followed up with a comment. Did you have something to say about this season or is it a typo?
RJ, thanks for catching that — Yes, I did have an aside about the 1906 Naps amassing 56 WAR, same as the 116-win Cubs that year, but winning only 89 games and finishing 3rd in the AL. But I decided the piece could use a trim somewhere. 🙂
There is no such thing as reading too much about baseball.
This should be required reading for every BBWAA member who cast a vote for Jack Morris or didn’t vote for Alan Trammell.
Actually, add “didn’t vote for Lou Whitaker” to that list.
Which would mean pretty much all of them that didn’t join in the past decade or so.
Thanks for putting it into such great perspective John.
Even if it does make me want to go bang my head on a post.
They don’t look at WAR at all. It’s hard to stress something as mundane as this when park adjustments, era adjustments, comparative value weightings, and replacement level play are not even in their consideration.
Peak vs longevity is something that really aught to be discussed more often in the samermetrics community but to a typical HOF voter, we’re discussing variations of things that don’t make any sense and that’s not really a way to highlight a difference.
The Tigers have had a tradition of long-serving DP tandems with 7 year stints for Donie Bush/Ralph Young (1915-21) and Charlie Gehringer/Billy Rogell (1932-38).
Other than the two HOF pairs you identified, these are the only other post-1901 tandems with 7+ years:
– White Sox: Luke Appling/Jackie Hayes 1932-39
– Red Sox: Hobie Ferris/Freddy Parent 1901-07
– Yankees: Derek Jeter/Robinson Cano 2005-12
– Athletics: Bert Campaneris/Dick Green 1965-66, 68-71, 73-74
– Cubs: Billy Herman/Billy Jurges 1932-38, Gelnn Beckert/Don Kessinger 1965-73, Shawon Dunston/Ryne Sandberg 1985-91
– Reds: Dave Concepcion/Joe Morgan 1972-79, Dave Concepcion/Ron Oester 1980-86
– Dodgers: Bill Russell/Davey Lopes 1973-80
– Phillies: Mickey Doolin/Otto Knabe 1907-13, Jimmie Rollins/Chase Utley 2005-13
– Pirates: Dick Groat/Bill Mazeroski 1956-62
– Giants: Larry Doyle/Art Fletcher 1911-16, 18-19, Robby Thompson/Jose Uribe 1986-92
The Angels’ Erick Aybar/Howie Kendrick tandem should join this list in 2014. Like Trammell and Whitaker, they have both played their entire careers (so far) with one team.
Doug — Oddly, I just finished compiling the same list, with the same 7-year minimum. But I used a 70-game minimum, which knocked out a couple of yours.
BTW, I was re-reading the 1987 Abstract recently (post-’86 season), and James noted that Trammell & Whitaker had *probably* played more games together than any tandem ever. Then they played 9 more years together.
I like that from 1930-33 both Boston teams had a middle infielder nicknamed Rabbit: Maranville for the Braves and Warstler for the Red Sox. Then, after Maranville retired, the Bees/Braves picked up Warstler.
John:
Canton is overloaded with guys with rings; perhaps that same insidious line of thinking has crept into Cooperstown? More to the point, I believe it is alive and well and still thriving in the thought processes of HoF voters in the sport. Perhaps if the Tigers won the whole enchilada more than just the once in 1984, both of these guys would be in? For crissakes, Jack Morris got way too much credit for a single 10 inning masterpiece with the Twins.
Further, Trammell got stiffed in the 1987 MVP voting and that kind of hardware definitely would have helped his cause. Also, I firmly believe that these two players in the same infield with very similar accomplishments basically detracted from each other when neither distinguished himself from the other. That is to say, since neither of these guys put up ridiculous single-season WAR totals, their above-average play was taken for granted.
Last question: Gun to your head, which one and NOT the other gets into Cooperstown? You know, who is the superior player and how would you decide?
Paul E — to your last question … I gladly eat the bullet! But seriously, in such a close race, I think I’d go with the SS. And so would the voters, obviously.
One thing that’s rarely mentioned about Trammell’s coulda-been-MVP in 1987: In the prior offseason, our longtime cleanup hitter, Lance Parrish, had signed with Philly. Trammell had never started a single game batting cleanup, but he stepped up, hitting 4th in every start that year. He was great all season, but especially in September, hitting .417/1.167.
I’m not going to beat the dead horse of that MVP vote (which could just as well have gone to Clemens). But it is puzzling how sometimes the pennant race and the stretch run resonates with MVP voters, and sometimes it doesn’t.
It’s not as applicable in today’s voting because of the cumulative shunning of steroid era players, but for earlier times Bill James’ Hall of Fame Monitor is quite revealing at gauging BBWAA opinions.
I’ll keep these players in John’s tandems. A 100 Hall Monitor score is a “likely” HOF’er:
Appling – 149
Frisch – 184
Sandberg – 158
Ozzie – 142
Alomar – 194
Larkin – 120
Whitaker – 92
Trammell – 118
These scores aren’t a reflection of accomplishments per se but rather a reflection of the accomplishments that matter to voters. This deserves a closer look. Let’s take the highest score (Alomar at 194) and compare it to the lowest (Sweet Lou at 92). Sorry for the lengthiness.
Alomar Hall Monitor score:
-9 seasons of .300+ BA x 2.5 pts….= 22.5 pts
-2 100+ RBI seasons x 3 pts………= 6 pts
-6 100+ runs scored seasons x 3 pts.= 18 pts
-5 35+ doubles seasons x 1 pt…….= 5 pts
-12 All-Star games x 3 pts……….= 36 pts
-10 Gold Gloves x 2 pts………….= 20 pts
-2 WS-winning seasons at 2B x 5 pts.= 10 pts
-5 division-winning seasons x 1 pt..= 5 pts
-1 season RS league-leader x 3 pts..= 3 pts
-2500+ career hits x 15 pts………= 15 pts
-.300+ career BA x 8 pts…………= 8 pts
-2100+ career G at 2B x 30 pts……= 30 pts
-.275+ career BA, 1500+ games at 2B.= 15 pts, 193.5 total
Whitaker Hall Monitor score:
-1 season of .300+ BA x 2.5 pts…..= 2.5 pts
-1 200-hit season x 5 pts………..= 5 pts
-2 100+ runs scored seasons x 3 pts.= 6 pts
-2 35+ doubles seasons x 1 pt…….= 2 pts
-5 All-Star games x 3 pts………..= 15 pts
-Rookie of the Year award………..= 1 pts
-3 Gold Gloves x 2 pts…………..= 6 pts
-1 WS-winning season at 2B x 5 pts..= 5 pts
-1 division-winning season at 2B….= 1 pt
-2000+ career hits x 4 pts……….= 4 pts
-2100+ career G at 2B x 30 pts……= 30 pts
-.275+ career BA, 1500+ games at 2B.= 15 pts, 92.5 total
Summing up the differences:
-counting stats seasonal milestones = +36 points for Alomar
-hardware (A-S, GG, ROY) = +34 for Alomar
-team accomplishments = +9 for Alomar
-black ink = +3 for Alomar
-counting stats career milestones = +19 for Alomar
It’s interesting that Alomar gains 14 pts. for more Gold Gloves even though TZ suggests Alomar was a below-average 2B (I know, right?) while Whitaker’s +77 Rfield total is 18th all-time for 2B. Also, there’s only an 8-pt difference in career OBP (.371 for Robbie and .363 for Lou) but Alomar’s BA exploits net him 28 more Monitor points than Whitaker’s (45.5 to 17.5).
Nice presentation, bstar.
Definitely makes a case for the utility of HOF Monitor for prognostication 🙂 (whether that is a good thing or not).
Thanks, Doug. This doesn’t necessarily apply in this particular case, but one thing you see right off is how park factors are completely ignored in offensive milestones.
And that’s not a knock on Bill James, it’s a big knock on voters who only look at BA, H, HR, and RBI totals without considering park for BA and H or team strength for runs scored or RBI. And how about a bonus for a 100-walk season?
Poor Jimmy Wynn (56 WAR but only a 36 Monitor score).
I believe there was a perception that Larkin and Sandberg may have been the best players in their league at some point in their careers – definitely Sandberg, maybe Larkin (1995-1996, with the exception of Bonds?). This was enforced by GG-WINNING defense, high stolen base totals, and HR power – you know – five tools.
TOGETHER, Whitaker and Trammell never exceeded Sandberg’s top season in SB’s and only twice surpassed his best HR total. Larkin had a 30-30 season to his credit and MVP hardware in another season. Sandberg had an MVP season. Deserved or not, these things create a perception that facilitates HoF election.
Just an aside, does anyone recall the 1984 Cardinals-Cubs game on a game-of-the-week Saturday where Sandberg went like 5-6 with 2HR’s and 7 RBI? Whitey Herzog commented, something to the effect, “Today we got beat by Rogers $^*@!* Hornsby”
Paul E — I know you’re not arguing the merits. I will still point out that anyone who thinks that Barry Larkin’s 33-HR season makes his general home-run power equal to that of either Whitaker or Trammell is just not paying attention.
Ditto for the “5 tools” point. Trammell & Whitaker didn’t have huge SB totals, but Trammell did swipe 30 in 1983, while batting .319 (4th in AL) with 14 HRs and a Gold Glove. Larkin in ’95 had essentially the same season — .319 BA (6th in NL) with 15 HRs and a Gold Glove, 51 SB — and got the MVP for it.
One point I’ll try to make in an upcoming post is that it absolutely does not require WAR or OPS+ or any sabermetrics to perceive Whitaker & Trammell’s excellence. It only takes viewing standard stats in the context of the times.
JOHN:
You are correct – I am not arguing the merits of any of these guys. What I am saying is that Sandberg was definitely perceived as the best ball player in the NL for a period of 2-3 years.
One thing I’ll disagree with is the “viewing of standard stats in the context of their times”. I think BSTAR’s comments regarding the Hall Monitor on Alomar versus Whitaker in #16 kind of kicks that approach to the curb. Unless, of course, you mean people like us – the non-Hall-of-Fame-voting public. And, I don’t believe OPS+ is all that technical and is probably one of the better “context of their times” stats along with wOBA.
If you think about the steroid era, whether players were on steroids or not, all those runners on base facilitated “easier” at bats for guys like Greg Vaughn to hit 50 (FIFTY!!) homers and make the accomplishments of the guys who played from 1963-1993 (Santo, Boyer, Allen, Reggie Smith, Dwight Evans, Simmons, etc..) look “Un-Hall-Worthy”.
Yeah, I know Santo got in
P.S. Here’s the Sandberg game Paul E mentioned. Both of Ryno’s HRs came off Bruce Sutter, tying the game in the home 9th and again in the 10th, with a 2-out, 2-run shot. Also in that game, Willie McGee had the NL’s first cycle in over 4 years, with 6 RBI. It was the only time in the 1980s that two players had 6+ RBI in one game. BTW, Sutter entered that game in the 7th and pitched 3.1 innings; he even batted in the top of the 9th, 2 outs, 2 on, Cards ahead by one.
http://www.baseball-reference.com/boxes/CHN/CHN198406230.shtml
Thanks, John. A real “notice me” game on a national stage for Sandberg. Those Saturday games of the week were always something to look forward to in the pre-cable/ESPN/MLB channel days.
If I knew how to post the link, I recall a skinny shortstop with the Brewers having a nice day on Saturday May 31, 1980 in a 19-8 blowout at Fenway. Prior to 1980 Yount was hitting at 89 OPS+ clip. In 1980 he topped 300 total bases and was on his way…..
Sometime around 1974 I recall John Ellis of the Indians getting 5 (or so) hits in an entertaining game that either went extra innings or was a bottom of the ninth win for the Tribe. I can’t recall if the Indians were wearing their “blood-clot-red” pants and jerseys……
I’ve kind of lost interest in the HoF, partly for reasons illuminated by PaulE @19, and bstar @16 — voters are just not interested in the traits that produce winning baseball – they are interested in the traits that are easy to talk about and extol ,since after all, that is their metier. Lou and Robbie were essentially the same player, one was much easier to write about than the other, and so became more famous. In the early 1990s I agree with JA, though, watching Lou, Robbie and Ryno, in the early 90s , you didn’t need fancy statistics to see that second base was being played by these men as well as it had ever been played. Whitaker was fully the equal of the others on the field, but not being even the most famous position player on his own team he never could be in the minds of the innocent bystanders the equal of the others in Cooperstown.