
Wrapping up my mini–series on Alan Trammell and Lou Whitaker with a look at how timing hurt their Hall of Fame chances, and a bunch of other stuff. Throughout this post, all seasons are projected to 162 games unless noted.
Timing hurt their HOF chances in many ways, but I’ll detail two major factors:
- Offense soared just as they were on their way out. Comparing Trammaker’s 1978-93 prime to the next 16 years, AL scoring rose by 12%.
- More great middle infielders played during Trammaker’s time than any other in MLB history, including three of the seven best (Joe Morgan, Cal Ripken and Alex Rodriguez).
There’s a third factor whose effect I can’t gauge, so let’s start with the certainties.
Missing the Party
The offensive zoom occurred overnight: In 1993, Whitaker and Trammell both played their last full-time years. In ’94, AL scoring spiked 11%, and stayed high for more than a decade. The years 1994-2003 saw more runs per game than any 10 years save the 1930s.
That brought a lot more of the individual magic numbers that Hall voters still love. Comparing 1978-93 and 1995-2010 for middle infielders:
- .300 averages more than doubled, from 62 to 133
- “100” seasons quadrupled — from 13 to 51 for 100 RBI, 36 to 143 for 100 runs.
Expansion from 26 to 30 teams did bring 14% more team-seasons into the latter period, but the rise in magic numbers still came mainly from offensive context.
Trammell and Whitaker did impressive things, for their time. In a 50-year span from 1944-93, Trammell’s six qualified years hitting .300+ (all from 1980-90) were two more than any other shortstop, tied with Carew and Fox for the most among all middle infielders. But in 1994-2004 alone, that six-time feat was matched by Alomar, A-Rod, Jeter and Nomar, with two more in the club since then. Trammell’s .343 BA in 1987, the best by a SS since 1948, was topped four times just from 1996-2000.
In that same 50-year span, Whitaker’s eight years of 15+ HRs tied Morgan and Sandberg for the most among second basemen, and his four years of 20+ HRs tied Morgan behind Sandberg’s five. But in 1995-2004 alone, Jeff Kent had nine years of 20+ HRs, and Bret Boone had six. From 1949-89, Whitaker’s 28-HR year was 4th-best by a 2B, and only Davey Johnson topped 30; but 30 HRs has been reached 23 times since then, by 11 different second basemen.
OPS+ and Offensive WAR can place Whitaker and Trammell in the same class as Sandberg, Larkin, Alomar and Biggio. But those all-in-one numbers may not pack the punch of traditional stats. So I used B-R’s Neutralized Batting tool to estimate Trammaker’s career stats had they come up in 1990, in the Larkin/Alomar/Biggio generation. Putting each actual season performance into a 13-years-later Detroit context, with the same playing time, yields these lines:
- Trammell – .302 BA, .373 OBP … 2,601 hits … 202 HRs, 1,158 RBI, 1,424 Runs … 715 XBH … 3,778 Total Bases
- Whitaker — .294 BA, .386 OBP … 2,623 hits … 271 HRs, 1,257 RBI, 1,613 Runs … 810 XBH … 4,045 Total Bases
With those stats, each would be among his position’s all-time top 8 in Hits, HRs, RBI, Runs, Extra-Base Hits, Total Bases, and OBP. And they’d be in the Hall of Fame.
A Crowded Field
I showed the estimates for Trammaker had they come up in 1990. But if they’d come up in 1960, they’d have stood out even more.
In MLB history, 29 middle infielders have amassed 60 career WAR; Whitaker and Trammell are both over 70 WAR. But getting noticed depends a lot on who else is around. Consider:
- From 1959-69, just one of those 29 was active at any point. (And he wasn’t even “Joe Morgan!” yet.)
- From 1978-96, nine of those 29 were active each year, on average. Ten were active each year from 1988-92, the tail end of Trammaker’s prime.
- No season outside 1978-96 has seen more than six such players active.
The ’60s dearth of great MIFs may have helped Luis Aparicio and Bill Mazeroski reach the Hall. Maury Wills, 2nd among 1960s MIFs with 36.7 WAR, got 40% support in his best HOF ballot — more than has ever gone to Trammell, who was #1 in the ’80s with 52.4 WAR.
In the ’60s, really big years by a MIF were scarce as hen’s teeth, even by neutral measures. From 1960-71, there was one 8-WAR year, and one qualified year at 150 OPS+ (both Rico Petrocelli, 1969). Then Little Joe flapped his elbow, and the landscape changed. From 1972-84, six different middle infielders combined for eleven 8-WAR years, and eight 150-OPS+ years. Five of those six won MVP Awards, including three straight from 1982-84. In ’87, Trammell posted 8.2 WAR with a 155 OPS+ year (and led Detroit’s September pennant surge, hitting .417/1.167), but the trophy escaped him. A shortstop batting .343-28-105 was no longer a novelty.
As the most complete player of the ’70s, Morgan cast a big shadow. His prime was capped by two MVPs right before Trammaker broke in. His 5-year WAR peak (8+ WAR each of 1972-76) has been matched only by Wagner, Ruth, Hornsby, Williams, Mantle, Mays and Bonds. Then came Cal Ripken, who trails only Wagner in WAR for shortstops. Trammell was terrific in 1983, .319 with 30 steals and a Gold Glove, but Cal blew that out of the water. Later, just as Trammaker were finishing up, A-Rod went supernova, becoming the first SS since Wagner to contend for “game’s best player” over a decade or so. (None but Honus and Alex ever had 70+ WAR in a 10-year span.)
By 2001, when Whitaker reached the HOF ballot, Jeff Kent was a reigning MVP; Nomar had won two straight batting crowns; and Jeter, Alomar, Larkin, Biggio and Tejada were still at or near their peaks.
If there’s any doubt that the number of excellent middle infielders during Trammaker’s career affected the HOF voting, consider these counts of SS/2B with 50+ WAR in 20-year spans (47.5 WAR for 154-game era):
- 1900-19 — 6 (all in HOF)
- 1910-29 — 5 (4 in HOF)
- 1920-39 — 7 (all in HOF)
- 1930-49 — 7 (all in HOF)
- 1940-59 — 5 (all in HOF)
- 1950-69 — 1 (in HOF)
- 1960-79 — 3 (2 in HOF)
- 1970-89 — 8 (4 in HOF)
- 1980-99 — 8 (5 in HOF)
- 1990-2009 — 6 (2 in HOF, 2 active, 2 fresh to the ballot)
Of those retired by 2006, the only non-HOFers are:
- Art Fletcher, 1910-29 group, 47.2 career WAR (made list because his bad rookie year was 1909)
- Bert Campaneris, 1960-79 group, 53.3 career WAR
- Whitaker, 1970-89 group (and 1980-99), 74.8 career WAR
- Trammell, 1970-89 group (and 1980-99), 70.3 career WAR
- Bobby Grich, 1970-89 group, 71.0 career WAR
- Willie Randolph, 1970-89 group, 65.6 career WAR
The four in the 1970-89 group — Whitaker, Trammell, Grich and Randolph — are the only non-HOF middle infielders with 65+ WAR, and the only ones meeting the “54/27” WAR standard I discussed in a prior post.
The hell of it? Despite the stiff competition, Trammaker were still way above average — probably just as much as if they’d played in a less star-studded era. More on that later.
Big WAR Takes a Dive
I don’t know what this means, but I’ll just put it out there: We know that Trammaker had just one 7-WAR season between them. But during their careers, 7-WAR seasons were rarer than ever before or since, for any extended period. This chart shows live-ball seasons of 7+ WAR by position players, in 5-year averages. All figures are per 30 teams, and the WAR threshold is adjusted to each year’s actual schedule (so in a 154-game season, 6.6 WAR counts as “7 WAR”):
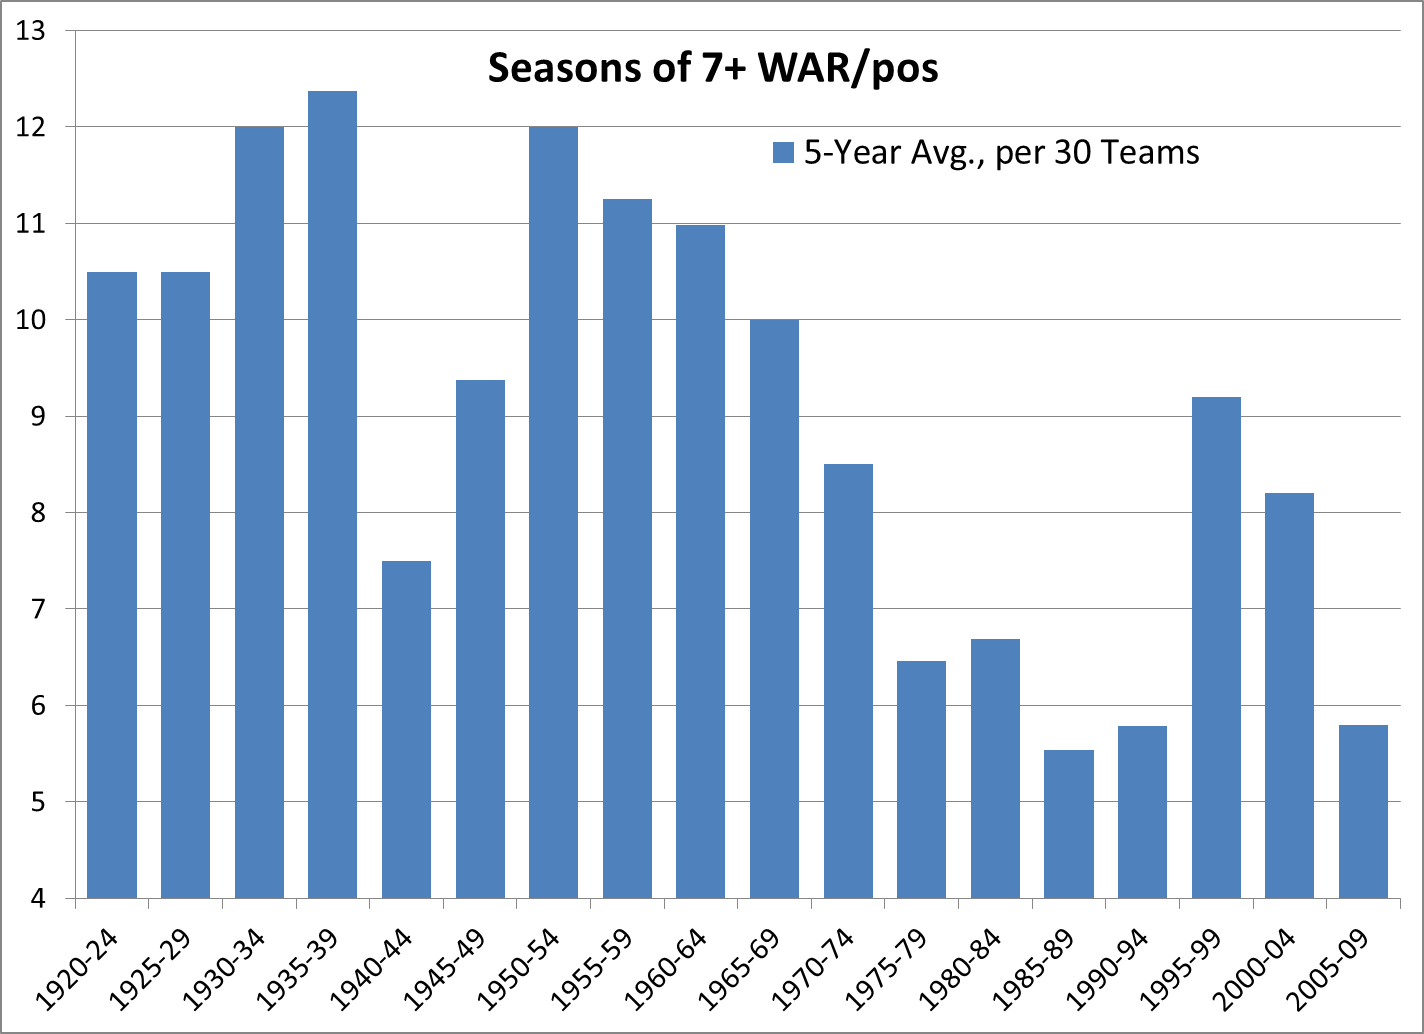
That trough from 1975-94 covers 95% of Trammaker’s career games. I don’t know what to make of it, because I don’t know what caused it — but it’s not just a fluke of the 7-WAR threshold. There’s a similar drop in 8-WAR seasons, and a smaller decline in 6-WAR campaigns. I thought platooning might be a factor, but that would show up in the number of hitters qualified for the batting title — and that rate has barely changed since WWII, with the Trammaker era just above average.
In tighter focus, here’s the average of 7-WAR/pos seasons for three 16-year spans bracketing our guys:
- 1962-77 — 8.8
- 1978-93 — 5.7 (Whitaker/Trammell prime)
- 1994-09 — 7.8
All in all, it would be hard to find worse conditions for Trammell & Whitaker to get due recognition.
Now I’ll move beyond timing to some general thoughts.
____________________
Far Above Average
Maybe Whitaker & Trammell didn’t have classic peaks, but they didn’t reach 70 career WAR by being just above average for a long time. They were way above average, for a very long time. Here’s their rank in career Wins Above Average against their HOF contemporaries (counting Biggio):
- Morgan, 63.3 WAA
- Ripken, 53.2
- Whitaker, 42.4
- Larkin, 42.2
- Ozzie, 41.6
- Trammell, 40.1
- Sandberg, 38.1
- Yount, 37.2
- Alomar, 32.3
- Biggio, 28.5
WAA per 162 Games, Career:
- Morgan, 3.87 WAA
- Larkin, 3.14
- Whitaker, 2.87
- Ripken, 2.87
- Sandberg, 2.85
- Trammell, 2.83
- Ozzie, 2.62
- Alomar, 2.20
- Yount, 2.11
- Biggio, 1.62
12 Best WAA Years:
- Morgan, 57.5 WAA
- Ripken, 53.3
- Larkin, 44.6
- Trammell, 43.5
- Yount, 42.2
- Ozzie, 40.0
- Sandberg, 38.3
- Biggio, 37.3
- Whitaker, 36.9
- Alomar, 35.7
Trammaker vs. Contemporary DP Tandems
Another gauge of their height above average is comparison to actual SS/2B tandems for the years 1978-93:
- Whitaker/Trammell combined for 9.1 WAR per year.
- For all other teams, the regular 2B and SS combined for 3.8 WAR per year.
Now, that may overstate their edge a bit, since some teams didn’t have a full-time tandem, and some of those teams got more WAR from a timeshare than from the top guy. Still, Detroit’s DP tandem produced something like 5 WAR per year more than the average — and they did that over 16 years.
While Detroit’s duo averaged 9.1 WAR, the next-best clubs averaged 7.0 (St. Louis) and 6.3 (Baltimore) by their tandems. Detroit got at least 6.6 WAR from Trammaker in 14 of 16 years. That’s a heck of a foundation.
Trammaker had seven years at 10+ WAR; all other teams in those 16 years had 13 such tandems — three for Ripken, three for Yount, two for Ozzie, none for Sandberg. Of those twenty 10-WAR tandems from 1978-93, these seven finished 1st or won 90 games:
- 13.1 WAR, 1982 Brewers — 95-67, lost World Series
- 12.7 WAR, 1983 Tigers — 92-70, 2nd place
- 12.0 WAR, 1985 Cardinals — 101-61, lost World Series
- 11.8 WAR, 1987 Tigers — 98-64, won division, lost ALCS
- 10.9 WAR, 1984 Tigers — 104-58, won World Series
- 10.6 WAR, 1980 Yankees — 103-59, won division, lost ALCS
- 10.3 WAR, 1981 Reds — 66-42, “1st place” (best overall record, screwed by split schedule)
Detroit’s seven 10-WAR tandems produced one championship and another division crown. The other 13 such tandems produced two pennants, another division title, no championships.
A tighter peak for the duo was 1981-91, in which Whitaker & Trammell ranked 1st or 2nd in tandem WAR each year but one — five 1sts, five 2nds:
- 1981 — 2nd, 11.3 WAR
- 1982 — 2nd, 9.7 WAR
- 1983 — 1st, 12.7 WAR
- 1984 — 1st, 10.9 WAR
- 1985 — 3rd, 7.3 WAR
- 1986 — 1st, 10.7 WAR
- 1987 — 1st, 11.8 WAR
- 1988 — 1st, 9.4 WAR
- 1989 — 2nd, 9.0 WAR
- 1990 — 2nd, 10.5 WAR
- 1991 — 2nd, 10.0 WAR
Trammaker averaged 10.3 WAR for 1981-91, while all other tandems averaged 3.8 WAR. That’s a big edge from two spots in the lineup — and a big reason why only Toronto won more games than Detroit in those years, with Sweet Lou & Tram ranked 2nd and 7th for wins played in. Their 10.3 WAR average is more than half the average team’s WAR/pos in that era. Individually, for 1981-91, they rank 4th (Trammell) and 6th in total WAR/pos.
One last bit on these tandems, just for fun: To gauge balanced contributions from both halves of a tandem, I used the formula Bill James created for Power/Speed Number, with the two players’ WAR in place of HRs and SB; I’ll call this Tandem Score. The formula is, twice the product, divided by the sum. For 1981-91, Whitaker & Trammell logged 10 of the top 18 Tandem Scores. The top 20 Tandem Scores included:
- 10 by Trammell & Whitaker
- 3 by Ozzie & pal (two with Herr, one with Oquendo)
- 2 by Yount & Gantner
- 2 by Dickie Thon (one with Doran, one with Garner)
- 1 by Bobby Grich & Rick Burleson (the top mark)
- 1 by the Ripken brothers
- 1 by Dave Concepcion & Ron Oester
Pennant Impact
So why did Detroit win their division just twice in those 11 years? I have no pat answer.
It’s clear that Trammell and Whitaker were generally Detroit’s best players from 1981-91. The duo had 12 individual years of 5+ WAR, while all other Tigers added 9 such years. They logged the club’s top 4 WAR seasons and 12 of the top 18. Their combined average was 5.5 WAR per 650 PAs, while all other Detroit regulars in those years (300+ PAs in a season) combined for 3.1 WAR/650. No Tiger with more than 2 years in the span came close to their average WAR.
On the other hand … Even excluding Trammaker, Detroit’s other regulars still averaged better than the rest of the teams combined, by 3.1 to 2.9 WAR/650. Including the duo, Detroit regulars averaged 3.8 WAR/650; Toronto, who won the most games in this span, averaged 3.1 WAR/650 from regulars.
And Detroit had more All-Star-quality years than anyone. At 5+ WAR, the tally was Detroit 21, Boston 17, Oakland & Montreal 16. At 6+ WAR, the tally was Boston 11, Detroit & Montreal 10, Baltimore 8.
Ah, but in really big years — MVP-caliber years of 7+ WAR — the score was Boston 8, Montreal 6, Baltimore 5, Philly 4, five teams with 3, five teams with 2, and Detroit with 1.
Is that shortage of 7-WAR years meaningful? It would take a lot more study to reach any conclusions, including the data for pitching and total WAR, which I won’t do right now. But as a caveat, note that Toronto (3 divisions, most wins) is not among the big-WAR leaders (12 with 5+, 7 with 6+, 2 with 7+). Nor are the Dodgers (4 divisions, 8 years of 5+ WAR, 1 of 7+), or the Cardinals (3 pennants, 14 with 5+, 2 with 7+). And Montreal, way up in big-WAR years, managed just one division in that span (and that only due to a split season). Baltimore, high in 6+ and 7+ WAR, also took just one division.
Complicating matters, it was an era of perhaps unprecedented parity in playoff appearances. Compare the first 12 years of the divisional era against the next 11 years:
- 1969-80: 15 franchises reached the playoffs, 10 reached the World Series
- 1981-91: 23 franchises reached the playoffs, 16 reached the World Series
During 1981-91, all but Cleveland, Seattle and Texas reached the playoffs. Seven clubs made their first appearance of the divisional era (Cubs, ChiSox, Brewers, Expos, Padres, Cards, Blue Jays). Repeating was rare: Each pennant from 1979-88, and each WS from 1979-92, was won by a team that had not won the year before. All four division winners were fresh in 1979-80, ’82-84, and ’86-88.
And Detroit was in the toughest division. For 1978-93 combined, AL East teams ranked 1st, 2nd, 3rd, 7th, 8th and 10th in overall record. For 1981-91, AL East teams ranked 1st, 3rd, 5th, 8th and 12th overall; for the rest of the top half, AL West had nos. 7, 9, 11 and 13; NL East had nos. 2, 6 and 10; and NL West had just no. 4.
Now, suppose Trammell & Whitaker each had a more normal distribution of high and low WAR years. Would that have led to more October games? Fact is, despite 11 straight winning years (1978-88) and the 3rd-best record in baseball during their 16-year prime (14 total games behind the #1 Yankees), Detroit did not contend often. They finished at least 6 GB all but four of those years: they won in 1984 and ’87, ran 1 GB in ’88, and were fairly close in both ’81 halves (3.5 GB/1.5 GB). If a high-low distribution of Trammaker WAR hits the right years, maybe they win one or both of those near-misses. On the other hand, the two years they did win were among the pair’s best. Trammell’s MVP-caliber year was 1987, when they clinched the division in the final game; so if the high-low hits wrong, maybe they lose that one.
Ultimately, I cannot conclude that Detroit’s WAR/pos pattern of high average, low peak — seen not just in Trammaker but in the whole lineup — was a factor in cashing just two division titles from all those wins. It could be just something that happened, with no clear cause.
About Those “Low Peaks”
There are 39 middle infielders in the Hall, with Biggio soon to be #40. I calculated their total WAR for their 2 best WAR seasons, their 6 best and their 10 best (no adjustment for schedules). Here’s where Trammell and Whitaker would land on those lists (including Biggio):
- 2 Best WAR Seasons: Trammell #18, Whitaker #28
- 6 Best WAR Seasons: Trammell #16, Whitaker #26
- 10 Best WAR Seasons: Trammell #16, Whitaker #24
For single best year, Trammell would tie for #17, Whitaker would tie for #31. Seven modern HOFers had best seasons below Whitaker’s: Red Schoendienst, Bobby Doerr, Johnny Evers, Travis Jackson, Luis Aparicio, Rabbit Maranville and Bill Mazeroski. Aparicio and Maranville were BBWAA selections.
So, while Trammell & Whitaker can’t match the peaks of the inner circle, there are a lot of Hall of Fame MIFs with worse peaks. Taken together, their peaks would fall right in the middle of the HOF spectrum.
Debut Duos
Eight pairs of players who debuted in the same team/year each achieved 50+ WAR. Only Whitaker and Trammell (a) both reached 70 career WAR, or (b) both reached 55 WAR in their years together.
In reverse order of teammate tenure:
- Joe Jackson/Home Run Baker, 1908 A’s – Jackson played just 10 games with the A’s, traded to Cleveland in 1909.
- Jeff Bagwell/Kenny Lofton, 1991 Astros – Lofton played just 20 games for Houston, traded that fall.
- Paul Waner/Joe Cronin, 1925 Pirates – Cronin played just 50 games with Pittsburgh, sold in 1928.
- Rod Carew/Graig Nettles, 1967 Twins – Nettles played just 121 games for Minnesota, traded in 1969.
- Joe Morgan/Jim Wynn, 1963 Astros – Together 9 years through 1971, amassing 60 WAR but no winning seasons.
- Jimmie Foxx/Mickey Cochrane, 1925 A’s – Together 9 years through 1933, combining for 86 WAR, 3 MVPs, 3 pennants and 2 championships.
- Jackie Robinson/Duke Snider, 1947 Dodgers – Together 10 years through 1956, amassing 114 WAR, one MVP, 5 pennants and one championship.
- Lou Whitaker/Alan Trammell, 1977 Tigers – Together 19 years through 1995, amassing 145 WAR, 2 division titles and one championship.
70 WAR for One Team
Just 40 players in MLB history have compiled 70 WAR for any one team. The Tigers and Yankees have five each; five teams have three, four have two, and seven have one. These nine pairs had any overlap (from shortest to longest):
- Pete Rose shared just one year with Barry Larkin, and neither was a regular.
- Joe DiMaggio was around only for Mickey Mantle’s rookie year.
- Carl Yastrzemski and Wade Boggs were teammates for 2 years (1982-83). (Yaz broke in the year after Ted Williams left.)
- Ty Cobb and Charlie Gehringer were Tigers teammates for 3 years (1924-26), but Gehringer barely played before ’26, and Cobb missed half of that season.
- Lou Gehrig overlapped with DiMaggio from 1936-39 — three years as regulars, three titles.
- Gehrig and Babe Ruth were together for 12 years (1923-34), 10 as regulars. Four pennants, three championships.
- Pete Rose and Johnny Bench were teammates for 12 years (1967-78), 11 as regulars. Four pennants, two titles.
- Hank Aaron and Eddie Mathews were both Braves for 13 years (1954-66), combining for almost 300 games a year in that stretch. Two pennants, one title.
- And Trammell & Whitaker, together for 19 years (1977-95), 17 years as regulars. Whitaker is 4th all-time in games played at 2B, Trammell 10th at SS. And almost all of those games were together.
Long-time Tandems
2B/SS tandems lasting 7+ years, min. 70 G each at their position to count the year. (This costs Detroit’s duo three years wherein Trammell had 60-63 G at SS, but whatever.)
- 14 years — Whitaker/Trammell (Tigers, 1978-91)
- 9 years and counting — Chase Utley/Jimmy Rollins (Phillies, 2005-13)
- 9 years — Glenn Beckert/Don Kessinger (Cubs, 1965-73)
- 9 years — Johnny Evers/Joe Tinker (Cubs, 1903-10, ’12)
- 8 years — Robinson Cano/Derek Jeter (Yankees, 2005-12)
- 8 years — Ryne Sandberg/Shawon Dunston (Cubs, 1985-91, ’97)
- 8 years — Dave Lopes/Bill Russell (Dodgers, 1973-80)
- 8 years — Joe Morgan/Dave Concepcion (Reds, 1972-79)
- 8 years — Larry Doyle/Art Fletcher (Giants, 1911-16, ’18-19)
- 8 years — Bobby Lowe/Herman Long (Beaneaters [Braves], 1893-1900)
- 7 years — Mark Lemke/Jeff Blauser (Braves, 1991-97)
- 7 years — Dick Green/Bert Campaneris (Athletics, 1965-66, ’69-71, ’73-74)
- 7 years — Julian Javier/Dal Maxvill (Cardinals, 1962, ’66-71)
- 7 years — Nellie Fox*/Luis Aparicio (White Sox, 1956-62)
- 7 years — Bill Mazeroski/Dick Groat (Pirates, 1956-62)
- 7 years — Charlie Gehringer/Billy Rogell (Tigers, 1932-38)
- 7 years — Billy Herman/Billy Jurges (Cubs, 1932-38)
- 7 years — Ralph Young/Donie Bush (Tigers, 1915-21)
- 7 years — Otto Knabe/Mickey Doolin (Phillies, 1907-13)
* Fox spent the prior 6 years paired with Chico Carrasquel.
And on the other end of the spectrum, Hall of Fame SS Bobby Wallace had 8 different partners in a 9-year span with the Browns, 1904-12.
I would not argue that long teammate tenure is a HOF credential. But if the unique feat of Trammell & Whitaker in this regard were to stir some sentimental HOF support, I wouldn’t be outraged.
____________________
Thanks for letting me get all this off my chest. I hope you found some part of it interesting!
Well, I’m sold.
But you probably already knew that.
I really hadn’t thought of it until someone mentioned something in a comment a while ago, but I wonder how much difference it would have made if Trammell had hung up the spikes a year earlier and retired at the same time as Whitaker? It would have left him a few RBI short of 1,000 but every rate stat would have go up a tic to compensate. I could see it keeping Whitaker on the ballot, at least for a while, but I have to wonder if it wouldn’t have helped Trammell some as well. I guess we’ll never know.
Great stuff, by the way.
“So why did Detroit win their division just twice in those 11 years?”
Because their pitching was not very good. In a previous comment (in a different thread) I jotted down who the SP were that Jack Morris had to “beat out” for the opening day start, and concluded that the reason that Morris made all those consecutive game starts was because Sparky Anderson was not an idiot.
Detroit has 3 pitchers who crack 10 WAR in that period (while playing for Detroit). Morris (28.2), Petry (13.6), and Tanana (13.1).
Is that out of line with other teams? The Brewers had 4, the Indians 3, the Orioles 4, the Yankees 4, the Red Sox 6, and the Blue Jays 6. So 3 isn’t that far out of line though it is on the low side.
The difference maker though is in innings pitched. Morris, Petry, and Tanana all pitched over 1300 innings for the Tigers in that span. Walt Terrell did NOT reach 10 WAR in his time with the Tigers, and he pitched 1191.1 innings for them in that time period.
Brewers – Higuera (32.1 WAR) only pitched 1291.1 innings, Bosio and Wegman cracked 10 WAR but not 1000 innings (those are the top 3 IP for the Brewers).
Indians – Candiotti and Swindell cracked 1000 but not 1200 innings, and Blyleven put up 20 WAR in 760.2 innings
Orioles – 3 over 1000 innings, but none over McGregor’s 1352.1
Yankees – Guidry had 1420 innings, Righetti 1119.1, and John had 825.1 – Gossage put up 10.4 WAR in 241.1 innings.
Red Sox – They had 4 guys crack 1000 innings, and all of them had at least 10 WAR (Clemens had 54.2 and Hurst had 21), plus they had 2 guys who did NOT crack 1000 innings put up 10 WAR (Boddicker and Ojeda)
Blue Jays – this is really the best comparison to the Tigers pitching as they had 3 pitchers who pitched 1300+ innings. Stieb pitched almost as much as Morris and out WARed him 51 to 28.2. Jim Clancy pitched 40 more innings than Dan Petry and out WARed him 17.3 to 13.6. And Jimmy Key pitched 115 more innings than Tanana and out WARed him 26.1 to 13.1. Key had 2 WAR less than Jack Morris in almost 1000 less innings. I guess Luis Leal is the closest pitcher the Jays have to Terrell, and Leal had 1.6 more WAR in some 300 LESS innings.
And none of that includes Milt Wilcox, the “5th” starter for the Tigers, who tossed 778.2 innings and put up 5.5 WAR. The only pitchers that I can find (keep in mind this is for the AL East from 1981-1991 and by team) who pitched 600 innings and had less than 1 WAR per 100 innings were:
Mike Caldwell (Brewers, 2.6 WAR in 756.2)
Neal Heaton (Indians, 3.1 WAR in 661)
John Cerutti (Blue Jays, 6.8 WAR in 772.1)
Todd Stottlemyre (Blue Jays, 5.7 WAR in 647.2)
Scott McGregor (Orioles, 10.3 WAR in 1352.1)
Dennis Martinez (Orioles, 1.6 WAR in 912.1 – quite possibly the biggest turnaround ever in a career)
Jeff Ballard (Orioles, -0.4 WAR in 695.1)
Al Nipper (Red Sox, 5.3 WAR in 693.2)
Dennis Eckersley (Red Sox, 5.2 WAR in 619.1 – not nearly as bad as Martinez)
And the 4 Tiger starters not named Jack Morris:
Petry (13.6 WAR in 1580.1)
Tanana (13.1 WAR in 1364.2)
Terrell (8.7 WAR in 1191.1)
Wilcox (5.5 WAR in 778.2)
The only pitchers not on the Tigers to beat Wilcox in IP were McGregor and Dennis Martinez, but then again the Orioles weren’t really contenders after 1983. The Tigers kept trotting out those same workhorses, and they all kept winning games (I’m taking JA’s comment that the Tigers were 2nd to the Jays in wins from 1981-1991 as a fact here), but they were winning those games because the position players (Trammell, Whitaker, Lemon, Gibson, Evans, etc.) were so good. The position players had to drag that pitching staff to all of those wins.
If Dave Stieb and Jack Morris had traded teams in 1981, it’s quite possible the Tigers win a few more divisions, and Stieb, Trammell, and Whitaker are all already in the HOF. Better yet, if the Tigers had come up with Jimmy Key and replaced one of their non-Morris starters with him then they may have won more division titles and Trammell, Whitaker, and (probably) Morris are all in the HOF.
In closing, in 1984 the Tigers put it all together and blew everyone out of the water. In 1987 they still did NOT have the pitching – if they didn’t trade Smoltz for Alexander and get brilliant pitching from Alexander they probably don’t win the division that year either and we’re left wondering why they only won once in that span. But it’s not very difficult to understand why they only won 2 divisions in those 11 years (from my point of view).
Artie Z. — I think the pitching side of the equation is a little bit hazy. While the 1981-91 Tigers had few individual pitchers with high WAR, the staff ERA+ was pretty good in the first 8 of those 11 years. The annual ERA+ figures and ranks:
1981 — 107, 2nd
1982 — 106, 4th (tie)
1983 — 103, 5th
1984 — 113, 1st
1985 — 108, 4th
1986 — 103, 8th
1987 — 106, 4th
1988 — 103, 6th (tie)
1989 — 85, last
1990 — 92, last (tie)
1991 — 93, 11th
But there’s a disconnect between Detroit’s ERA+ and pitching WAR for most of that span, which mainly means that the WAR analysis sees defense playing a big role in their run prevention. Their ranks in ERA+ and WAR/pitch:
1981 — 2nd … 7th (tie)
1982 — 4th (tie) … 11th
1983 — 5th … 11th
1984 — 1st … 5th
1985 — 4th … 7th
1986 — 8th … 11th
1987 — 4th … 5th
1988 — 6th (tie) … 8th
1989 — 14th … 13th
1990 — 14th (tie) … 10th
1991 — 11th … 13th
Push comes to shove, I guess I’d go along with the WAR analysis, and thus agree with your point. I just have to remember to separate “pitching” from “run prevention.”
So I learned something from this comment … I knew ERA+ was adjusted but for ballpark but for some reason I interpreted that as “team” (somehow including defense). Pitching WAR relative to ERA+ now makes much more sense to me.
But those Tiger pitchers really weren’t very good (other than Morris, who probably isn’t as good or bad as 95% of the population thinks he is). Well, Frank Tanana was really good before his Tiger years, but if you look at Terrell and Petry and Wilcox and “surround them” by “similar” pitchers over their entire careers you should see they don’t match up well.
To “surround them” by “similar” pitchers I looked at all pitchers who were within a 5 point ERA+ range and 200 IP range (above and below). So for Petry it’s 1880-2280 IP with an ERA+ between 97 and 107. There are 99 pitchers in history in that group and Petry ranks 48th in IP and somewhere between 47th and 54th in ERA+. So he’s dead in the middle basically. But in W-L pct. he’s 26th, while in WAR he’s 89th.
For Terrell the bounds are 1780-2180 IP and 88-98 ERA+. There are 44 pitchers in this group (because why do you give a guy with a 93 ERA+ almost 2000 innings?) and he ranks 17th in IP, between 32nd and 35th in ERA+. His WAR is 31st, so per inning it’s way down there. Terrell is 24th in W-L percentage.
I didn’t do a group for Wilcox because he’s on Terrell’s list (he should be on Petry’s list as well, but apparently Wilcox’s 97 ERA+ is more like 96.8). On Terrell’s list Wilcox is 13th in IP, somewhere between 5th and 12th in ERA+, but 25th in WAR. But he is 10th in W-L Pct.
I can do a list like that for Morris as well but there are only 8 pitchers on it. Morris is 3rd in IP, 5th in ERA+, and 4th in WAR, but first in W-L Pct. If the IP bound is increased to 400 each way then (1) there are now 18 pitchers on the list and (2) Tanana is on the list. But Tanana’s out of place because of his Angels years as he ranks first in IP and WAR and 6th in ERA+ despite barely being over .500 for his career.
And it’s not just that those Tiger pitchers weren’t good – it’s that the Tigers gave them a lot of innings to work with. Having a pitcher like that for 600 innings – happens to most everyone. But keeping a bunch of those guys around for 1200 or so innings – that’s just not a way to win consistently.
I know this discussion isn’t directly about Trammell and Whitaker, but in a way it is because it shows how much they helped their pitchers win (which is why I included the W-L Pct. numbers). Growing up I didn’t watch the Tigers (they weren’t showing Tigers games in Florida in the 80s – Mets games, sure, but not Tigers games) but I remember looking at the backs of baseball cards and seeing the W-L records and thinking “Wow the Tigers had a really good staff.” I know that isn’t true now, and I know where the value came from, but it has likely penetrated the minds of some voters.
Nice work, Artie Z.
A little off topic but – it seems like every MIF discussion I see has Biggio as wildly inferior to everyone else. I always personally thought Biggio was better than most of his contemporaries and Bill James seemed to solidify those thoughts. Can someone explain where Bill James went so terribly wrong in his evaluation that now Whitaker, Trammell, Grich, Alomar and others are all considered superior? It really has me confused.
Chris, I didn’t know this but apparently Bill James changed his mind on Biggio over the years. Here’s a piece written by James about Biggio from 2008:
http://www.slate.com/articles/sports/sports_nut/2008/02/the_epic_of_craig_biggio.html
Outstanding linkage, bstar.
Even a blind Googler sometimes finds a nut.
bstar #5:
Thanks for the link. What’s interesting about most of the “analytics” and “SABRmetrics” is that, for the most part, they really end up confirming the “eye test”. I mean really, did anyone ever think that Biggio (a fantastic player)was the equivalent of Griffey (a once-in-a-generation player)? If you think about it, Bonds doesn’t get much past 550 homers and Sosa doesn’t pass 450 and A-Rod probably doesn’t get much past 500 (if they stay healthy) without steroids. That would leave Griffey in 4th place all-time. That’s very impressive.
Did James ever issue the Dick Allen “Apologetics” regarding the “if that’s a Hall of Famer, I’m a lug nut” statement? Still searching for that link…..
I may be reading James incorrectly here, but I don’t believe he is recanting his belief that, for a period, Biggio was Griffey’s equal. Baseball-Reference WAR certainly agrees with him: from 1995-1999 WAR has Griffey at 33.6 and Biggio at 32.6.
Sabermetrics do often confirm the eye test. But, as is oft discussed on this site, the relationship between public perception and sabermetrically determined value tends to break down when analysing players who do well at many things, as opposed to being outstanding at a couple. Biggio vs Griffey is a classic example of this and, if one buys into WAR, the eye test failed us.
RJ:
I believe one of Biggio’s greatest “skills” was taking pitches on that fiberglass contraption on his left arm. How that “device” was ever allowed is beyond me. When you reach base an extra 20-25 times per year getting hit by pitches that increases SABRmetric value (RC/27 outs) tremendously. Take those HBP out of the equation and his OBP goes from .380 to .355 However, if Grffey was clean, his accomplishments from age 20-30 were pretty remarkable.
Chris C, a couple of factors in downgrading Biggio:
— His prime was in an era when the NL was clearly inferior to the AL, overall. WAR takes that into account.
— As noted in the Bill James piece that bstar linked to, Biggio fattened up his stats against weaker foes. B-R doesn’t offer a “quality of pitcher” split, but for a broad picture we can use the opponent over/under .500 split. Among the 181 players who had 5,000+ PAs during Biggio’s career, he ranked #22 in the (negative) gap between his overall OPS and his OPS vs. winning teams.
— His defensive WAR was much lower than his reputation, and he played for a long time after his D skills had really eroded. His last 6 seasons cost him -6.0 dWAR, which brought his career dWAR into the red.
— He also lost a lot of his batting skill after age 33. Over his last 8 years, Biggio’s OPS+ was 95 (compared to 124 before that), but he still played every day. That, plus the defensive erosion, gave him just 9.1 WAR over those last 8 years.
Biggio still looks real nice for a 5-year peak, and I support him for the Hall 100%. But he played a lot of years where he really wasn’t doing much to help the team, and that was never true of Whitaker.
Much appreciated! Thank you!!
John, as a Tiger fan who began following at age 7 in 1982, I thank you. I watched them religiously when they were on TV and saw a good number of games in person as well. It has always frustrated me to no end that Sandberg and Ozzie sailed in while Trammaker has been so overlooked. I personally don’t think at any time would the Tigers have traded Tram straight up for Ozzie. His problem was he couldn’t hit quite as well as Ripken nor field quite as well as Smith, but was very good at both. Lou was never flashy, but was steady and solid for a long time. Both guys also represented the team with class at all times. Hopefully the VC will correct this oversight when they get the chance.
This is a reply to Artie @10:
This is why I don’t take as much stock in ERA+ as I used to, because it’s not defense adjusted or opponent adjusted. I can’t find a way to use B-Ref’s strength of opposition metric for pitchers (RA9opp) to alter ERA+, but I’ve developed a method for a good approximation for a defense-adjusted ERA+ using the team defense metric RA9defense.
ERA+ = (lgERA/ERA)x 100, where lgERA is the ERA that a league average pitcher would have produced if he pitched in the same ballparks with the same amount of innings in each ballpark. B-Ref used to provide this lgERA mark on a pitcher’s player page but they no longer do. But it’s a simple task to just solve for lgERA by plugging a pitcher’s ERA+ and ERA into the equation.
Let’s use Jack Morris as an example, since his career ERA+ of 105 has been discussed quite a bit in the last couple of years and since Morris’ quality as a pitcher actually has something to do with John’s post.
STEP 1 – solve for Morris’ lgERA mark.
Simple enough. ERA+ = (lgERA/ERA) x 100. Plugging Morris’ marks of a 3.90 career ERA and a career ERA+ of 105, we get 4.095 as the ERA an average pitcher would have produced had he pitched in the same parks.
STEP 2 – compute how many runs Morris’ defenses saved him.
Not too tough a task either. RA9def says Morris defenses saved him 0.18 runs per 9. Over 3800+ innings, that’s 76.48 runs saved by team defense for Morris (we’re going to use fractional runs to make this approximation as accurate as possible).
STEP 3 – convert runs saved to earned runs saved.
Take Morris’ ER/R ratio (1657 ER /1815 R = .913, or 91.3 ER%) and multiply that by the defense-saved 76.48 R, and we can approximate that Morris’ defenses saved him 70 ER.
STEP 4 – add back ER saved from defense and compute new ERA+
Instead of allowing 1657 ER over his career, we can now estimate that with a league-average defense he would have allowed (1657 + 70) = 1727 earned runs over his career. His new ERA rises from 3.90 to 4.065. The rest is simple: just compute his new ERA+ using that new defense-adjusted ERA.
Jack Morris defense-adjusted ERA+ = (4.095/4.065) x 100 = 100.7 => 101 ERA+
It’s not perfect, but this seems like a good approximation.
Adjusting for team defensive strength suggests that Jack Morris’ ERA+ was almost perfectly average.
I’m too tired to do the other Tigers pitchers.
Using the same method as above, Jack Morris as a Tiger:
ERA+ = 108
ERA+ adjusted for team defense = 103
This is really cool bstar, thanks. I copied your method, and applied to someone who I knew would provide an interesting result: Jim Palmer (ERA+ 125). I ended up with a defence-adjusted ERA+ of 113, which, despite what I know about the Orioles defence, was still shocking to see. Does that seem like the right figure?
Thanks, RJ. Palmer was one of the first choices I was going to try also because of that fat +0.33 RA9defense. Yes, I get 113 also for Palmer. Some others:
Phil Niekro (-0.18 RA9def): ERA+ goes from 115 to 121
Rick Reuschel (-0.18 RA9def): ERA+ goes from 114 to 120
Whitey Ford (+0.24 RA9def): ERA+ goes from 133 to 124
Carl Hubbell (+0.23 RA9def): ERA+ goes from 130 to 122
To me, this illustrates how an over-reliance on a rate stat can cloud the evaluation of a pitcher’s career. Even if it were perfectly adjusted for defense, role, and opposition strength, ERA+ is just a rate stat.
The big problem is that rate stats underrate players who play a lot in their early 20’s AND late 30’s while overrating those who play a higher percentage of their career in their prime years. Instead of giving players credit for still being slightly effective late in their career, we tend to ding them because their rate stats don’t look as impressive as if they had just retired at age 35.
Ultimately, you can’t escape this:
VALUE = (rate stat) x (playing time)
IMHO, Rate stats are at least slightly overrated and playing time is underrated.
John:
Just a thought here that’s probably been stated somewhere in this thread or one of the other’s – I really believe the BBWAA has a tendency to dismiss the candidacy of the players who lack the 8+ WAR seasons. That’s not to say they even do any statistical analysis at all, let alone utilize WAR (or Win Shares or wOBA for that matter). But, ultimately, it’s the significant “peak” guys and significant single-season guys that the BBWAA puts in to the Hall. If they played for “winners”, that only serves to facilitate and expedite election. Their “analysis” is extremely subjective; almost to the point of being based solely on the “eye test”.
By the “eye test”, the most impressive seasons tend to be the obvious ones – high WAR/MVP-type seasons. I believe they will get the call to the Hall from the Veterans Committee in their own lifetimes.
Paul E, that’s generally a very strong analysis. But some decisions still don’t fit. Take Bobby Grich:
Big years? How about .294-30-101 in 1979? Or .304 with league-high 22 HRs and slugging title in 1981?
Respected in his time? 6-time All-Star, 5 times got MVP votes, 4 Gold Gloves, got one of the first big free-agent deals.
Winner? 5 division crowns, in 4 of which he was an All-Star or MVP vote-getter. #10 in wins started during his career (1970-86).
Career accomplishments? Retired at #11 in games at 2B, 4th in HRs, 12th in times on base, 13th in total bases.
Yet the voters yawned.
John:
So, basically, it’s the guys with singular skills that get the attention? But, they still have to be accumulators of power-(500HR), speed (700SB), batting averaqe (3,000 hits), fielding (multiple GG’s).
Well-rounded guys like Trammell, Grich, Raines, Beltran (?) are going to have to wait it out. By the same token, while Grich was appreciated by WAR and most knowledgeable baseball fans, he had a lot of .245 – .270 years that knocked him down a bit on the eye-test appreciation scale.
no offense JA but can we limit ourselves to one Trammaker discussion on the front page at a time?:
http://www.highheatstats.com/2014/01/how-trammaker-missed-the-hall-and-assorted-thoughts/
http://www.highheatstats.com/2014/01/pop-quiz-spot-the-hofers-by-standard-batting-ranks/
http://www.highheatstats.com/2014/01/dp-tandems-peak-war-and-career-patterns/
This is in addition to our continual COG discussion (with Whitaker headlining the top of the ballot for most of the past year or so), HOF vote turnaround, and general under/over appreciated conversations.
I do think though that I have a greater understanding of the differences between the two though. Trammel makes much more sense to a traditional HOF voter than Whitaker. If I had a vote I’d probably vote or Trammel, at least in his last year, but probably not Whitaker. Best year means a lot to me and Whitaker’s best year has got to be very close to the bottom of the HOF list.
mosc, I know that any single fact was easy to get lost in this long post. But Whitaker’s best WAR year is not “very” close to the bottom of the list of HOF middle infielders:
“Seven [out of 37] modern HOFers had best seasons below Whitaker’s: Red Schoendienst, Bobby Doerr, Johnny Evers, Travis Jackson, Luis Aparicio, Rabbit Maranville and Bill Mazeroski. Aparicio and Maranville were BBWAA selections.”
BTW, I’ll be happy to write on a topic of your choice. How much are you paying? 🙂
What happens if you take that “middle infielders” bit off and look at all position players?
mosc, since you asked: 42 of 146 HOF position players never had a season of 6.7 WAR, which was Whitaker’s high (1983 and ’91).
Here’s the list, in reverse chron order. The first 33 guys listed (through Bresnahan) were centered in the modern era:
Paul Molitor
Lou Brock
Bill Mazeroski
Luis Aparicio
Harmon Killebrew
Yogi Berra
Red Schoendienst
George Kell
Enos Slaughter
Bobby Doerr
Ernie Lombardi
Rick Ferrell
Bill Dickey
Lloyd Waner
Mickey Cochrane
Chick Hafey
Freddie Lindstrom
Gabby Hartnett
Jim Bottomley
Travis Jackson
Pie Traynor
Ross Youngs
High Pockets Kelly
Sam Rice
Edd Roush
Rabbit Maranville
Ray Schalk
Max Carey
Harry Hooper
Johnny Evers
Sam Crawford
Elmer Flick
Roger Bresnahan
Fred Clarke
Jake Beckley
Sam Thompson
Tommy McCarthy
Bid McPhee
Buck Ewing
Monte Ward
Deacon White
Jim O’Rourke
Molitor peaked at 6.2 WAR, Brock at 5.8, Mazeroski at 4.9, Aparicio 5.5, Killebrew 6.5, Berra 6.3 ….
Just starting from the bottom of the career WAR list:
Tommy McCarthy – 4.7
Lloyd Waner – 3.6
High Pockets Kelly – 4.8
Freddie Lindstrom – 6.4
Ray Schalk – 3.7
Rick Ferrell – 3.3
Chick Hafey – 5.0
Ross Youngs – 6.4
Jim Bottomley – 5.5
Pie Traynor – 4.5
George Kell – 4.9
Roger Bresnahan – 5.9
Lou Brock – 5.9 (his 1964 combo STL/CHC year)
Kiki Cuyler – 6.7 (ties Whitaker)
Rizzuto – 6.7 (ties Whitaker)
Sam Rice – 4.8
Max Carey – 5.1
Killebrew – 6.5
Molitor – 6.2 (I believe Molitor is the guy with the highest career WAR who falls into this category – I didn’t bother checking Ott or Brett or Frank Robinson or others way up there in career WAR because I’m pretty sure they had a season over 6.7 WAR)
I know those aren’t really inner circle guys, and most were not BBWAA selections, but they are HOFers. And Molitor is a direct contemporary of Whitaker’s.
There are also a number of guys who had one season above Whitaker’s best but then not much else. Whitaker had two 6.7 WAR seasons.
Manush – 7.3, 5.1
Cepeda – 6.8, 5.7
Tony Perez – 7.2, 6.0
Billy Herman – 6.9, 6.7, 5.7, and then never above 4.7 again
Nellie Fox – 7.9, 6.0, and then drops to 5.1
There are likely others in this category.
Eddie Murray actually has a pattern fairly similar to Whitaker (which makes sense, because he isn’t nicknamed Steady Eddie for his ups and downs) if seasonal WAR totals are ordered high to low:
7.0, 6.6, 5.6, 5.2, 5.1, 4.9, 4.4, 4.3, 4.1, 3.8, 3.8
6.7, 6.7, 5.5, 5.3, 4.7, 4.5, 4.4, 4.4, 4.3, 4.1, 3.8
Murray’s a tiny bit better on the high end, up 0.4 WAR in those top 11 seasons, but Whitaker has 4 more seasons above 3.5 while Murray’s next 4 seasons are 3.2, 3.2, 2.4, 2.0. Also, it’s nice that both had 3.8 in the 1981 strike season so that evens things out. Both likely would have had another season in the 5.2-5.7 range if they played a full season.
Great stuff, Artie. Two thoughts:
1) Is WAR fair to Lloyd Waner? From 1927 to 1930, he hit .355, .335, .353, .362, but totaled just 9.1 WAR. He didn’t add a lot of walks to those averages, and he had no home run power, but in ’29, he hit 28 doubles and 20 triples. His Rfield is positive (if barely) over that stretch, but he loses points for his position, even though he played center field almost exclusively.
I know the entire NL was hitting the cover off the ball at that time, but Forbes Field was basically neutral. I guess I’m just amazed that Little Poison’s 772 hits over that time only net him 36 Rbat, while Hack Wilson’s 744 hits net him 212 Rbat. A lesson in OBP and linear weights, I suppose.
2) As you and others have pointed out, Whitaker was basically Eddie Murray standing 50 feet to the right. That Murray’s Hall case had little resistance makes me wonder if we should stop blaming Sweet Lou’s consistent near-excellence and accept that Hall voters are only interested in offensive counting stats. Lou’s got a few more WAR and a lot more WAA, but 244 homers and 2,369 hits don’t speak to the voters the way 504 and 3,255 do.
That doesn’t quite explain Sandberg or Alomar, but Ryno’s MVP and tenure as face of the Cubs and Alomar’s defensive reputation and postseason presence do.
Bryan O’C, Forbes Field may have been fairly neutral overall, but it was a triples paradise — Pittsburgh routinely led the majors in triples before WWII, and did so in 3 of the 4 years you mentioned. So that dilutes the value of his 43 triples in that span.
And in those 4 years, the Bucs overall batted .305, .309, .303 and .303. Pie Traynor hit .350 in that span, Joe Harris .329, George Grantham .315, and of course Paul Waner .364. All those guys had OBP and SLG way above Lloyd’s.
When typing out those 11 seasons for Murray and Whitaker, I noticed that Whitaker had 15 seasons of 3.5+ WAR. And I thought “Well, I’m betting good players do things like that”.
No. There are only 17 players (position players) in history who have had 15 or more 3.5 WAR seasons. Every single one is an inner circle HOFer, depending on how one views Bonds and A-Rod. Whitaker is almost certainly the “worst” player of those 17 – other than him the worst is like Mel Ott or Rickey Henderson or Lajoie (or A-Rod, if you don’t like him).
Really. The list is: Bonds, Aaron, Speaker, Cobb, Mays, Musial, Ott, Ruth, Eddie Collins, A-Rod, Frank Robinson, Wagner, Henderson, Teddy Ballgame, Hornsby, Lajoie. And Whitaker.
The guys with 14 3.5+ WAR seasons (9 of them) are, chronologically: Bagwell, Ripken, Schmidt, Morgan, Brooks Robbie, Clemente, Mantle, Foxx, and George Davis. I feel pretty confident those guys are HOFers, despite what the current HOF voters think about what Bagwell may or may not have done because he didn’t look the same at 35 as he did when he was a rookie.
The guys with 13 3.5+ WAR seasons (8 of them): Chipper, Molitor, Yaz, Eddie Mathews, Gehringer, Gehrig, Roger Connor, and Dan Brouthers.
The guys with 12 3.5+ WAR seasons (18 of them):
Pujols, Jeter, Manny, Palmeiro, Larkin, Boggs, Ozzie, Brett, Reggie, Bench, Rose, DiMaggio, Appling, Waner, Sam Crawford, Bobby Wallace, Fred Clarke, and Anson.
There are 52 people up there with 12 or more 3.5+ WAR seasons. All are in the HOF except: Rose (not eligible), Pujols, Jeter, and A-Rod (Active), Manny and Chipper (not on ballot yet), and Bonds, Bagwell, and Palmeiro (kind of “clear” what the issue is with those guys – at least it’s clear to voters what Bagwell did, even if it’s not clear to everyone else). And Whitaker. If there were no steroid issues (or gambling issues) I have no doubt every one of those guys would be in.
It’s at the 11 season mark that things get muddied:
There are HOFers in there (Murray, Kaline, Reese, Vaughan, Cronin, Heilmann, and Beckley), a guy who will very likely get in quickly (Griffey), a guy who just got missed from the early years (Dahlen), and a bunch of recent guys (Beltran, Rolen, Thome, Trammell, Buddy Bell, and Grich). And Bob Johnson, though that was basically Johnson’s entire career (2 more years at 3.0 and 3.1 WAR).
And so, getting 15 3.5+ WAR years is not really that easy. For some reason I really thought more players would be at that level, but it’s just not so. Think about it – playing for 15 years at 3.5 WAR a season, without ever going above that level, is 52.5 WAR for those years. That’s basically the same as McGriff’s career WAR (52.6) – and people want him in the HOF. It’s more than Cepeda’s career WAR (50.1). It’s more than Lazzeri (50.0) or Nellie Fox (49.0) or Johnny Evers (47.8) or Jim Rice (47.2). That’s a heck of a base to start from.
Can someone explain to me the WAR calculation from components again? I am sitting here scratching my head about Ozzy Smith’s 47.9 OWAR. I look at his historically terrible 1979 season where he put up a .211/.260/.262 line good for -35 RBAT (which seems about right) but his OWAR is -0.1. He stole some bases (rbase 5) and stayed out of some double plays (rdp 1) fine but how do I add that up to a replacement level shortstop assuming average defense (-0.1 oWAR)? I don’t see RBAT roughly equal to RPos+Rbase+Rdp to give a roughly neutral oWAR.
So he’s a below average player in 1979 (WAA = -0.5) which is what I agree with but I don’t understand why his oWAR is not much lower. OWAR is not doing what I want it to do.
mosc: add the replacement runs (Rrep for Ozzie in ’79 was 21 runs) to your run tally. I get +2 RAR for Smith with Rfield zeroed out. That’s the figure shown on the far right column (oRAR).
Add in the replacement player runs and I think you get what you want.
RPos+Rbaser+Rdp+Rbat+Rrep=10+5+1+(-35)+21=2. It’s probably not really 2 from rounding.
ok, I guess that explains the math but that seems like a peculiar figure. It’s saying the difference between replacement level and average is 21 runs a season so ozzy gets 1.6 WAR for a year where he had -35 RBAT. I guess the positional corrections are not working like I thought. “replacement level shorstop” I thought was a 10 run bonus when in fact it’s a 31 run bonus for ozzy that year (between replacement and league average). First base would have the same replacement but a negative positional adjustment for something like an 11 run bonus. I’m not sure why these two fields were separated but at least I understand what they’re doing now.
Simplistic but sums it up nicely
http://millingtonnews.net/Baseball%20Pix/alan_trammell_career_statistics.htm
Pffftt the real the tigers were good was because jack Morris could pitch to the score.
At the risk of being slightly controversial and without any (or maybe much) support for this statement, it seems to me that the BBWAA has been rather harsh with Tiger players in general over the years. Gehringer and Greenberg took several elections to get in (and if they aren’t first ballot HOFers, I guess I am confused as to who is). Freehan. who really is a borderline candidate for the HOF, got booted in the first election by the BBWAA.
Again, this is without a lot of research on my part, but in general, it seems that when a Tiger candidate really doesn’t need discussion (outside of Cobb and Kaline), the HOF discussed them for a few years (Greenberg, Gehringer, Heilmann) and guys who seemed to merit mulling over at least for a few elections (Freehan, Whitaker) didn’t even talked about at all. Heck even “Mr. Tiger” only garnered 88% of the vote when he was elected first ballot which seems low for someone who seems to mee the usual standards the BBWAA likes (hit a milestone or two, play for one team to the point that they call you Mr. Tiger)
I could be totally off and someone could probably point to a number of examples that contradict my thinking.
Brent, I think there’s enough evidence to call it a pattern. Don’t forget Sam Crawford, elected in 1957 by the V.C. — 21 years after the first HOF class. At the time of his election — 40 years after he quit — Crawford was still #9 in career hits, 18th in RBI, 14th in Total Bases … and (of course) 1st in triples. WTF were they doing all those years?
I totally support Freehan for the Hall, along with Simmons and Munson. Freehan, 11 time All Star, 5 Gold Gloves, 200 dingers, World Champ! The Hall would be smart to lobby for these 3 catchers inclusion.
ArtieZ @ 39. . Great post . That is why Lou is the poster child for consistency. For those who value high peak over consistency , you can use all sorts of math to give extra points to peak , and move Lou down the list of all time 2B . His WAR total must be 6 th or so among 2B , and he wasn’t a compiler , basically a contributor to the end – he has no chance to get the recognition IMHO he deserves.
If you use WAA to define peak, Whitaker outclasses all of the second basemen currently on the holdover list. Here’s their WAA and Adam’s HOS scores, which uses WAA as peak:
Lou Whitaker – 42.4 WAA, 142 HOS
Ryne Sandberg – 38.1 WAA, 128 HOS
Roberto Alomar – 32.3 WAA, 124 HOS (will be back on ballot soon enough)
Craig Biggio – 28.5 WAA, 125 HOS
Great quartet of second baseman! I prefer WAA as well- it seems more logical to me.
“Poster child for consistency” — There are 166 non-pitchers with 17 or more years of 40+ games played. (Whitaker has 18.) Of those 166, these 7 earned at least 1.5 WAR in all of those years:
Roger Connor
George Davis
Babe Ruth
Joe Morgan
Lou Whitaker
Barry Bonds
Chipper Jones
Morgan and Davis both had a year with negative WAA while playing regularly. Whitaker (and the rest of the list above) never did.