
Run scoring and such have dropped since the peak of the Steroid Era, but at least for now, the face of the game remains unchanged. Although homers have dropped off some, three other events–triples, intentional walks, and sac bunts–continue to hurtle towards extinction.
Here’s the simple ratio of HR per game to the sum of those other three events. Suddenly, 2013 is looking more like the offensive peak years of 1999-2000.
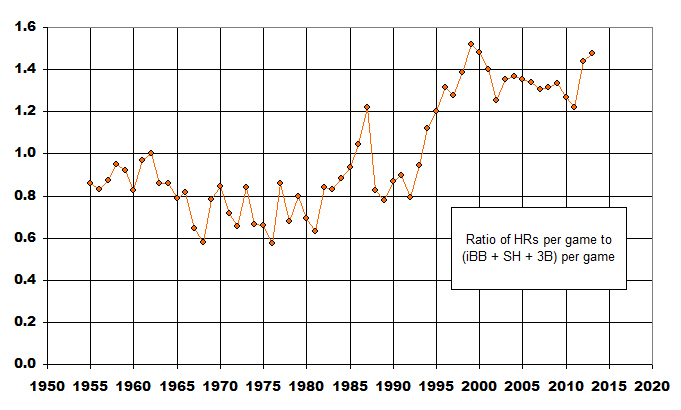
First, yay!
IBB and acrifices have probably declined because of the gradual acceptance of the advanced-stats belief that deliberately putting runners on base, or giving up outs, are stategies that should be avoided,and used very selectively.
Triples have continued their 120-year trend of decline -tougher to assign reasons. Perhaps because runners are in general less reckless, fielders are more surehanded (higher fielding %’s) and defensive OF positioning is better?
Triples have decreased largely, I think, because ballparks are smaller, so more fly balls or deep line drives end up as doubles, homers, or outs, and also because defenders are both better positioned and faster.
I’d add that the newer parks are not only smaller but less charming/quirky asymmetric. Fewer weird places for the ball to go. And, as a small factor, your lumbering outfielder is spending more time as a DH.
@33/Mike,
Good point about asymmetrical parks. Fewer parks like Fenway with the Triangle/sharpy angled RF stands, or Wrigley with the ivy. Though the Houston park (what are they calling it this year?) has the sloped OF.
What’s the weirdest ballpark playing surface quirk in MLB history? Didn’t several 19th entury parks have trees in play, or absurdly short OF walls? (I think the 1884 Cubs had a RF OF wall less than 200 feet, in which fly balls over it were called doubles previously, but in 1884 became HR’s. Hence, Ned Williamson’s record 27 HR.)
I don’t entirely agree—it’s true that really bizarre things like what you mention no longer exist, but ballparks today are more varied than in the era of cookiecutter stadiums in the 70s and 80s.
Most of the cookie cutter parks had the old, hard Astroturf during their heydays, and that caused a lot of high bounces over an unprepared outfielder’s head, as well contributed to a lot more balls shooting through the gaps to the wall… both of which are conducive to more triples. If the centerfielder was playing towards the gap in a park with turf, you could easily hit a hard ground ball to the opposite side of the second base bag that would end up going all the way to the wall for an easy triple. I’d say the phasing out of Astroturf during the 90’s had to be a huge factor in lowering the number of triples…
The lack of high-speed slap hitters in the game today might be a contributing factor to the decline of triples. I’m talking about the Willie Wilson/Mickey Rivers/Brett Butler type of hitter.
Also, no Astroturf in today’s outfields may be preventing some of the slower-hit balls from getting past the outfielders and reaching the wall.
Runners do seem less reckless. The average of Outs On Base per team (which does not include CS):
1973 — 72
1983 — 69
1993 — 67
2003 — 57
2013 — 53
@8 John A. I wonder if the higher levels of Outs on Base was related to the lower scoring and more station to station environment. You are more likely to send the runner if you think the following hitters have less of a chance of batting him in. There’s also about a 40% increase in HRs from 1973 (a high year as it was) to 2013.
Mike L, if you’re saying that “recklessness” is not the best term to describe baserunning trends, I’ll broadly agree.
But the downward trend in baserunning outs these last 40 years does not seem to respect scoring trends. A baserunner in 2013 was much less likely to score by cautious means than a runner in 2000, given the difference in scoring (4.17 R/G last year, 5.14 in 2000). But baserunning outs were much more common in 2000 than 2013 (61 to 53 per team).
And baserunning outs in 1968 were slightly less common than in 1973. That doesn’t fit the context model, either.
So I think the modern trend reflects more than just the offensive context. I think it also shows a growing acceptance of the general cost of an out, regardless of scoring context.
JA I think you are spot on, and your last paragraph there sums it up perfectly. It’s a long process for the thinking of manager and coaches to change, because I think no matter what’s written on the page (advanced stat-wise), ultimately their thinking has to shift before they change their in-game practices. This requires suggestions that another strategy might be better, and a slow evolution of both game results and the way they think about it.
I wonder if interleague play has helped the IBB and Sac declines. That’s about when the spike occurs, and I find it more likely that an NL manager would change his game when in an AL park than an AL manager would be to change his in an NL park.
Re: Triples
When batters waste half a second getting out of the box admiring their long drives in the left-center alley, they are always going to end up on second base.
In the era of fewer and fewer triples, third base coaches have become less likely to wave a runner on from second. A triple is generally risky, too, and the game has quite possibly grown more cautious, as the mindset has change to adapt to the era of HRs, SOs, and to hell with playing for a one base advantage.
Scoring from 2nd on a single was on a long downward trend from 1968-2010, but has picked up a tad since then:
1968 — 69.3%
1973 — 67.5%
1983 — 66.0%
1993 — 62.7%
2003 — 60.2%
2008 — 58.6%
2010 — 58.4%
2012 — 59.3%
2013 — 59.8%
There’s also too many hitters in today’s game who pull up immediately after passing first base on their way to second, invalidating their chance at a triple from a weird bounce off the wall. I’m looking at you, Chipper Jones (even when he was young!).
Carlos Beltran is the active career leader in outfield assists with 132. That makes him 175th all time. Tris Speaker leads with 449, and 52 players have had at least 200. Of those 52, I believe the collective HHS readership has seen exactly two play–Clemente at 266 (17th), and Aaron at 201 (51st). Mays and Yaz are at 195. Of players who’s careers ended as late as the 1990s, only three in the top 100: Barry Bonds at 173 (81st), Winfield 166 (93) and Barfield 162 (98th). Of players expected to play in 2014, besides Beltran, only Francour, Hunter, and Ichiro have even broken 100 assists.
The major driver here, of course, is that teams have learned to stop running on the guys with good arms. I believe this started becoming quite popular in the early 2000s. I remember Pat Burrell as an example of a guy who recorded tons of outfield assists, and then suddenly his totals dropped drastically, because teams figured out that he had a good arm, and “better safe than sorry” they just stopped running on him. So while his assist totals plummeted, so did his assist opportunities. This also happens with pickoffs. Guys like Pettitte and Mulholland–lefties with deadly pickoff moves–saw big drops in their pickoff totals as their careers went on because teams just stopped running on them. Both of these scenarios (OF assist and pickoffs) got to this strange place where we are now where guys who are slightly below peak skill are getting the highest totals.
Although I agree with your comment generally, I think the phenomenon you describe is not entirely new. Whitey Ford’s pickoff motion was so devastating that, after it was recognized for what it was, almost no one tried to steal on him, and Carl Furillo, the Reading Rifle, saw his assist totals drop for the reason you outline here. Mays is slightly different, since his assists declined around the time the Giants moved from the Polo Grounds, suggesting that a large garden to patrol may increase outfield assist totals, for obvious reasons. Clemente played most of his career while the Pirates hosted in Forbes Field.
In 1961 Ford pitched 283 innings without having a base stolen off him. That is the third most IP since 1945, bested only by Hal Newhouser in 1945 and 1946. Ford had 4 qualifying seasons with zero SB, the most of any pitcher since 1945. Only 4 other pitchers had as many as 2 such seasons.
RC:
I’m fairly certain those stats for base-running against Newhouser are incomplete. They certainly are for 1946.
@20
nsb: I checked Newhouser’s box scores for 1945 and 1946. There were SB while he was pitching, so Ford becomes the leader from 1945 on.
@17 Andy, I agree with you, but I’m also surprised that what should be a rather elemental observation didn’t happen earlier. I can’t think of any other counting stat where the active leader is so far away from historical norms. It’s not unreasonable to infer as a contributing factor that an older culture just sent players more often as well.
I know, right? Who would’ve suspected that for a hundred years, baseball managers simply followed conventional wisdom as handed down by the previous generation?
Also I just went back and looked at Burrell’s OF assist totals, and I’m wrong. His numbers bounced around a lot. 18 in his first full season put the league on notice, but he still put together later seasons with as many as 10 or 12.
I’m not sure the notion of not running on good OF arms stands up to inspection.
Jeff Francoeur’s arm has been well known since his 2005 debut, when he was #1 in RF assists in just half a season. Yet when he’s played regularly, he’s always been #1 or #2 in his league for RF assists — 8 straight years, 2005-12 — and in 2012 matched his career high with 19.
Alex Gordon has led all LFs in assists all 3 years he’s played full-time there. Gerardo led the NL in assists in 2011, and again last year. Jose Bautista had a great rate in 2009 (11 in 79 games), and has continued ever since, averaging 17 per 150 games the last 3 years.
I think this is because most assists come on base hits, not tag-ups. On hits, the runner has less time to think about who’s out there; his decision turns mainly on where the ball was hit, and the game situation.
It looks like there is some evidence that baserunners do attempt to advance less on big arms. Here’s advanced fielding data for five big AL RF arms:
Held % = Helds / Advance Opporunities on hits or flyouts
Player: Held %, MLB avg Held %, % increase above avg.
Francoeur (’05 – ’13): 50.7%, 47.1%, +3.6%
Ichiro (’01 – ’13): 51.0%, 46.7%, +4.3%
Bautista (’04 – ’13): 51.6%, 46.9%, +4.7%
A Gordon (’10 – ’13): 66.9%, 63.8%, +3.1%
B-Ref doesn’t list MLB averages for advances on hits vs. advances on flyouts separately, so I can’t parse whether baserunners hold on flyouts more often than on hits vs. big arms.
What’s most interesting about that data is how Alex Gordon’s 2010-2013 MLB average is in the 60s while all others who started their careers earlier have MLB averages around 45-50%. This strongly suggests baserunners aren’t running on arms big or small with as much frequency.
Mike L: I’m not fully convinced he’s still active but Mark Kotsay has 123 career outfield assists.
Kotsay retired at the end of last season. He struck out in his final at-bat, coincidentally the last pitches Barry Zito threw in a San Francisco uniform.
Recent trends in Stolen Bases are interesting. I don’t know how to post an Excel chart in a comment, but I’ll describe it. Since 1953:
— SB attempts per game rose steadily into the late ’70s, then stabilized around 1.15 SBA per game through the early ’90s, a very high level for the live-ball era.
— From 1993-2005, they steadily declined to 0.75 SBA/G, the lowest since 1971.
— From 2006-11, SBA/G climbed back up to 0.93, where they were in 2001 — but still the 2nd-lowest mark since 1974.
Those last two points are consistent with the idea that steal attempts broadly respond to scoring levels. However:
— In 2012-13, as scoring reached its lowest point since 1992 (4.17 R/G), steal attempts reversed their recent trend and fell back to 0.76 SBA/G.
The change from 2011-13, minus-0.17 SB/G, is the largest 2-year decline in the entire period of 1953-2013, and the 3rd-largest change in absolute terms.
Two years is not enough to form conclusions. And strategy is based on personnel as much as on offensive context. Some commentators have said that, with scoring continuing downward, teams have given preference to pure power hitters (though I haven’t studied that claim).
But the 2-year trend in SBA is interesting. And a great time for Billy Hamilton to get his shot.
JA, take a look at success rates on stolen bases, too. Way, way up over time.
Andy, SB% indeed has climbed dramatically — but that recent trend is also interesting.
1) In 2007, SB% reached an all-time high of 74.4%, and stalled. The average for the last 6 years is 72.8%, which is the same as the 2013 rate.
2) While 2013 is just one year, the fact that success rate fell (74.0% to 72.8%) while attempts also fell sharply (0.89 to 0.73 per game) seems odd.
As you say, just one year.
But, if the decline in attempts is because runs have become a bit dearer, then the opposing manager may be better able to judge when the runner is likely to go. Thus, as an example, the opposing manager may do better at picking the right pitch for a pitchout, and this could be responsible for a reduced success rate coupled with a reduced attempt rate.
BTW, to insert an image into a comment, edit the comment, then click “img” and indicate the URL for the image. For example, here is Andy’s chart inserted into this comment.

Also, success rates on straight steals are hard to gauge historically, because SB data include straight steals and hit-and-run. I think we’d all agree that the use of hit-and-run has plunged as swing-and-miss rates soared — but without actual numbers, it’s hard to know how much the success rate on straight steals has actually changed.
Wow, this is a great point of which I’d never thought–that attempt rate probably does correlate with K rate, and that hit-and-run SB attempts probably have a historically lower success rate than straight steal attempts, meaning that if the decline in attempts is due largely to decline in hit-and-runs, then that alone would tend to cause an increase in SB success rate.
Astounding inference there, JA.
Generals tend to fight the last war, and managers may be influenced in their strategy by the era they played in (and learned the game in.)
Here’s some interesting numbers–these are four power hitters who had some or all of their careers in the 1920s/30s. They are AL because there’s no CS info on NL players.
Babe Ruth 123 SB, 117 CS
Lou Gehrig 102 SB, 100 CS
Jimmy Foxx 87 SB, 73 CS
Al Simmons 88 SB and 65 CS
What were these guys doing stealing?
But, by the mid 1930’s, after Ruth changed the power game and the rabbit ball Era, managers started to adapt and send the players less. By the 1950s, if you managed 20 steals you were probably in the top three of your league.