South Wind Blowing: Return of the Lefty

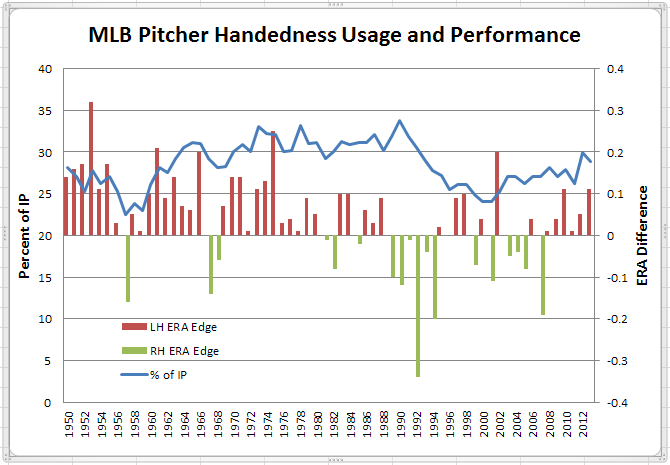
After a lengthy period in the wilderness, lefties are once again in vogue in the majors. The chart below shows the difference in ERA for left-handed and right-handed pitchers. When lefties have the edge, the bar is brown and for righties the bar is green. 2013 was the 6th straight season that left-handers have outshone righties in ERA, albeit by small margins. Perhaps in consequence, innings for left-handed pitchers (the blue line) are also on the rise.
Pitcher Handedness Results 1950-2013
More on the change in southpaw fortunes after the jump.

As is evident from the above, lefties have (at least since 1950) produced superior ERA results to right-handers, with the exception of the 1988-2007 period when right-handers held the upper hand. For the most part, usage of left-handers in terms of proportion of innings pitched has followed their changing fortunes pretty closely.

Breaking down the data a bit further, the source of the left-handers’ advantage comes into view. Here are the same data, but only for plate appearances when the pitcher has the platoon advantage.
Pitcher Platoon Advantage ERA
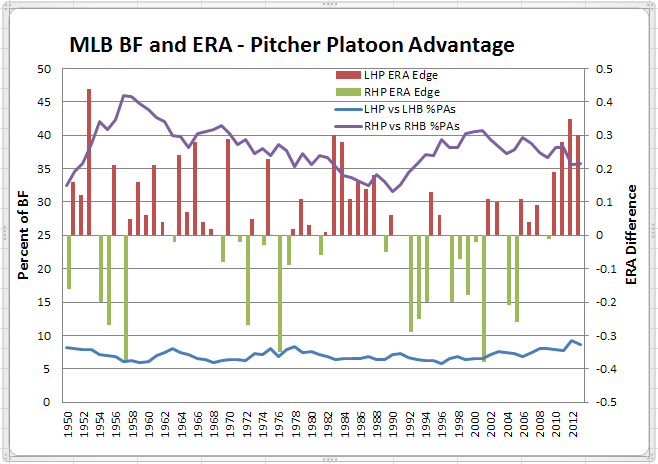
So, mainly following the same basic trend as for overall data, but with more significant differences in ERA. Of note is the decrease in RHP vs. RHB matchups (mid-1950s to late-1980s) coinciding with left-handed ERA dominance, and then the following increase in RHP vs. RHB matchups coinciding with the period when right-handers enjoyed an ERA edge. For the most recent period, RHP vs. RHB matchups have started to trend down again while LHP vs. LHB matchups are on the rise, the latter due partly to increased use of situational, left-handed relief pitching.

But look what happens when the batter has the platoon advantage.
Batter Platoon Advantage ERA
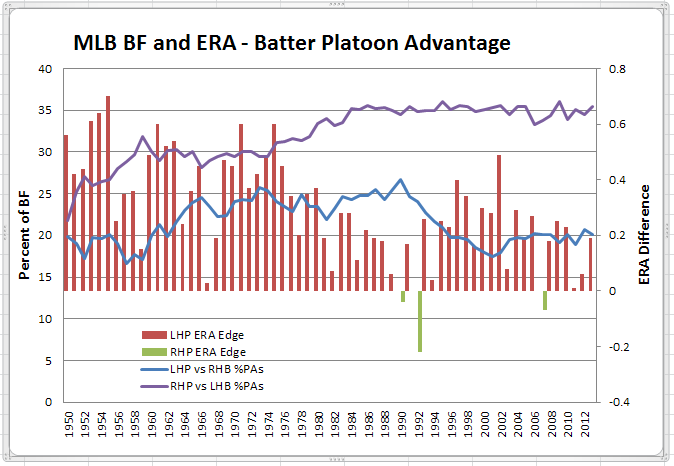
Lefties clearly have the upper hand on righties when facing a platoon disadvantage, though the magnitude of that ERA edge has declined since the 1970s, likely as a result of the advent of modern relief pitching practices. It is worth noting though that from the 1950s to the mid-1960s, managers were increasingly employing strategies to increase opportunities for batter platoon advantage from both sides of the plate. That left-handed pitchers evidently coped better with that challenge than right-handers is reflected in the following mid-1960s to mid-1980s period when the focus on increasing batting platoon advantage was mainly for left-handed batters.

Since the mid-1980s, the platoon strategy has shifted focus from the offense to the defense by reducing the instances when pitchers face a platoon disadvantage. But, only for left-handed pitchers. That practice has reduced the ERA edge that left-handers have historically enjoyed over right-handers, but one wonders whether a better result might have been obtained by also trying to reduce instances when right-handers face a platoon disadvantage. Instead, those RHP vs LHB matchups have remained unchanged at historic maximums for the past 30 years.

Delving further, let’s zero in on starting pitchers as their innings pitched represent the bulk of the effect seen in the preceding charts. The chart below shows the percentage of innings pitched by left-handers as bars, with the two lines representing the percentage of qualifying starters with 100 ERA+ that are left-handed, as well as the percentage of qualifying starters with ERA+ below 100 that are left-handed.

LHP Proportion of IP and Starting Pitchers

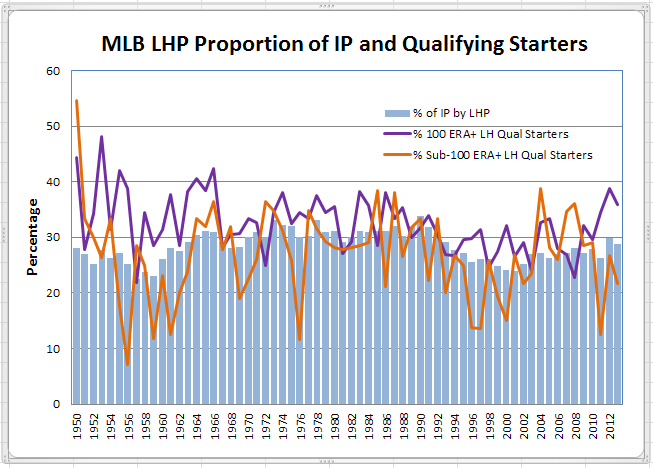
For the most part, left-handers comprise a larger proportion of the better pitchers than of the lesser pitchers. Further, the proportion of better pitchers who are left-handed is generally higher than the proportion of innings pitched by left-handers. This result is logically consistent with the earlier charts showing left-handed pitchers out-performing right-handed pitchers in most seasons.

Focusing in on the better starting pitchers with qualifying ERA+ of 100 or more provides this view.

100 ERA+ Qualifying Starters by Handedness

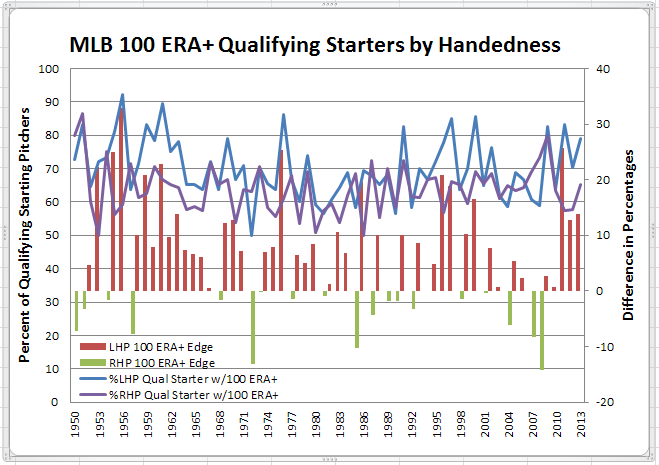
The two lines show the percentage of left-handed qualifying starters with an ERA+ of 100 or more, and the percentage of right-handed qualifying starters with an ERA+ of 100 or more. Generally, there is a larger proportion of left-handed starters who are better pitchers than of right-handed starters. To make that more evident, I’ve shown the difference between those percentages as bars. Thus, the brown bars show when the left-handed proportion is higher and the green bars when the right-handed proportion is higher.

Finally, let’s focus on the very best pitchers. For that group, I’m looking at qualifying starters with an ERA+ of 115 or more. The same chart as above, just using 115 ERA+ instead of 100 ERA+. 

115 ERA+ Qualifying Starters by Handedness

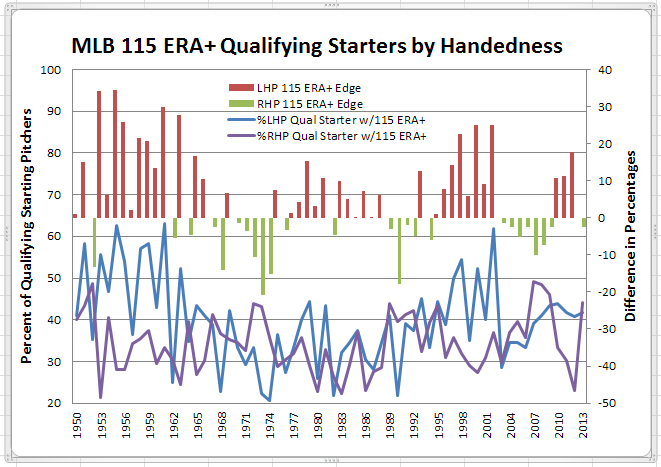
A bit more encouraging for right-handers, but only a bit.

0 0 votes
Article Rating
Subscribe
Notify of
guest

16 Comments
Oldest
Newest Most Voted
Inline Feedbacks
View all comments
John Autin
Editor
10 years ago

Great idea, Doug. Much to digest here … One thing occurs to me: The platoon-split analysis of pitchers is complicated by the fact that left-handed batters seem to have an inherent edge over RHBs. For the period studied, LHBs have averaged +.009 in BA and +.028 in OPS compared to RHBs. But that difference waxes and wanes, and recent years have seen a much smaller difference between LHBs and RHBs. Looking at rolling 5-year averages, the years 2009-13 saw just a .002 LHB edge in BA, the smallest of any such period in the study, and a .014 edge in… Read more »

Voomo Zanzibar
Voomo Zanzibar
10 years ago

Regarding switch hitters: In 1950, there were only three switch-hitters in the game, Sam Jethroe, Dave Philley and Red Schoendienst. But when Mickey Mantle came to the big leagues in 1951, everything changed. Switch-hitters became far more prevalent. In 1992, 17.2 percent of all non-pitchers were switch-hitters. “My dad made me a switch-hitter because he loved Mickey,” said Carlos Baerga, a second baseman who played 14 seasons in the majors. “A lot of dads did that.” ________ And there’s this explanation from Ted Simmons: “Some kids are just so pitiful as hitters, they would miss the slider by 10 feet,… Read more »

Richard Chester
Richard Chester
10 years ago
Reply to  Voomo Zanzibar

It looks like, in 1950, there were three qualifying switch-hitters in the game, the three that Voomo mentioned. In all there were 17 such players, 5 position players and 12 pitchers. The other two position players were Jim Russell and Ken Silvestri.

Voomo Zanzibar
Voomo Zanzibar
10 years ago

5 position players and 12 pitchers.
That seems bonkers.

I looked at the pitchers.
Three good ones.
Early Wynn, Robin Roberts, J Vander Meer.

Voomo Zanzibar
Voomo Zanzibar
10 years ago
Reply to  Doug

That is definitely a consideration.
More danger, though, of getting hit on your pitching arm.

Richard Chester
Richard Chester
10 years ago
Reply to  Doug

Since 1974:

RHP vs. RHB, 9.56 HBP per 1000 PA
LHP vs. RHB, 4.94 HBP per 1000 PA
RHP vs. LHB, 4.99 HBP per 1000 PA
LHP vs. LHB, 10.01 HBP per 1000 PA

And despite the huge increase in the number of switcher-hitters in recent years, the HBP rate has increased dramatically.

Voomo Zanzibar
Voomo Zanzibar
10 years ago
Reply to  Doug

There seem to be a lot more players in the last generation: * crowding the plate * hitting aggressively regardless of the count * wearing armor … and the drugs of the last generation probably have something to do with it. Anti-anxiety pharmaceuticals plus steroids make for a much more comfortable presence in the box than tweaking on speed (the ballplayer drug of choice for many generations). Also, and this might seem like backwards-logic… but maybe there are also more HBP because pitchers are throwing at batters LESS than they used to. Hitters are more comfortably crowding for all of… Read more »

John Autin
Editor
10 years ago

Doug, here’s something I think is really interesting. This chart of batter platoon edges uses rolling 5-year averages: Lefty batters historically have a much bigger platoon split than righties. But as the chart above shows, RHBs had a bigger split for a fairly brief period, late-’80s through mid-’90s. This roughly coincides with the period on your first chart in which righty pitchers consistently had a better ERA than southpaws. Meaning? Also interesting is that the size of the LHB platoon split had a long decline from the early ’60s through the mid-’90s, then started back upwards. Don’t know what to… Read more »

Voomo Zanzibar
Voomo Zanzibar
10 years ago
Reply to  John Autin

Noticed this about Dennis Martinez, while looking at the ERA leaders:

WAR by age

10.1 … 22-32
41.4 … 33-42

Voomo Zanzibar
Voomo Zanzibar
10 years ago
Reply to  John Autin

From 1989 – 2005, a lefty led the majors in ERA only once.
The Big Johnson in 2001.

John Autin
Editor
10 years ago
Reply to  Doug

Doug — Yes, my chart shows the net OPS advantage for each set of batters when they had the platoon advantage. So, for LHBs, it shows (LHB vs. RHP) minus (LHB vs. LHP). And for RHBs, (RHB vs. LHP) minus (RHB vs. RHP).

mosc
mosc
10 years ago

This seems to support the conventional platoon split wisdom. Righties hit righties much better than lefties hit lefties. The more lefty pitchers in the league, the more you want right handed bats. The fewer lefties in the league, the more that platoon advantage of the left handed bat gets appealing.

trackback

[…] pitcher has the greatest drag on scoring, whether by gaining a platoon edge (see Doug’s recent study), or simply by being at top […]