
How is WAR contributed by major league pitchers? At what age do pitchers become most valuable to a team? I’ll be looking at those question in response to a suggestion by mosc, a regular and thoughtful contributor to our discussions here at HHS.
More after the jump.
To investigate those questions, I’ve captured total FanGraphs WAR by Age for each season since 1901. Here is how WAR has been shared by age since 1901.
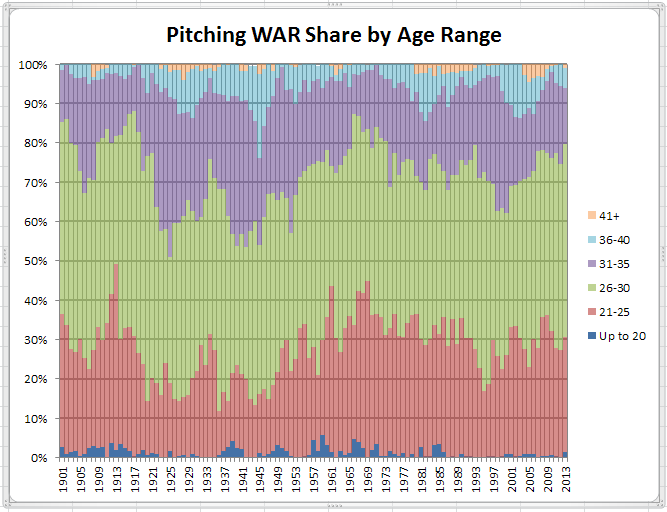
Obviously some variation over the years, but more consistent for the post-war period when, with few exceptions, there has been at least 20% of WAR from 25 and under pitchers, at least 70% from those 30 and under, and at least 90% from everyone 35 and younger. Looking at the present period, it’s worth noting that, for the first time in 40 years, there have been 7 consecutive seasons with 75% of WAR coming from pitchers aged 30 and younger.
But how does the share of WAR by pitcher age compare to share of innings pitched by age? Those two quantities are illustrated below.

They track closely because, regardless of age, there is a standard that major league pitchers must attain. And, it can be a very small difference between that standard and stardom or, conversely, between the standard and obscurity. We’ve all seen it – a pitchers loses a bit off his fastball or his slider doesn’t have quite the bite it once had and last year’s All-Star is suddenly back in the minors.
That said, while the WAR and IP shares are quite close, they aren’t identical. And, if you look closely, you’ll see that the IP Share bars are higher for the younger ages while the WAR Share bars are higher for the older ages. It’s that difference that I want to study. To do so, I’ve derived the metric WAR Contribution as:
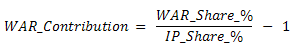
Thus, WAR Contribution, when calculated for each age, shows in percentage terms how much more or less WAR value was contributed by pitchers of that age relative to their share of innings pitched. A negative value means those pitchers had a lower proportion of WAR than of IP. Positive means the opposite.
Here’s what those result looks like, shown as vertical bars, with an overlay of the WAR per 100 IP for each age.
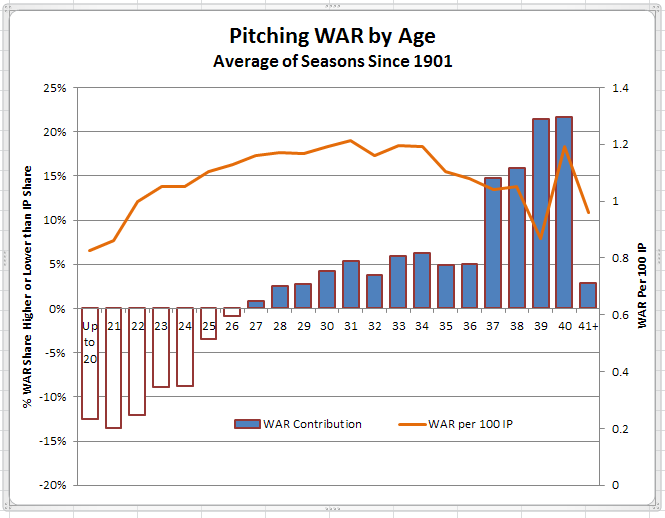 What are these results telling us? First, as with many investments, patience will be needed before young pitchers start to return positive dividends. But, once they do, those returns continue to grow through most of the rest of the pitchers’ career. Looking at the WAR per 100 IP line shows a value between 1.0 and 1.2 for most of a pitcher’s career, translating into a range of 2.0 to 2.4 WAR for the average pitcher in a 200 IP season.
Why is there such a big move up in WAR Contribution with pitchers in their late 30s? Intuitively, one might think the returns would diminish as pitcher performance declines with advancing years. What is happening, though, is selection bias. What I mean by that is that, as pitchers age, their “replacement level” rises. For example, a team may give 150 innings to a 22 year-old with a 5.78 ERA because it’s an investment in the future returns from that pitcher. There won’t be the same tolerance for a 37 year-old with that ERA who will be judged as not having positive future returns and will thus be replaced before he can accumulate those kind of innings. Thus, as pitcher age advances, and especially with the older ages, the bulk of the innings will be contributed by smaller numbers of mostly better pitchers.
Here are the same results, broken into different eras. Because we are looking at shorter time periods, there is more susceptibility to distortions at the margins due to representation of small numbers of pitchers and, thus, small proportions of IP. When the IP Share number is small, even small differences between it and the WAR Share number can result in big differences in WAR contribution, a mostly illusory result. With that caveat:
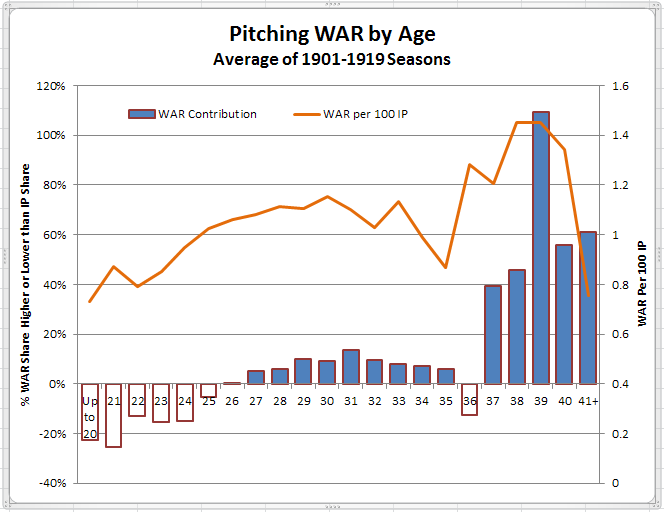
The dead ball era shows fairly consistent results with the overall pattern. The dip at age 36 is most likely anomalous.
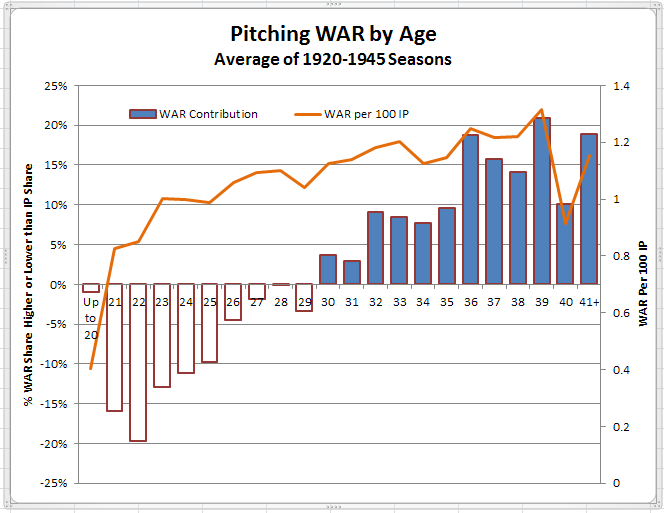
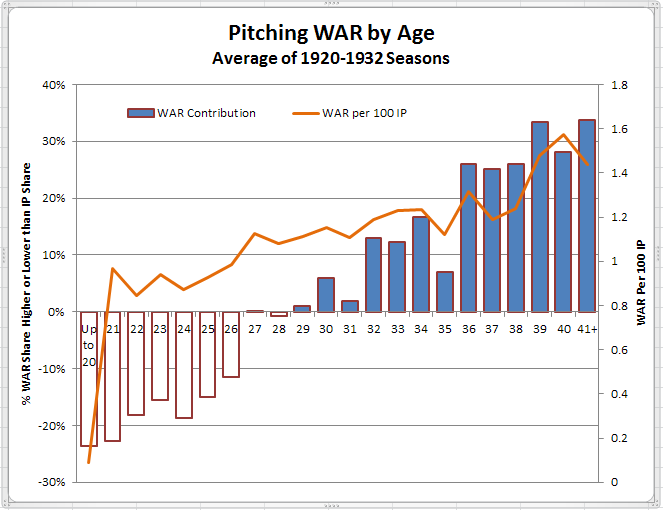
Younger pitchers had particular difficulty facing the heavy hitters of the 1920s and 1930s, with positive results not being seen until age 30. While WAR results are normalized to the era, thinking in human terms, it was probably harder for young pitchers in this era if only because of the psychological effects of being pounded on by the likes of Ruth, Gehrig, Foxx, Greenberg and so many others.
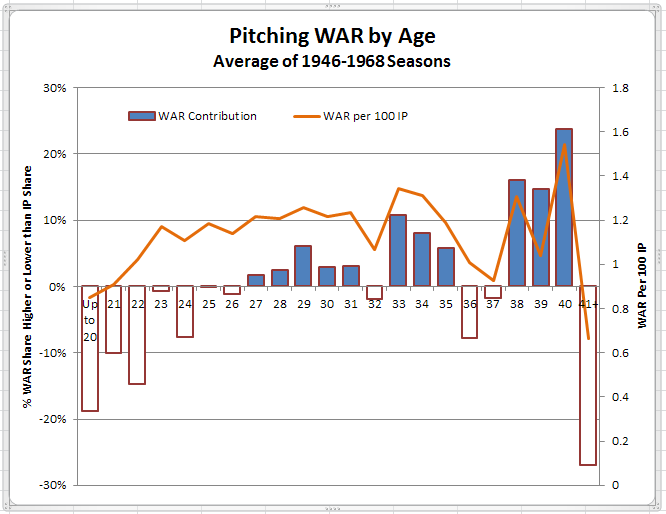
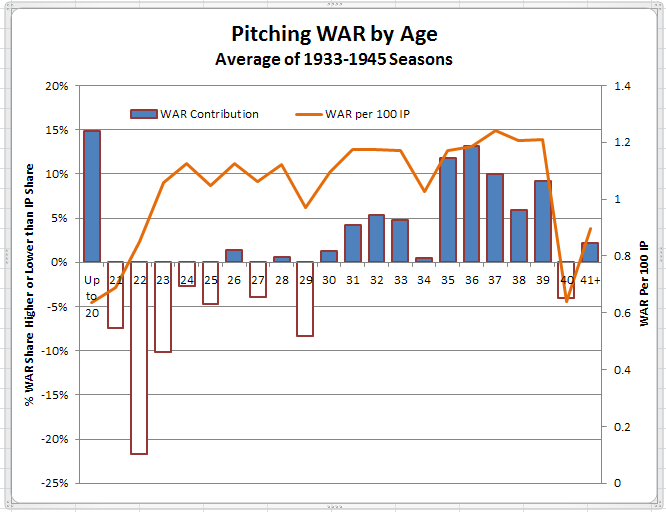
A return to a more normal pattern with positive WAR contribution starting in the mid-20s and reduced contribution levels for older pitchers. Pattern breaks may possibly be related to the juxtaposition of a high offensive era starting around 1950 and a low offensive era over the last 5 or 6 years of this period.
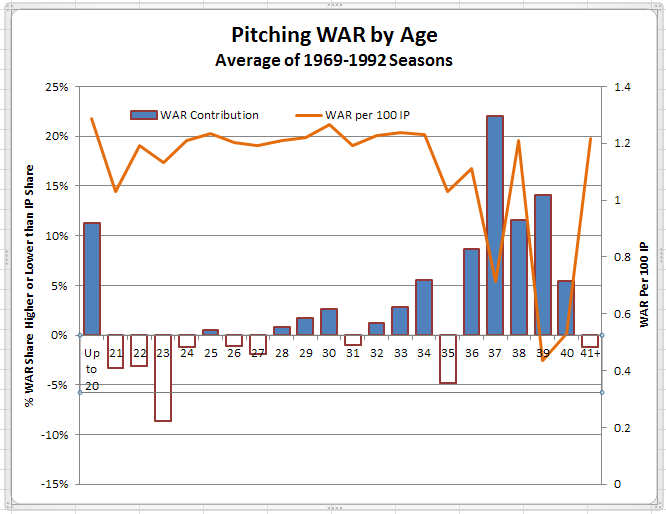
Coming out of the bonus baby era, this period shows consistent WAR per 100 IP starting from the early 20s, probably the result of earlier application of selection bias in that only the very best pitchers are being given significant innings at a very early age, and few young pitchers get significant innings until “they’re ready”.
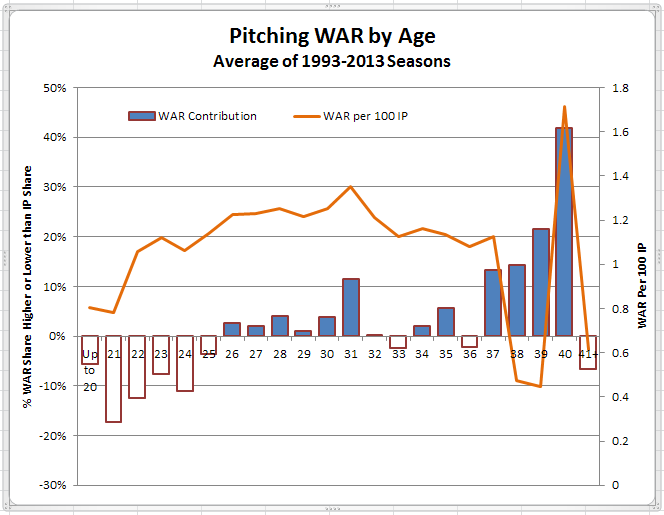
This period “reverses” to some extent the selection bias at young ages seen in the preceding period in that young pitchers of all ability levels begin seeing their innings “managed” so that their workloads are now “artificially” controlled rather than being primarily dictated by ability levels. The result is a return of increasing WAR per 100 IP through the early 20s.
What may not be immediately evident from the above charts becomes clearer in the chart below.
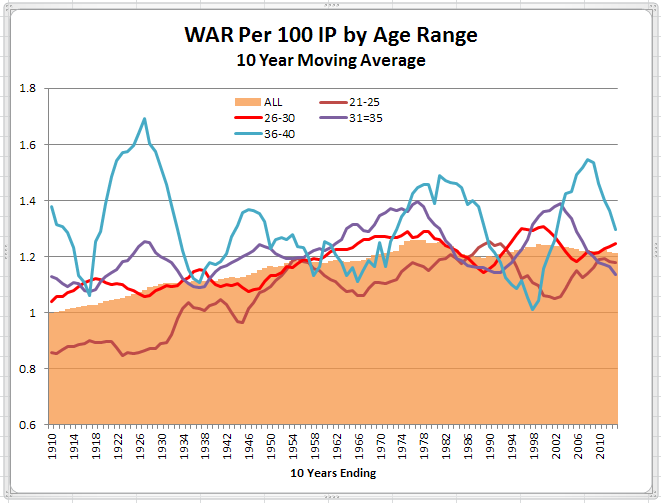
Sharing innings among more pitchers does yield improved pitching results overall. However, there can be too much of a good thing as that steady improvement in overall WAR per 100 IP has leveled off and even declined slightly since the late 1970s. What has driven this improvement? It would seem that has occurred primarily because of improved results for younger pitchers, probably due to some combination of more sophisticated player development and a more cautious approach to workload for those pitchers.
It may be worth noting that the trend lines for the different age categories are presently converging at about the 1.2 WAR per 100 IP level. That convergence was previously seen only in the mid-1950s and early 1990s. Presumably that would indicate optimal selection bias for pitchers of all ages in that there is a uniform level of pitching quality regardless of a pitcher’s age. Whether it really means that I will leave to your astute judgment.
I giggled menically reading through this. Thanks Doug! Even threw in a moving average on there, way to flex some statistics muscle!
I thought the total WAR by age would be a more aggressive shape. You tend to think of young pitchers being standouts and generally producing less as they get older. Your best guys can maintain their level for longer, but it always seems like losing to attrition. These graphs point a different picture where guys might need more time to figure things out than we think and we may be over-using younger arms at the MLB level. Very surprising.
I imagine the graph for position players looks similar but I’ve always heard 27-28 thrown around. I guess pitchers are a full year ahead of hitters?
Much to digest here but that big spike in pitching WAR in the 36 to 40 age range during the 1920’s makes a log of sense with Walter Johnson, Pete Alexander, Dazzy Vance, Dolph Luque, Stan Coveleski, et al.
In the 1920-1945 seasons, I wonder (1) how many innings the legal spitballers pitched during that time (particularly the 1920s), (2) the average age of those guys (I’m suspecting they were already established, so they were likely older pitchers), and (3) if they were even effective at all (some certainly were – Coveleski, for instance). I also wonder if some of the older, more established pitchers who were not legal spitballers were able to get away with a few things that the younger players couldn’t.
I’m curious as to how different the picture would look (if at all) if the 1920s were separated from 1930-1945.
Great point: Red Faber was still pitching close to 200 innings (and effectively) at age 42 and Clarence Mitchell did the same thing as a 40 year old both in 1931, Grimes lasted until he was 40 & was the last legal spitballer in 1934, Urban Shocker was a mainstay on the powerhouse 1927 Yankees at age 36 (and would be dead within a year) and the best example was probably Jack Quinn- answer to many an oldest/youngest/connections question- lasted until he was 49 and pitched over 200 innings as a 44 year old in 1928.
Here are the views for 1920-1932 and 1933-1945. Quite different as you surmised, and likely for the reason you identified.
Very interesting analysis, Doug. Your observation about selection bias and the natural reluctance of teams to give a regular turn to mediocre older pitchers had me curious which pitchers manage to defy the selection bias. I checked the Play Index for pitchers 35 or older with at least 162 IP and pitching WAR less than 2. In recent years, there are about two guys per year who qualify. Last season there were two pitchers who met the criteria: A.J. Burnett And Ryan Dempster. In 2012, there were Bruce Chen and Tim Hudson. In 2011, there were Livan Hernandez, Derek Lowe and Ted Lilly while it was just Kevin Millwood in 2010. Joe Niekro is the champ in this category, with four seasons over age 35, 162+ IP and WAR of 1.9 or less. Guys with 3 such seasons: Paul Byrd, Jamie Moyer, Frank Tanana, Charlie Hough, Tommy John, Early Wynn, Paul Derringer, Milt Gaston.
Thanks for checking.
Glad the small numbers seem to bear out my hypothesis. 🙂
I understand that teams may be more willing to put up with bad performances today by younger pitchers so that they benefit from future good performances, but are the rates that different for younger pitchers?
Checking 2004-2013 for pitchers under 24 who had 162 IP and 2.0 WAR or less I get pretty similar numbers to what b’com finds for 35+:
2013 – 2
2012 – 5
2011 – 6
2010 – 5
2009 – 4
2008 – 4
2007 – 4
2006 – 2
2005 – 4
2004 – 4
That’s 40 seasons over a decade by 32 pitchers, or 4 per year, with Porcello and Bonderman leading the way with 3 seasons each, and current wonderboy Cueto with 2 seasons. Perhaps they are pitching poorly but just not pitching a lot of innings – this measure won’t capture that.
For pitchers 35 and older I find 30 seasons over the decade by 22 pitchers. I’m getting slightly different numbers than b’com because I’m using 2.0 or less WAR (Carl Pavano had 2.0 WAR in 2011 so he shows up in addition to Livan, Lowe, and Lilly). How different is one more pitcher a year?
For pitchers aged 25-29 I find 136 seasons by 97 pitchers, headed by Nolasco, Hammel, Maholm, Blanton, Marquis, Robertson, and Fogg with 3 seasons each. This works out to almost, though not quite, one pitcher per every other team over the decade. But it’s far more than either the younger or older group.
For pitchers 30-34 I find 115 seasons by 73 pitchers, headed by Guthrie, Harang, Livan, and Suppan with 4 seasons each. A little less than the 25-29 group, but still far more than the younger or older group. Pitchers age 25-34 combine for about 25 seasons per year, so almost every team has a guy in this range every year. It’s understandable, as even good pitchers have down years (Kevin Brown had 1.6 WAR in 210.2 IP in 1991, age 26).
My guess is that the reason for the tolerance of such seasons by ages 25-34 is three-fold: (1) Someone has to pitch those innings, and better a 29 year-old than a 38 year-old or a 21 year-old, (2) these guys (particularly over 30) have likely signed free agent contracts, or, for the under 30 crowd, have gone through arbitration and so they’re being paid anyways, so they may as well pitch, and (3) it’s very likely that there’s been some season earlier in his career in which he did not pitch so poorly, so there’s some hope (Jason Marquis had 2.5 WAR in 201.1 IP in 2004, then went 0.7, -1.7, and 0.8 the next 3 seasons, and then came back and put up 2.5 and 3.5 WAR his next 2 seasons).
My hunch is that, rather than having two under 25 year-olds with 162 IP and WAR under 2.0, you’re more likely to have (for example) 3 of them pitching 100 or 110 innings. Something along those lines.
Point is, as you’ve stated, if there aren’t any better options, those innings are more likely to go to younger pitchers than older ones.
It breaks out a little bit differently using different thresholds as you suggest:
Some results for 110+ IP and less than 1.35 WAR (which is the 2.0 WAR for 162 IP adjusted downward to 110 IP). Some of these seasons are on the 162 IP with less than 2 WAR lists as well:
35 and above – 45 seasons by 32 pitchers (Moyer leading the way with 4 seasons, and there are some GREAT pitchers on this list: Halladay 2012, Maddux 2008, Mussina 2007; in addition some really good pitchers like Leiter 2005, Wells 2007, Hudson 2013, and Jamie Moyer)
24 and under – 73 seasons by 66 pitchers
The only ones to pitch this poorly AND this much before age 22 were King Felix, Greinke, Tyler Chatwood, Porcello, and Jordan Lyles. Two of those guys have already won Cy Young Awards, Chatwood put up 3.4 WAR in 111.1 IP in Coors last year, Porcello’s already had seasons of 2.4 and 2.5 WAR, and is way ahead of that pace this year (at 1.4 WAR – whether he can sustain that pace is another issue), and Lyles is just entering his age 23 season now (and pitching well so far this season).
Most of the other seasons seem to be “Let’s see if this guy can pitch in the majors” seasons and many happen at age 23 or 24 (52 of the 73 seasons); call them “Dewon Brazelton” seasons. It’s difficult to assess the careers of most of these pitchers because many are still reasonably young (though looking at the 1984-1993 and 1994-2003 decades doesn’t inspire much hope for the 23-24 year-olds – at least the 1984-1993 21-22 year-olds included Maddux and Glavine), but I’d guess for every David Price or Max Scherzer there are two Brazeltons and an Edwin Jackson/Ervin Santana type.
You know I take back my earlier comments about younger pitchers because you know what? They’re replacement players.
Your typical team does not have enough pitching depth, anywhere near it, to avoid giving hundreds of innings to guys they’d generally much rather leave in the minors. As a result, you get guys who belong in AAA pitching in the majors routinely. Those guys shouldn’t be expected to do well, and for the most part they don’t. But they probably do as well as an older player not good enough to land on a 25 man roster anywhere who is hanging on in the minors as well. That’s really your other option. They probably get called up too but the young guys can eat some innings as well.
Doug, this is cool stuff. I have to come back to this.
What I do not get is how this is better than traditional stats. Having pitched between 1994-2004 I find all this “new age” stuff to be utter garbage. Please excuse my ignorance but if all this stuff was out when I was pitching I could have been even a worse pitcher than I truly was.
Well I guess the first thing to understand is that the skillset required to throw a baseball 60’6″ with consistency, velocity, and movement may not be the same skillset required to understand statistical analysis. The second major point is baseball is often played by guys with long careers over long seasons over games with hundreds of pitches meaning things generally average out quite nicely making statistics that deal with these huge numbers essential.
How would you evaluate a pitcher without knowing how many innings he pitched or a hitter without knowing how many at bats he had? Those are important numbers. Similarly, things like batting average and earned run average are rate statistics which help show how good or bad a player was on an average basis.
Newfangled just means that the turn of the century statistics created by some people with a rather flawed understanding of what was happening are being replaced with more useful statistics. The most major area, one you’re probably familiar with, is talking about walks. When baseball (and baseball statistics) was young, walks were considered completely the pitcher’s fault and the hitter was basically given a pass. As you’re well aware, some guys are much better about working counts than others and generate more walks routinely. This has great value. Similarly, pitchers that minimze walks tend to do quite well. As is obvious, with nobody on a walk and a single are a pretty similar result to an at bat. That is by far the most common situation when you’re at bat (nobody on) but in many other situations a walk is of great value. The idea of not giving a hitter credit for avoid outs through the walk is a flaw in statistical logic. One “newfangled” stat guys try to deal with.
But basically, you have to accept two things:
1) baseball players know less about statistics than statistics guys
2) statistics guys know enough about baseball to apply statistics
I feel pretty safe about both of those.
mosc: More and more players are getting to the majors via the college route. Surely some of them must have had some training in statistics, either as math students or as students in fields that lean heavily on statistical analysis (economics, psychometrics, epidemiology, etc). While your point, that baseball players know less about statistics than statistics guys, is generally true, it seems there must be at least a few major leaguers who know enough about statistical analysis to offer us “statistics guys” some meaningful insights about the current state of sabermetrics. I, for one, would greatly value that kind of feedback.
I agree. There are several guys who understand statistics in the major leagues. Max Scherzer (university of Missouri) seems to get it. He was quoted several times last year through his Cy Young chase talking about how W/L records really didn’t matter (he had quite the win total). The Oakland system stresses walks for hitters and walk prevention for pitchers, a lot of guys who came up through there pitch with a more “new age” approach.
Mosc:
There’s a third thing you (generally) have to accept:
Big league baseball players play baseball astronomically better than statistics guys, and whereas the ballplayers might be able to apply stats to their benefit, I doubt that most stats guys would stand much of a chance doing anything to improve their ball-playing abilities.
I think that’s a little harsh – plenty of people who do stats (or at least understand their value) played baseball at some level. There are plenty of stats people who could very likely greatly improve their ball-playing abilities with training – major leaguers train to improve their performance all the time. Would the statisticians become major leaguers – I would guess that would be highly unlikely. But the major leaguers are highly unlikely to become stats professors at a top 25 school – I really don’t see most major leaguers worried about the efficiency and consistency of estimators.
I’m not sure I would use Scherzer quoting that W/L records didn’t matter as the best example that baseball players understand stats – anyone following baseball should be able to pick up on that, particularly given the discussion when King Felix won his Cy Young. It’s not meant as a knock on Scherzer, who may be really sharp (I just don’t know). I hope it’s true that ballplayers better understand stats, because some old ballplayers become announcers, and hopefully they will bring that knowledge into broadcasts and stop saying ridiculous things like the team with the most productive outs wins ballgames.
I read an article sometime last year about Scherzer and his relationship with his brother. Apparently it was his brother (RIP) who was the stathead and taught Max about them.
@6 DD,
You would not have likely been any worse,
though you might have been paid a bit less.
(That’s about as snarky a comment as you’re likely to see at this site. We’re one of the last civilized locales on the internet. Welcome to the discussion)
The analysis in this article is a step or two beyond your everyday number crunching. Doug is attempting to chart historical trends in a bigger picture sort of way.
The use of the stat “WAR” in itself requires a certain leap of faith if you are not already deeply steeped in this stuff.
As a starting point, “traditional” stats still work just fine.
What we have now, though, is an expanded breakdown of those traditional stats that tell more of the story of what the pitcher offered.
Take this, for example:
http://www.baseball-reference.com/players/d/dreifda01-pitch.shtml#pitching_ratio::none
I can look at those ratios and see that compared to league average, you struck out a lot of guys, didn’t give up that many extra base hits, and got a lot of ground ball outs.
We can look at it another way if you want. Statistical analysis can tell us the ways Darren Dreifort was successful and the reasons why he was unsuccessful, on average.
On the first level, we can look at hits, walks, strikeouts, and home runs while you were on the mound. Hits involve to a large extent your defense but the other three are almost completely your doing. The rate at which you walked opposing hitters was considerably higher than the league average, strikeouts were considerably higher as well, and home runs were around league average. The groundball rate has also been shown to be quite valuable but we do see from the statistics that when you did give up fly balls they were more likely to be in the outfield than usual and more likely to go out.
Unfortunately we don’t have pitchFX data for the 1995-2001 lion’s share of your career so we can’t clarify things like how often your stuff was in or out of the zone and how likely hitters were to swing at it but the main stats paint a picture of a guy with well above average strikeout potential and well below average control. Considerably more valuable than his likely AAA replacement would have been but just too many walks allowed to be an elite pitcher.
Classically, you would be judged by your 872 innings and 4.36 ERA. Modern statistics don’t actually disagree too much with that. They compute you had a roughly average defense over your career but did pitch in a pitchers park. That is mostly negated by the unusually high run production during the years you pitched (the steroid era) so your ERA+, which factors all that in, has you at around 97% of league average. That’s consistent with what you’d expect from a middle of the rotation starter or long reliever. Your best seasons were a little better, your worst were a little worse.
Is there any particular point you have a problem with or just the in general concept that your W/L record and ERA may not be the complete picture of how you performed.
DD,
To continue… advances stats can be used for both positive and negative measures.
For example, the ratio of 6 WAR to $64million equates to more than ten million dollars of Dodgers green for every win produced above “replacement level.”
Now, looking at that stat, I can see why you think this is all “crap.”
However, I found something you were great at.
Hitting.
1.9 WAR as a batter
In only 265 Plate appearances.
Running a search at the baseball-reference play index, we discover that there are only SIX pitchers in all of baseball history who were more valuable with under 270 PA
3.3 Micah Owings
3.1 Tim Lollar
2.6 Omar Olivares
2.2 Terry Forster
2.2 Brandon Backe
2.2 Zack Grienke (current)
1.9 Double D
Described as a ratio, including all pitchers, regardless of Plate Appearances:
PA less than 140* times WAR…
Your career is one of only 43 in history that useful at the plate.
Doug, I’ll suggest another factor in the generally negative WAR Contribution of younger pitchers — a sort of negative selection bias, by which teams minimize their returns from regression to the mean.
What often happens when a young, unproven pitcher starts out poorly? They send him back to the minors. As with any small sample, some of those poor results are basically random, not reflecting the pitcher’s true ability. But those bad results are already banked.
This is bound to cause some distortion in our picture of young pitchers’ WAR Contribution. How big it is, I couldn’t guess.
Here’s what got me thinking about this: I looked at the last 10 years for seasons with a 5+ ERA, first with a 150-IP minimum, then with a 10-starts minimum.
For 150+ IP, there were 126 such seasons, and they skew older than suggested by your hypothesis (that a team would be more patient of such results from a young pitcher). Of the 126 seasons, the median age is 29; just one-sixth of those seasons came at age 25 or younger.
But at the lower threshold of 10+ starts, the median age drops to 27, with one-third of all such years coming at age 25 or younger — twice the rate of the 150-IP group.
Clearly, a lot of young pitchers who “fail” their trials are getting pulled from the rotation.
Trying for a quick/rough check of my theory, I looked at guys age 25 or under in the last two years with 10+ starts in the first half and a 5+ ERA. Out of 15 pitchers, 9 got 4 starts or less in the second half, while 6 got at least 7 starts in the second half.
Four of those six who got to stay in the rotation produced much better results in the second half, and another got somewhat better:
Mike Minor, -3.71 (5.97 to 2.16)
Blake Beavan, -2.52 (5.92 to 3.40)
Alex White, -1.98 (6.45 to 4.47)
Tommy Hunter, -1.67 (6.11 to 4.44)
Derek Holland, -0.65 (5.05 to 4.40)
Jordan Lyles, +0.03 (5.08 to 5.11)
It’s far too small a sample to prove anything, but I think it illustrates my point. Teams may be too impatient with young starters, pulling them from the rotation after an insufficient trial.
Good observation, John.
Thinking again about a team’s attitude towards young pitchers, they will be probably be patient (to a fault) with them if they’re invested in the pitcher because they feel he has “major league stuff” and just needs time to develop maturity, control, command (or whatever his failing might be).
Pitchers that a team is not invested in won’t have that same luxury. As you’ve indicated, they may get called up (perhaps because of an injury) but if they don’t perform right away (or the injured player returns) then back to the minors with them. If, by some chance, that pitcher does perform well in his initial opportunity, it may still not be enough to get him through his first rough patch without the team deciding he isn’t ready and sending him back down again.
I was thinking about the first case in my comment in the post but the second circumstance you’ve identified is probably the more common and a good illustration of how tough it can be to get established as a young pitcher if a team doesn’t have high expectations for you.