
There’s the Sultan of Swat, Hammerin’ Hank, and one of the Bash Brothers. All three certainly didn’t get their nicknames from being slap hitters, knocking singles through the infield. What they do have in common is that Babe Ruth, Hank Aaron, and Mark McGwire are all part of the top 10 all-time home run list for Major League Baseball. Deep fly balls and rocket line drives soaring over the fence, are what fans best remember these 10 players by, but the real question is, who out of the top 10, is the greatest overall hitter of the group? Do you go with the player who had the highest career batting average? That would be Ruth, who hit .342 for his career. Or is it the player who had the most career hits out of the greatest home run hitters in baseball history? Here, Aaron reigns supreme, with his 3,771 career hits to go along with 755 home runs.
The offseason is a time for awards and other sports fans getting mad that we’re still talking about baseball. But, part of the beauty of baseball is that is seems to never stop. In the offseason, the hot stove is turned up with free agent and trade rumors that have to do with a team’s future, yet we still love to talk about the past. In this case, the hot stove is a wood burner of the past.
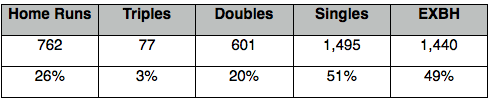
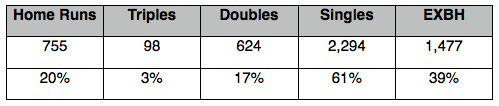
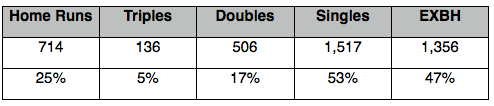
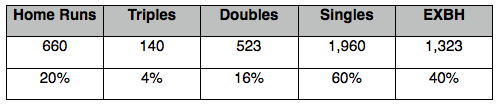
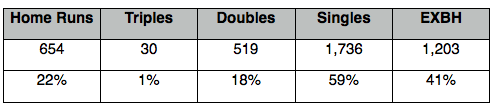
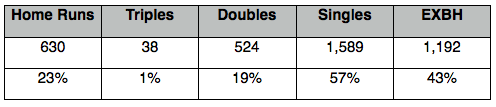
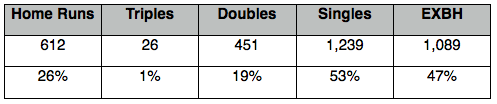
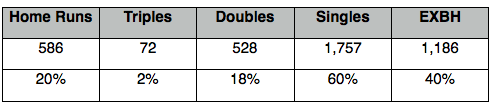
Perhaps, there is a different way to look at this question. I broke down the hit rates for each player in the top 10, showing what type of hit they produced most and least often over the duration of their career.
There are, of course, many factors that play into these results, including eras, stadium dimensions, and the stats below are only based on balls hit in play including home runs, so walks are not a part of this system. To add to the factors, Barry Bonds, Alex Rodriguez, Sammy Sosa, and McGwire have all been tied to Performance Enhancing Drugs during parts of their careers. While those players may have had enhancements to help their game, Ruth and Mays had disadvantages. Ruth didn’t play over 100 games, giving him more chances for hits, until his sixth season in 1919. Mays, missed the entire 1953 season at age 22 for military service time, and then went on to win the 1954 National League MVP where he had 195 hits and 41 home runs.
*EXBH = Extra Base Hits
1. Barry Bonds, 762 Home Runs, 2,935 Hits
3. Babe Ruth, 714 Home Runs, 2,873 Hits
4. Willie Mays, 660 Home Runs, 3,283 hits
5. Alex Rodriguez, 654 Home Runs, 2,939 Hits
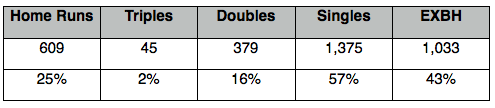
10. Mark McGwire, 583 Home Runs, 1,626 Hits
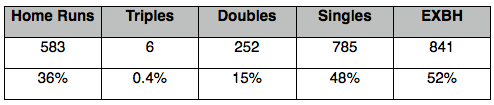
So, what does this all mean? Well, a lot of different things, with some surprises and some predictable conclusions. Ruth surprisingly led the group in triples rate at five percent, though Mays tallied four more total triples than him in his career. The rate at which the two hit triples differs is due to Mays accumulating 410 more total hits in his career. It also seemed inevitable that Aaron, even with the second most career home runs, would have the highest singles rate at 61 percent as he leads the list in total hits with 488 more hits than Mays, who sits in second total hits for the top 10 all-time home run leaders. McGwire is the outlier here. He sits last in tenth place with home runs, but has the highest home run rate at 36 percent and is the only player that has a higher extra base hit rate compared to singles. He’s an interesting case where his tendency to be so power heavy is not ideal, but we’ll get to that soon.
Introducing RP3 (Runs Produced Probability Points, not Dan Snyder’s dog)
Why is the extra base hit rate and its correlation to singles so important? For starters, think about the base paths as being cut into four quarters. A single would result in a 25 percent probability that a run will be produced from an RBI or eventually a run scored, while a double is 50 percent, a triple is 75 percent, and of course, a home run is a 100 percent chance of a run being produced. This is exactly why the extra base hit rate is key to production, yet singles must not be forgotten.
Let’s make these percentage probabilities into points now. For his career, Bonds would account for a probability of 1,494 (762+57.75+300.5+373.75) runs produced. Now, let’s compare that to McGwire, who had the highest home run rate, but the lowest singles rate. McGwire totaled 2,145 less hits than Aaron. The former Bash Brother racked up a probability of 909.75 (583+4.5+126+196.25) runs produced, which is 584.25 less runs produced than Bonds.
Baseball analytics have shied more and more away from a statistic like RBIs. The reason is that the stat is dependent, meaning that you need a little bit of luck and also help from your teammates to be able to knock runs in. A hitter still must be able to produce smart outs and produce when needed in order to get RBIs, and also be able to get on base to add runs on your stat sheet. The reason RP3 trumps the two stats and combines the chances of the two happening, is because it is an independent stat, where only the batter can affect the outcome.
What this shows, is how balance is the ultimate winner when looking at the strongest hitters. We still need Pete Rose, who only had a 24 percent extra base hit rate out of his 4,256 career hits. Rose had 3,125 singles alone in his career. That is more total hits than everybody on this list besides Aaron and Mays. With just his singles, Rose has a runs produced probability of 781.25 runs.
As Aaron has 836 more career hits than Bonds, he also has the highest runs produced probability, with 1,714 runs produced (755+73.5+312+573.5). Again, balance is huge and when it comes to the subject. Bonds is the champion at a 51:49 singles to extra base hit ratio, hitting only 55 more singles than extra base hits for his career. This correlation of such a balanced slugger and overall ability to rack up base hits, makes Bonds the greatest overall hitter as a power hitter, despite not reaching the magic .300 career batting average as he finished at .298, and fell 65 hits short of 3,000. If you’re a fan of the runs produced probability points equation, then Aaron is your guy, even though he only had a 61:39 singles to extra base hit ratio. Either way, the more controversial and less controversial home run king, found a way to balance power and the ability to find hits, making them maybe the overall greatest left-handed and right-handed hitters of all-time.
I don’t know if you realize this, but because you’re weighting XBH the same as in the formula for slugging percentage, your “runa produced” is simply the same as TB/4, e.g.
Bonds 5976 TB /4 = 1494
Aaron 6856 TB /4 = 1714
McGwire 3639 TB /4 = 909.75
etc.
So this doesn’t really tell us anything we didn’t already know, e.g. that Aaron had more TB than anyone in baseball history.
Also, I’m unclear why Bonds having a nearly even ratio of singles to XBH would make him the “greatest overall hitter” among power hitters. Why is an even ratio desireable, exactly?
Agreed on the even ratio thing…. Yeah, wouldn’t one prefer HR’s in each and every plate appearance and work it on down from there – triples, doubles, singles, and walks, HBP, etc…all the way down to a triple play in order of preference?
Interesting concept but feels like an idea was had and then a search for a stat to confirm it… confirmation bias?
A few things.
1. It seems disingenuous (to me, anyway) to talk about how the steroid players had advantages, but Ruth and Mays had disadvantages. Fewer international players (for both), a non-integrated (Ruth) or little-integrated (Mays) league, overall athletic improvement over time (look at winning Olympic 100M dash times in 1936, 1960, and then 2000 if you don’t believe me), and, for Ruth, the run-scoring-est environment of all-time (AL in the 1930s was every bit as run-heavy as the heart of the “steroid era”), and I don’t see how they didn’t have a ton of advantages, too. Perhaps they didn’t have the chemical advantage those other players had, but they had some pretty substantial advantages.
2. Isn’t this kind of all based on a false premise? Is a single REALLY worth 25% of a run? If wOBA is to be believed, it’s not; a single is worth 40% of a run. A triple is worth nearly a run, and a home run is worth about three times (a little more, actually) a single, not four times as much. There is a difference, that’s true, but it’s not as simple as a 1:2:3:4 ratio.
3. To echo David’s question above, why is a more even of single to XBH desirable? Are you suggesting that McGwire would’ve been a better hitter if he had traded some of his homers for singles? Because that’s definitely not true. Are you suggesting that he would’ve been more valuable if he had just plain hit more singles? Well, I agree, but that’s not so much about an “even ratio;” it’s more about it just being better if a player had gotten more hits. Imagine three players: a.) McGwire as he is, b.) McGwire, but with singles added to even his ratio (56 singles in the same number of PAs), c.) McGwire with those additional 56 hits, only they’re all HR. Slash lines for all three:
a.) .263/.394/.588
b.) .272/.401/.597
c.) .272/.401/.624
Why would b.) be more valuable than c.) in this example?
To take this to its logical extreme, who’s more valuable: a guy who bats 1.000 with an even mix of HR and XBH, or a guy who bats 1.000 with nothing but XBH? I think the answer is pretty obvious. So again, I’m not really sure why you’re suggesting it’s desirable for these guys to hit more singles. I mean, singles instead of outs, yeah! But singles instead of XBH? No thanks. I don’t understand.
3. Perhaps I’m just not understanding your post. But while the idea of ratios of types of hits is really interesting (I mean, seriously: Jim Thome had almost FOUR TIMES as many 3B as McGwire! That’s insane!), I’m not sure it’s as instructive or helpful as a tool of analysis in the way you’re trying to make it out to be.
I’m not sure why you assign values of .25 to singles and .50 to doubles. Plenty of runners score from second on singles and from first on doubles.
Single-season RBI totals would be a lot more useful if they were “normalized”; adjusted for the expected RBI total of having so many runners at each base over a season. Even that would not account for the ability of the particular base runners.
LA:
” “I’m not sure why you assign values of .25 to singles and .50 to doubles. Plenty of runners score from second on singles and from first on doubles ” ”
As a younger man who at one time was capable of thinking in “spatial” relationships, I theorized on the “Homerical Value of Doubles”. That is to say, pre-steroid era, what was the relationship and potential predictability of Stan Musial’s doubles at age 21 versus his home run breakout season at age 26? The calculation involved square roots and, believe it or not, the formula is not copyrighted 🙁 ha ha
Steroids kind of made it all a moot point since player performance kind of went off the charts
RE24 is the way to go (de-leverage it if you want, I don’t) for a “production” type stat. I’d still pair it with OBP and some measure of power (SLG-AVG is close) for a more statistically minded triple crown but this stat is closest to slugging or career total bases. Neither of which I find valuable on their own.
Albert Puhols won my “NL triple crown” in 2009 leading the league with a .443 OBP, .331 ISOP, and a 78.7 RE24 though Mauer edged his OBP by a thousandth out preventing an MLB crown. Bonds dominated all three stats in
2001: .515/.536/118.9
2002: .582/.429/119.4
2003: .529/.408/84.8
2004: .609/.450/128.8
Each of those stats in each year he lead the MLB. Jason Giambi has my last AL triple crown in 2001 with a lower ISO than you might expect .477/.317/89.2 though still well ahead of this year’s leaders Encarnacion (.279) and Stanton (.267). Trout triple glory by .005 ISO and Stanton by .012 OBP, both very close.
Bonds 4-year run and context for it aside, his RE24 was 6th in all of MLB or better (#1 8 times) from 1990 to 2004 with the exception of 1999 where he missed 60 games. He blows anybody else out of the water (Aaron’s 982.3) with 1357.7 career. Though Ruth, Willams and a few others may be short changed from contention. Bonds played in pitchers parks (or at least neutral parks) and although we need to look at him in the context of the steroids era, he was the best player/hitter in the league from 1988-1998 by a wide margin. Unless you intend to deduct points for steroids, he’s a few swings better than Aaron despite the longevity difference. I’d still take Ruth over either though I have no RE24 measurement that far back. His career line of .477 OBP and .358 ISO would certainly lead to a few runs.
Bottom line is I find total bases a simplistic way to look at offense.
Here are the top 25 for the two RE24 metrics, for the period for which play-by-play data are available.
Generated 12/8/2014.
Data are complete since 1973, and mostly complete since 1950. Thus, Musial’s and Williams’ totals are substantially understated, but everyone else is really close to their true numbers.
I might be rushing this, but it appears Ruth and Bonds appear very similar in their “ratios”. Ditto for A-Rod and Griffey. But, don’t ask me what that means 🙁
Hate to pile on, as David has basically nailed it — the “runs produced” is the same weighting as total bases, and thus has all the same issues that stat does as a measure of runs produced. What we know is that the statistical expectation of the run value of a single versus a double versus a triple versus a home run is not an even .25/.5/.75/1.
In fact, in average context, relative to an out, a single is much more valuable than .25 runs, because runners will often score from second on a single (and even rarely from first) and because the hitter is now in a position to potentially be driven in, and has not accumulated an out for the team. All that ends up being worth about .8 runs — in fact, a *walk* is on average more valuable than .25 runs, and generally worth almost half of a single. doubles, triples and homers.
Tango’s method as used by BR produced these numbers for MLB in 2010: (0.70 * uBB + 0.73 * HBP + 0.89 * 1B + 1.27 * 2B + 1.61 * 3B + 2.07 * HR + 0.25 * SB – 0.50 * CS).
That’s saying that an unintentional BB is worth .7, a single is worth .89, a double 1.27, a triple 1.61 and a homer 2.07.
Those all sound very high to me, but that’s showing the distance between those numbers and an out. If you want runs produced above average or replacement, then you subtract out what an average or replacement player would have done.
Here’s the thing rBat does exactly this — with weightings that change every year based on the actual values in the average context of a year’s MLB games, with adjustments for park factors and subtracting out the value of an average player.
oWAR then adjusts for positional value and scales it to replacement level instead of average, if you don’t want to ding guys for playing hurt or too long unless they are really hurting the team by playing worse than your typical waivers/call-up guy.
So, the stats that are already being calculated by BR and fangraphs (rBat, wOBA, wRC+) are a major improvement over this simple total base count.
Why not just use rBat or wRC+ or wOBA? They do what this purports to do, but better.
For RP3 clarification: All stats looking to show the most productive ways to be a hitter are plenty worthy. One theory of many here. Also, let’s look at two teammates on the other side of the spectrum. In 2014, Jose Altuve had a 74.75 (7+2.25+23.5+42) RP3. Chris Carter hit 30 more home runs, but was less productive with 62.25 (37+0.75+10.5+14) points. The point is balance, not being a home runs only or singles only hitter, and pure independent production. And yes, I see that this is also TB/4. No, I didn’t see that before.
“One theory of many here”…the thing is, the theory behind wOBA/wRC+ is based on actual empirical evidence, while your weightings appear to be arbitrary. The fact that Altuve had 12.5 more “points” than Carter simply means he accumulated 50 more total bases. Without additional context, that really doesn’t tell us all that much.
And as far as “balance” goes, Carter was a far more “balanced” hitter by your defintion – he had 56 singles and 59 XBH, while Altuve had 168 singles and 57 XBH. So what?
Pingback: Hit Rates of the Top 10 All-Time Home Run Leaders & Introducing RP3 | Life's A Ball