
Last season marked the 6th consecutive campaign with OBP below .330 for major league leadoff hitters. If it happens again in 2016, it will mark the first time since at least 1913 that that’s happened in 7 consecutive seasons. 2015 also marked the fourth straight season with at least 10% of major league teams posting a sub-.300 OBP from the number one hole; it’s the first time that’s happened in more than 40 years.
The good news (I guess) is that poor leadoff hitting didn’t stop the Kansas City Royals from becoming only the sixth team since 1913 to win the World Series with leadoff hitters posting a sub-.300 OBP. More on trends in leadoff hitting after the jump.
Here are those World Series champions with under-achieving leadoff hitters.
| Rk | Team | Split | Year | |
|---|---|---|---|---|
| 1 | KCR | Batting 1st | 2015 | .295 |
| 2 | ATL | Batting 1st | 1995 | .293 |
| 3 | OAK | Batting 1st | 1972 | .282 |
| 4 | NYY | Batting 1st | 1961 | .293 |
| 5 | DET | Batting 1st | 1945 | .295 |
| 6 | NYY | Batting 1st | 1941 | .291 |
Those 1961 Yankees were in the second of 5 straight pennant-winning seasons, four of them with sub-.300 OBP from their leadoff hitters.
| Rk | Team | Split | Year | |
|---|---|---|---|---|
| 1 | KCR | Batting 1st | 2015 | .295 |
| 2 | PHI | Batting 1st | 2009 | .294 |
| 3 | ATL | Batting 1st | 1995 | .293 |
| 4 | OAK | Batting 1st | 1972 | .282 |
| 5 | NYY | Batting 1st | 1964 | .294 |
| 6 | NYY | Batting 1st | 1963 | .283 |
| 7 | NYY | Batting 1st | 1961 | .293 |
| 8 | NYY | Batting 1st | 1960 | .272 |
| 9 | DET | Batting 1st | 1945 | .295 |
| 10 | NYY | Batting 1st | 1941 | .291 |
| 11 | BRO | Batting 1st | 1920 | .279 |
| 12 | PHI | Batting 1st | 1915 | .293 |
But, relative to that time, sub-.300 OBP from the leadoff spot wasn’t that unusual.
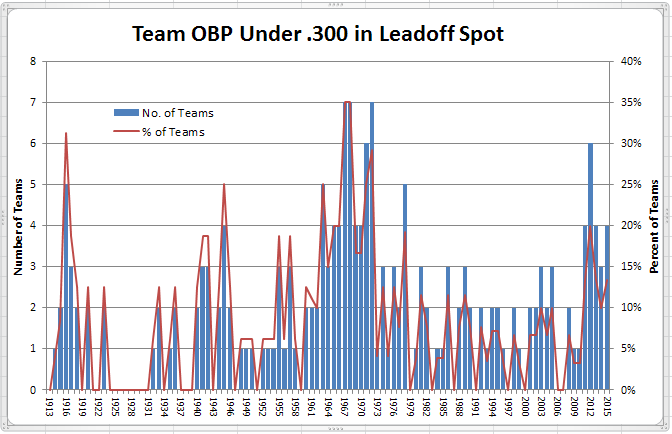
Then as now, over 10% of teams failed to break .300 OBP from the leadoff spot, a trend that continued in the latter part of the 1960s, peaking above one-third of major-league teams in 1967 and 1968.
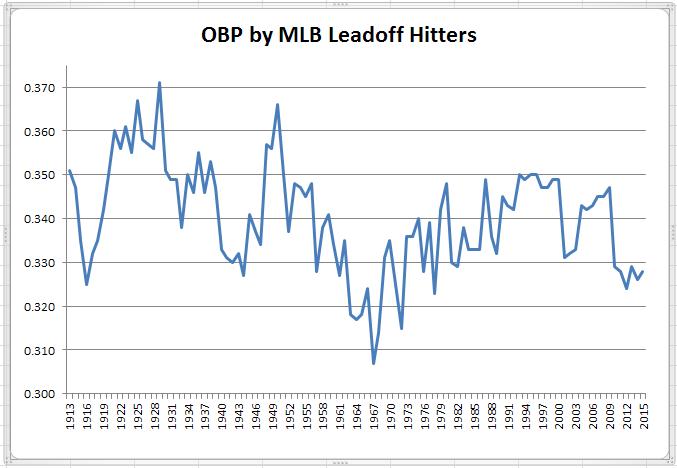
Here’s what overall OBP has looked like from the leadoff spot.
For the most part, leadoff OBP has moved in tandem with run scoring, the exceptions (in the late 1920s/early 1930s, the 1950s, and late 1990s/early 2000s) coming in periods when power hitting became more prominent. But we really shouldn’t be that hard on leadoff hitters because of the their decline in OBP in the 2010s. Despite reaching base less often, their contribution to team offense has actually increased in recent years as shown in the chart below.
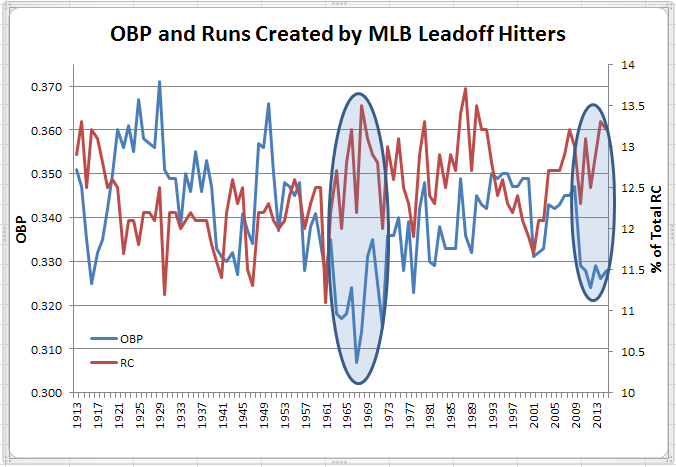
Now, as in the 1960s, the RC share by leadoff hitters has increased in a low run scoring environment where each run (and, thus, each baserunner) assumes greater win value. Both of these effects (lower leadoff OBP and higher leadoff RC share) should be interpreted as symptoms of a low run scoring environment, rather than one causing or influencing the other.
Which teams have struggled the most in recent years with low OBP from the leadoff spot? The table below shows that fully half of major league teams have posted at least one season in the past five with sub-.300 OBP from the leadoff spot, led by the Reds and Mariners with three seasons apiece.
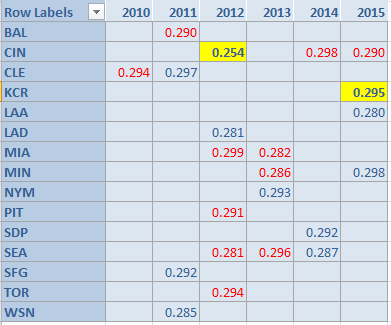
The two highlighted cells are division-winning seasons, while the more numerous (half of the 22 seasons) red type denotes teams finishing 4th or lower in their divisions. That .254 OBP by the 2012 Reds (rookie Zack Cozart was the pimary leadoff hitter) is the fourth lowest leadoff mark since 1913, making their division title (aided by exceeding Pythagorean wins by 6 games) the more remarkable (the next year, with Shin Soo Choo at the top of the order, the Reds’ leadoff OBP jumped to .415, the biggest season-to-season change for a team since at least 1913; with Choo in Texas in 2014, the Reds’ leadoff OBP declined to .298, the third-largest season-to-season change).
Really scary. I wonder if GMs and managers are still in a haze from the steroids era, where it seemed like you could put any lineup out there and it would score runs.
i think it’s possible that they are becoming more traditional in reaction to a decline in power-hitting and an increase in strikeouts. Escobar had a little bit of speed (16 SB) and generally made contact (75K in 662PA)
So Escobar is odd, because while his overall OBP is not good for a lead off hitter, the only at bat that really matters much (as opposed to him hitting 9th, which is probably where he should hit) is the first one. And his OBP when leading off the game was a respectable .333. In the postseason he showed a knack for jumping on first pitch fastballs leading off the game and I suspect that is the same reason why his leading off the game OBP is better than his overall OBP.
I think there’s some logic to this. We put a lot of importance on batting order and from every analysis of it I’ve read, even going from a terrible order to an optimized order is a difference of 1-2 wins. Which is important, of course, but to have one or two guys in the wrong spot probably isn’t the end of the world.
It seems as long as there are a couple of spots in the lineup with back-to-back or back-to-back-to-back decent hitters (whether OBP or power-based), then the other 3-4 guys can be put wherever.
Not sure that I agree that “the only at bat that really matters much … is the first one”. Regardless of the inning, batters at the top of the order have traditionally been expected to get on base frequently for the sluggers who follow them. Since teams still bat their power hitters 3-4-5-6, makes sense to have players who get on base batting ahead of them.
Escobar doing better in the 1st inning than after was atypical of leadoff hitters who, as a whole in 2015, went .262/.314/.405 in the first inning and .270/.342/.405 the rest of the game. His apparent strategy of jumping on the first pitch of the game makes a lot of sense as that pitch, perhaps more than any other, is likely to be a fast ball thrown for a strike. Yet, P-I’s event finder indicates that the first pitch of the first inning was put in play only 439 times last year, just 9% of the time.
My point was that the #9 hitter also hits in front of all those guys too, just not in the first inning.
Glad to see this is one of the things my Indians excelled at as they led MLB with a .366 OBP from their leadoff hitters (just edging out Houston at .365).
I don’t remember where I read about it (maybe here on HHS), but someone did a batting order analysis (including computer simulations) of the early ‘60s Yankees teams and found that with their typical lineup of Bobby Richardson batting leadoff and Tony Kubek hitting second, the team’s run production was considerably less than what it might have been. As an example, the 1961 team had an OBP of .330, but Richardson was at .295 for the year and Kubek .306. As I recall, the simulations identified that the best batting orders would have had either Elston Howard or Mickey Mantle leading off and that almost all other 1-2 combinations were better than Richardson-Kubek. As it was, the ’61 Yankees were second only to the Detroit Tigers in runs scored, but with the right batting order, they could have done better.
Good luck convincing any MLB manager in 1961 that Mickey Mantle should be batting leadoff, with all the HRs he hit.. Yes, I do know that Mantle batted leadoff 82 times, but that was mostly in the first couple years of his career.
Interesting that Ralph Houk, the Yankees manager in 1961, when he took over the Red Sox in 1981, often batted Dwight Evans first or (usually) second during his tenure of the RS, because of Evan’s high OBA.
I had a baseball simulation game for the Commodore 64 which included great teams of the past, including the ’61 Yankees. Figuring out who to lead off on that team was so hard! I think I generally went with Elston Howard and his .387 OBP. Though it always seemed strange to be leading off a 32 year old, slow-footed catcher.
This was the game by the way:
https://www.youtube.com/watch?v=hymCz-uFSJU
Could you even convince a manager in 2016 that Mantle should be batting leadoff? You certainly don’t see a guy like Joey Votto leading off.
There’s always been an idea thrown around that you should actually bat your best hitter lead-off, not because of his OBP, but because that gives him the most PA’s possible. Certainly the difference in seasonal PA’s between lead-off and batting 2nd isn’t much, but the difference between lead-off and clean-up can be significant. But we know that inertia is king in baseball – if a manager puts Barry Bonds or Ted Williams in the lead-off slot and they lose some games, they might lose their job.
Conventional wisdom is that the #3 spot is the best balance of PA’s and RBI opportunities – but we know that the CW isn’t always correct.
Isn’t it more accepted for best hitter to be #2? If you put him at #1, you’ve got him right after your worst hitter at #9. In the 2 spot, you still get a lot of PAs, but also don’t have your worst hitter directly prior.
I think it depends on the exact balance between total PA’s and RBI opportunities. In the NL I would definitely say that yeah, you don’t want your best hitter batting after the pitcher. Looking at Voomo’s numbers for the 61 Yankees, it’s a 21 PA difference between lead-off and the #2 hole. I think a lot of it is personnel dependent – if you have no good other options at lead-off, it might be worth the chance. If you have a prototypical lead-off guy (lower power/high OBP/decent speed), then I’d agree, bat that guy lead-off and your Ted Williams/Barry Bonds type hitter 2nd.
But most of this is spitting into the wind. Managers have been batting their best hitters in the 3 and 4 slots for 100+ years, with only a few exceptions.
On the ’61 Yankees:
The secret to this team’s success offensively —or what put them over the top—wasn’t really the M&M boys. It was the batting of the catchers, Howard and Blanchard. (Yogi caught hardly any games that year.) In 757 PAs they produced 229 hits, 42 HRs, 102 runs, 133 RBI. Elston batted .348, OPS+ 153, John .305 and 168. This made up for the offensive black hole that was the infield minus Skowron.
The team finished last in the league in doubles and SBs, next to last in walks despite Mantle leading the league, and in general was a one dimensional team, hitting 60 more HRs than the Tigers, who managed 180 and finished second there, too.
Good pitching and defense were other hidden factors.
Highest ratios of RBI/HR while batting from the number 1 position in the batting order, 20 HR minimum:
Johnny Damon, 4.55 in 1994
Craig Biggio, 4.40 in1998
Darin Erstad, 4.00 in 2000
In the pre-DH era:
Eddie Joost, 3.70 in1952
Lou Brock, 3.62 in1967
Eddie Joost, 3.52 in 1949
Overall average ratio for all 74 players with 20+ HR: 2.78
In 1961 Mantle, batting almost always 4th, had 54 HR with 128 RBI with 646 PA. If he batted first he would have had about another 54 PA. And he would not be batting behind Roger Maris. It is interesting to contemplate how many RBI he would have had batting from the number 1 position.
Yankee OBP for 1961, batting 6th thru 9th, were .335, .355, .298 and .226. I’m guessing that, with Mantle leading off, OBP for the 8th place hitters would be reduced as they likely would have drawn fewer walks ahead of the pitcher. When he wasn’t leading off or batting 2nd in an inning after the pitcher, I’m guessing Mantle would have batted a lot with two outs; which is good for the Yankees as Mick was a noted clutch hitter, and the clutch stats bear out that reputation.
As it were in 1961 for the Yankees, the number 4 position had 326 PA with ROB, for a total of 431 baserunners. The number 1 position had 245 PA with ROB, for a total of 344 baserunners.
By doing the above research I stumbled across a method to determine number of ROB by batting order position. For those of you who are interested here are the results for 2015 for both leagues combined.
BOP…….ROB
1…………9920
2……….11760
3……….12939
4……….14052
5……….13187
6……….12057
7……….11668
8……….11474
9……….11192
My post #19 is easier to follow on a per team basis. Dividing the above values by 30 yields:
BOP…….ROB
1……….331
2……….392
3……….431
4……….468
5……….440
6……….402
7……….389
8……….382
9……….373
Those numbers would support brp’s assertion above, since the only really significant jump in ROB is from lead-off to 2nd (+61). The rest are a lot closer, and since the PA differences between line-up spots are relatively linear (at least, I think they are – maybe I should get some numbers to prove that), the best trade-off of PA’s vs ROB is the #2 hole. But like I said above, that’s an analysis in a vacuum – individual team personnel makes a big difference.
I think that to evaluate where hitters are best located in the order, you also need to know BOP ROB / PA. (Acronym doo-wop!)
If you figure that there is an average decrement in PA of 18 per BOP and use Richard’s BOP-ROB figures for 2015, you get this for BOP-ROB per PA:
0.436
0.528
0.595
0.663
0.640
0.600
0.597
0.603
0.606
I think this better shows the natural dynamic of BOP that would be disrupted by a radical change in batting order strategy. If you move your best power hitter up to the #2 slot, these figures are going to change, depending a lot on that hitter’s relative OBP/SLG contributions.
Ultimately, all you’re aiming for is a combination of the best overall ROB/PA figures for your particular line-up, plus optimal three-man line-ups for the last inning or two of close games, which is where virtually 100% of the PA differentials will occur. If you move your Mickey Mantle from the 4 to the 2 slot, you’ll average 36 more PAs in the late innings, but only a portion of those will make a difference, and he’s going to be seeing 20% fewer runners per PA, which is not a small number.
Moreover, if your Mantle is in the 2 slot, it’s not at all clear you want your Maris in the 3 slot any longer (or vice versa, if you think Houk should have had them reversed). You’ll have mucked up the curve of BOP-ROB, and it may turn out that you’d do better to trade off some late-inning PAs to catch a crest in the curve that has been pushed back a bit – look at how you get more ROB/PA at the 8-9 than the 6-7 slots in the current model. Rearranging your order should create unintended anomalies like that in other places, all very much affected by specific personnel.
So while I don’t know whether longstanding practice is optimal, I do think you’d need to model this mathematically in ways a lot more complex than just looking at total BOP ROB. (I seem to recall that Bill James reported on running programs for this in his book on managers and found that BOP made startlingly little difference using randomized figures – unfortunately, I can’t recall where I put that book . . .)
I’ve got that book in my bookcase, epm – I remember that portion, and I think it was concluded that the difference between a completely optimal and a completely sub-optimal lineup ends up being 3 or 4 wins, but that the differences between, say, the 3rd most optimal and 10th most optimal are almost always less than a single win. In fact, I think he went even further and said that the 3rd and 10th most optimal lineups will, given a big enough sample size, be expected to score the exact same amount of runs.
His argument made a lot of sense, too. In my example of batting your Barry Bonds type hitter #2 instead of clean-up, you give him 40 more PA’s or so, but you aren’t adding the value of 40 more Bonds PA’s – you’re adding the value of 40 more Bonds PA’s minus the value of the 40 PA’s you’re taking away from whoever was in the #2 slot before. So you’re adding value there, but not as much as you might think. Meanwhile, runners that used to be on base for Bonds are now on base for your old #2 hitter – since it’s a fair assumption that this hitter isn’t as productive as Bonds, you lose runs from that side of the trade-off.
That seems exactly right to me, C.C. What’s more, the additional PAs that matter won’t necessarily work the way you’d wish. When you’re down to your last out or two in a close game, what you want in most cases is a low-K high-OBP guy who will not end the game. A Mantle would be great, but not a Maris, if that’s your #4 hitter.
CC (#30): Speaking of Barry Bonds, here’s a specific example from the 2004 season. Bonds had an OBP of .607 batting fourth, while the cast of characters batting second in the San Francisco lineup combined for a .332 OBP. If Bonds had batted second instead and gotten 40 more PA, his OBP suggests that he would have gotten on base 24 more times. If you subtract the 13 runners on base that the actual 2-hole hitters typically produced with 40 PAs, the difference is 11. If I’m doing the math correctly, 11 more base runners translates to about 4 more runs, or maybe 0.4 wins. And this is an extreme example — a player who gets on base 60% of the time on a team whose OBP is .357.
Leaders in OBP, minimum 3000 PA,
with PA more than 20* SO:
.428 … Tris Speaker
.424 … Eddie Collins
.423 … Joe Jackson
.419 … Mickey Cochrane
.413 … Lefty O’Doul
.407 … Riggs Stephenson
.406 … Arky Vaughan
.404 … Charlie Gehringer
.404 … Paul Waner
.398 … Joe D
.398 … Elmer Valo
For Johnny Damon, I have to think that should be 2004, right?
That Erstad year was pretty crazy. A .355 average for a guy that never again batted over .300.
2004 for Damon is correct.
Other players, since 1901, with one qualifying season of .350+ BA and no others of at least .300:
Norm Cash
Cuckoo Christensen
Al Wingo
Bill Lamar
Austin McHenry
Charlie Hickman
McHenry might well have had more. Dying at age 26 from a brain tumor tends to limit one’s options for success.
Norm Cash, who hit .361 with 41 HR in 1961, later admitted to using a coked bat that season.
Here’s an old post of mine.
Cash holds a dubious record. After his .361 title BA in 1961 his average dropped to .243 in 1962. That .118 decline is the largest for a batting champ’s ensuing season.
There were a lot of coked bats in the 80s.
i actually meant corked bat.
Things are currently slow here now so I thought I’d go a little off-topic. I decided to search for players with the greatest difference between their best and second best BA in a qualifying season. I searched the AL and NL only from 1901-2015 for retired players. Here are the top 10.
.101…..Doc Farrell
.093…..Fred Hartman
.090…..Cito Gaston
.086…..Jim Hickman
.086…..Simon Nicolls
.086…..Larry Sheets
.080….Nick Punto
.078….Jeffrey Hammonds
.078…..Norm Cash
.078…..Germany Schaefer
Some of the above players have had seasons with more than 400 PA and a lesser difference.
Cash, though, is the only one with many qualifying seasons. Most on the list had exactly two.
There’s something in this, I think. Sort of the Hurricane Hazle phenomenon expanded.
For my post#10 I should point out that the highest ratios went to players with between 20 and 25 HR. For the 14 players with 30+ HR the average ratio is 2.44. The highest number of HR is 39.
PA by batting order position for the ’61 Yanx:
761
740
721
707
699
684
660
644
623
That’s (roughly) over 50 games in which Richardson hit late in a game and Mantle did not.
I’m not advocating battling your best hitter first.
But how a team that won 109 games did so while batting their WORST hitter first is amazing.
Richardson won his first Gold Glove that year as well (with our current Rfield metric seeing him at -7).
Along with his -23 Rbat he earned a nice, concave -0.7 WAR. Dead last on the team.
Lead-off batters for the Yankees in 1961:
117…..Bobby Richardson
26……Clete Boyer
18……Tony Kubek
2……..Billy Gardner
OBP wise Boyer and Kubek were not much better than Richardson. Boyer batted .224 with 3.8 WAR. Gene Tenace and Roy Cullenbine are the only 2 players to hit .224 or less and have more WAR. Those 2 guys piled on the walks, Boyer piled on the defense.
The relatively low OBP for most of the 1980’s (with a couple of outliers) is a little surprising when you stop to consider that arguably the three greatest leadoff hitters of all time- Ricky Henderson, Tim Raines & Paul Molitor were all active and in their youthful prime the entire decade.
Especially since Omar “The Out Maker” Moreno was a significant factor for maybe 2 or 3 seasons early in the decade.