
Or so it seems with the performances to start this season of two grizzled veterans and presumptive HOFers. I’m speaking, of course, of David Ortiz and Ichiro Suzuki who are reminding us why we won’t soon see their likes again.
More after the jump.
Ortiz is reportedly playing his final season though I imagine that, as a free agent after this year, more than one team may try to persuade him to rethink his future plans. The reason, plainly enough, is off-the-chart numbers that project Big Papi to post a career best WAR total. Already, his 3.4 WAR as of this writing is higher than the total for either of his last two seasons and puts him in easy reach of his best total of the past eight years, a 4.4 mark in 2013. His career best 6.4 in 2007 may be a stretch, but not if he posts a second half anything like what he has done so far this season.
Here are Ortiz’s numbers through Boston’s first 75 games, what they project to for 162 games, and a second projection based on half of the first projection for the rest of the season. Barring injury, Ortiz is likely to play much more than shown in the second projection, so his counting stats should surpass most of those still impressive totals. In fact, were Ortiz to compile those second projection totals while playing as much as in the first projection, his rate stats would end up as the still respectable numbers in the third projection. Most likely, Ortiz will surpass those third projection totals as, for example, he would have to bat .170 the rest of the season to finish with the .247 BA of projection #3.
| Rk | Player | WAR | TB | XBH | G | PA | AB | R | H | 2B | 3B | HR | RBI | BB | IBB | SO | Pos | |||||
|---|---|---|---|---|---|---|---|---|---|---|---|---|---|---|---|---|---|---|---|---|---|---|
| Thru 75 G | David Ortiz | 1.112 | 188 | 3.3 | 170 | 49 | 69 | 291 | 249 | 34 | 84 | 30 | 1 | 18 | 61 | 40 | 10 | 40 | .337 | .430 | .683 | *D/H |
| 162 G Proj #1 | David Ortiz | 1.112 | 188 | 7.1 | 367 | 106 | 149 | 629 | 538 | 73 | 181 | 65 | 2 | 39 | 132 | 86 | 22 | 86 | .337 | .430 | .683 | *D/H |
| 162 G Proj #2 | David Ortiz | 1.112 | 188 | 5.2 | 269 | 77 | 109 | 460 | 393 | 54 | 133 | 47 | 2 | 28 | 96 | 63 | 16 | 63 | .337 | .430 | .683 | *D/H |
| 162 G Proj #3 | David Ortiz | 0.827 | 117 | 5.2 | 269 | 77 | 149 | 629 | 538 | 54 | 133 | 47 | 2 | 28 | 96 | 63 | 16 | 63 | .247 | .327 | .500 | *D/H |
| Age 40+ Record | Various | 0.924 | 158 | 6.3 | 286 | 62 | 162 | 720 | 634 | 121 | 207 | 35 | 17 | 34 | 108 | 132 | 43 | 128 | .357 | .440 | .508 | Various |
| Oldest Lg Leader | Various | 39 | 39 | 39 | 35 | 36 | 41 | 38 | 38 | 36 | 39 | 39 | 38 | 39 | 38 | 42 | 42 | 36 | 39 | 40 | 39 | Various |
To provide some context for Ortiz’s season, the table above shows the season records since 1901 for players aged 40 or older (rate records are for qualified seasons). Clearly, Ortiz is poised to surpass (or smash) many of those marks, starting with the the doubles record which could possibly fall as early as the All-Star break. In six of the seven categories (bolded above) in which Ortiz was leading his league after 75 games, he is on pace to become the oldest league leader since 1901, as shown in the last row of the table (the age 40+ record holders and oldest league leaders are shown at the end of the post).
As the season began, there was some doubt as to whether Ichiro Suzuki would play often enough or well enough to record the 65 hits he needed to reach 3000 for his career. That skepticism was understandable for a 42 year-old who posted a .229/.282/.279 slash last season, as players with a .561 OPS are scarcely in demand, most particularly after age 40 (only Rabbit Maranville‘s .539 OPS in 1933 ranks lower in 400 PA seasons aged 40+). Ichiro has answered his critics with a renaissance year that has removed any doubt (barring injury) of reaching 3000 hits, a milestone that could possibly come even before the All-Star Game.
There are few, if any parallels to Ichiro’s resurgence this year. His 2015 season of 56 OPS+ is the worst ever in 300+ PA by a player aged 40+ and one of just 10 such seasons below 80 OPS+. Of those players, none posted even 100 OPS+ in any 300 PA aged 40+ season, so Ichiro, with a 119 OPS+ as of this writing, could well be the first with such a turnaround. In fact, at an age at which most players are winding down their careers with (usually) indifferent results in (very) limited playing time, Ichiro has become just the 20th player since 1913 to amass 150 PA over his team’s first 75 games in his age 42 or older season.
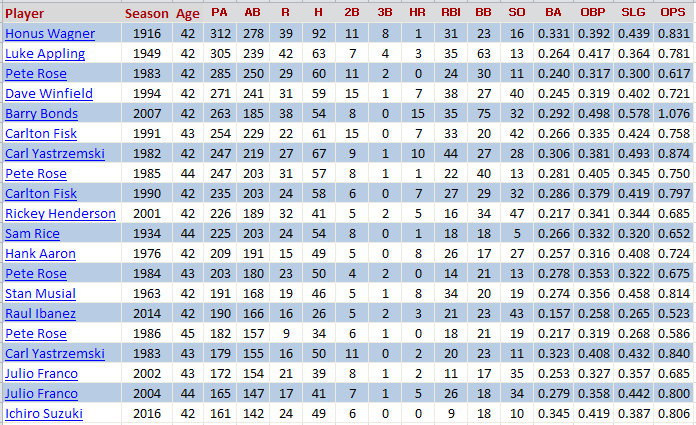
Ichiro is last in PA on the list above but first in BA and OBP. While some leveling off of his performance to date is to be expected over the rest of the season, he certainly seems likely to post one of the best batting average seasons for players aged 42+, with only the eleven seasons below showing a .275 BA in 300 PA at that age.
| Rk | Player | PA | Year | Age | Tm | G | AB | R | H | 2B | 3B | HR | RBI | BB | SO | Pos | ||||
|---|---|---|---|---|---|---|---|---|---|---|---|---|---|---|---|---|---|---|---|---|
| 1 | Sam Rice | .323 | 324 | 1932 | 42 | WSH | 106 | 288 | 58 | 93 | 16 | 7 | 1 | 34 | 32 | 6 | .391 | .438 | .828 | 9H87 |
| 2 | Julio Franco | .309 | 361 | 2004 | 45 | ATL | 125 | 320 | 37 | 99 | 18 | 3 | 6 | 57 | 36 | 68 | .378 | .441 | .818 | *3H/D |
| 3 | Luke Appling | .301 | 619 | 1949 | 42 | CHW | 142 | 492 | 82 | 148 | 21 | 5 | 5 | 58 | 121 | 24 | .439 | .394 | .833 | *6/H |
| 4 | Sam Rice | .293 | 365 | 1934 | 44 | CLE | 97 | 335 | 48 | 98 | 19 | 1 | 1 | 33 | 28 | 9 | .351 | .364 | .715 | *9H7 |
| 5 | Honus Wagner | .287 | 485 | 1916 | 42 | PIT | 124 | 432 | 45 | 124 | 15 | 9 | 1 | 39 | 34 | 36 | .350 | .370 | .721 | *63/H4 |
| 6 | Pete Rose | .286 | 421 | 1984 | 43 | TOT | 121 | 374 | 43 | 107 | 15 | 2 | 0 | 34 | 40 | 27 | .359 | .337 | .696 | *3H7 |
| 7 | Carlton Fisk | .285 | 521 | 1990 | 42 | CHW | 137 | 452 | 65 | 129 | 21 | 0 | 18 | 65 | 61 | 73 | .378 | .451 | .829 | *2DH |
| 8 | Julio Franco | .284 | 383 | 2002 | 43 | ATL | 125 | 338 | 51 | 96 | 13 | 1 | 6 | 30 | 39 | 75 | .357 | .382 | .739 | *3H/D |
| 9 | Omar Vizquel | .276 | 391 | 2010 | 43 | CHW | 108 | 344 | 36 | 95 | 11 | 1 | 2 | 30 | 34 | 45 | .341 | .331 | .673 | *54/6HD |
| 10 | Barry Bonds | .276 | 477 | 2007 | 42 | SFG | 126 | 340 | 75 | 94 | 14 | 0 | 28 | 66 | 132 | 54 | .480 | .565 | 1.045 | *7H/D |
| 11 | Carl Yastrzemski | .275 | 523 | 1982 | 42 | BOS | 131 | 459 | 53 | 126 | 22 | 1 | 16 | 72 | 59 | 50 | .358 | .431 | .789 | *DH3/8 |
Part of the reason for Ichiro’s success this season is a career-best walk rate of 11.2% of PAs through Miami’s first 75 games. Only once before has Ichiro posted a 9% walk rate, that coming in his sophomore 2002 season when he led the AL with a career high 27 intentional passes. While players do tend to draw more walks as they get older, Ichiro is exceptional in that regard as the only player, among 23 with a 7% walk rate in 1000+ PA aged 40+, to post a walk rate below 6% before age 40.
I started this post by describing this pair as presumptive HOFers and, as likable players with elite career milestones (and, in Ortiz’s case, elite post-season results), they do seem like safe bets. That said, on a strict WAR basis, these two are borderline HOFers at best, with Ichiro likely to just nudge past 60 WAR this year and Ortiz cresting above only the 55 WAR threshold. Still, hard to see either of these players not getting a Cooperstown ticket that should come, if not on their first ballot opportunity, soon thereafter.
As promised, here is the table of age 40+ record holders, and the oldest league leaders, both since 1901.
[table id=293 /]
While I’ll agree that “on a strict WAR basis, these two are borderline HOFers at best,” I hardly think it’s fair to pretend that Ichiro wasn’t a baseball player prior to 2001. I think you HAVE to give him some credit for pre-2001 achievements, even if you heavily discount what he did in Japan. Say, he makes his debut at age-23 as a September call-up (and age-23 is probably late, considering his talent, but we’re being conservative here), assume 3.0-WAR production for age-24 through age-26 (if you think that’s too liberal, I don’t – Ichiro didn’t have a single season less than 3.5 WAR from age-27 through age-36), with 1.0 in the imaginary call-up, and you can slap 10 WAR onto his career total without a sweat. I think I was being quite conservative. Give him 3.5 WAR/year and full seasons from 22-26, and you’ve got 17.5 WAR (which, again, is not even THAT crazy of an estimate, and STILL assumes he was a better player age-27 through age-36 than he would’ve been in his early 20s, which I find immensely unlikely. The point is, Ichiro is, if you give him credit as a BASEBALL PLAYER, rather than an MLB-PLAYER, a beyond-obvious Hall of Famer, even by the numbers. That’s my stance, anyway.
I certainly agree with that sentiment. Passing Rose in major professional career hits and doing so when three years younger than Rose in his finale is also a feather in Ichiro’s cap.
Well lets not discount Rose so fast either. If you include Ichiro’s full Japanese career going back to his age 18! season, can we get some MINOR league love for Pete Rose? He didn’t even play minor league ball in his age 18 season but he had 427 minor league hits. If you add that with his major league total, he’s still ahead.
4683 > 4268. Ichiro hasn’t even passed Cobb by that metric who played minor league ball at age 17.
Not really apples-to-apples as ALL of Rose’s minor league hits were in the low minors (class D and single A). Same story for Cobb (all class C). While it’s tough to know how to handicap Japan stats, I believe most would equate them with at least high minor leagues, especially for recent years.
I think NPB league quality is generally considered to be between AAA and MLB strength, probably closer to AAA. So quad-A, basically, but that’s not an apples-to-apples thingie either.
But I agree with mosc’s sentiment that Rose’s minor league hits should count also.
I don’t care all that much about whether Ichiro’s Japanese hits are counted in his all-time hits total. But I do have a problem with counting minor-league stats, Rose’s or anyone else’s. Those are apprentice stats. They were not achieved at the top level of competition. No “minor league” of at least the last 50 years has any legitimate claim to top-level competitive status, at least since the Pacific Coast League dropped its unaffiliated status and entered the existing minor-/major-league administrative structure.
I don’t think the baseball HOF voting rules really allow for that (unlike say the basketball HOF). Not that you can really prevent voters from doing so. And honestly, I think it’s irrelevant. Ichiro will be an easy first ballot selection, even without his time in Japan.
Ortiz, on the other hand, I really have no idea what will happen. I’m not sure who his voting constituency is. The traditional stats guys will love his numbers but will hold the failed PED test against him. And they don’t tend to like DHs. The advanced stats guys don’t tend to care about PEDs but they will see his as borderline due to his WAR. And behind lots of other candidates on the ballot.
FWIW, this is what Ortiz’s B-R player page is showing.
Hall Of Fame Statistics. Player rank in (·)
Black Ink Batting – 21 (101), Average HOFer ≈ 27
Gray Ink Batting – 161 (73), Average HOFer ≈ 144
Hall of Fame Monitor Batting – 154 (81), Likely HOFer ≈ 100
Hall of Fame Standards Batting – 52 (74), Average HOFer ≈ 50
Hall of Stats has Ortiz well below the 100 cutoff line, with an 84 score, and Fred McGriff, Jason Giambi, Orlando Cepeda, Carlos Delgado and Vlad Guerrero as his most similar players (but none of them have 500 HR, 600 doubles or three WS rings).
Here’s a nice little list for the Ortiz supporters. Players with extra-base hits in 13% of 5000+ ABs (Ortiz’s 13.8% rate is 6th highest all-time).
Generated 7/5/2016.
If you search with PA instead of AB, and use 11+ percent, you get the same list for the Top 10, but then McGwire drops off and it goes:
881 … DiMaggio
847 … Juan Gone
791 … Belle
781 … Greenberg
619 … Braun
572 … Chick Hafey
And then a few current players under 5000 PA:
366 / 3258 … Giancarlo
231 / 2003 … Arenado
136 / 1179 … Corey Dickerson
77 / 691 ……. Randall Grichuk
It’s ridiculous to look at only the career regular season stats of David Ortiz and make an analysis of his career based on that.
His post season heroics are what take him from a borderline guy to a no doubter.. (PED stuff aside)
One day I hope that the stats community better integrates the post season into this type of stuff. In the case of Ortiz, we’re talking about 82 of the highest leverage games of his career, and he stepped it up and hit like a beast against better pitchers. He played in 3 World Series, was the winner in all of them, and put up a 1.372 OPS in them. How many regular season WAR is that worth?
The problem with taking post-season into consideration is it penalizes a guy like Mike Trout. Do we blame Trout for not getting the opportunity because his front office is incompetent and can’t surround him with decent players (example, their pitching staff is 4.9 wins below average)? Then how can we reward Ortiz for being lucky enough to play with Pedro, Schilling, Ramirez, Pedroia, etc.?
Yes, what he did in the playoffs is impressive and it can be considered as a factor, but only as a tiebreaker or something like that. It’s not like Fred McGriff or Jason Giambi, to pick two comps from post #4, were bad in the playoffs – they both had OPS of over .900 for their careers.
Adding to BRP’s comment. modern day players get a lot more postseason opportunities than players from times past. More teams in the playoffs, more rounds of playoffs, etc.
From 1901-1968 out of 8446 ML players 1323, or 15.7%, played in post-season. From 1969-2015 out of 8985 ML players 2522, or 28.1%, played in post-season.
To that end, Ortiz has about the same number of post season plate appearances as Wagner, Williams, Mays, Aaron, and Cobb and Hornsby combined.
brp, I think “penalize” might be too strong of a word. Mike Trout is almost unilaterally regarded as baseball’s best player and Clayton Kershaw is seen as baseball’s best pitcher. Trout having no postseason record or Kershaw having a very dubious one has not had enough of an impact to dislodge either from their rightful place as baseball’s best players.
I don’t really see historical evidence that players are penalized for little/ poor postseason play, either.
–Andre Dawson played in only 3 postseason series, put up a .475 OPS, but made the Hall of Fame.
–Dave Winfield went 1-for-22 in his first WS, was labeled “Mr. May” by his owner, and finished his career with a .641 OPS in the postseason. It didn’t matter a bit. He made the Hall on his first try.
–Phil Niekro and Ferguson Jenkins had a combined 14 innings of postseason work. But there was no “penalty” for that — Fergie made it to Cooperstown on his third try and Knucksie his fifth.
–Willie Mays had 1 HR in 99 postseason PA and has exactly as many OPS points as career HRs (660). Yet he is to this day regarded as perhaps the greatest player in MLB history, or is at the very least always in the discussion. His poor postseason record becomes less important as the decades go by, in my opinion.
–As far as steroid era players, Bagwell and Biggio are probably the two most imfamous postseason underachievers, yet one is already in the Hall (Biggio) and the other’s induction is imminent (Bags).
So I think in a general sense we do not penalize players for poor or no postseason work. Instead, we celebrate the ones who do excel when the games matter the most, as we should.
I think the dynamic at work here is analogous to the way a lot of us treat negative-WAA seasons in the twilight of players’ careers — we generally ignore those because we believe that poor play late in a great career shouldn’t take away from earlier greatness. Same thing with the postseason. If you excel, great. If you don’t, no harm, no foul.
As for the concept of “fairness”, yes, it is unfair for players who constantly play on bad teams. But life isn’t fair. Baseball isn’t fair. But, again, they aren’t actually penalized for this. I think the way it should be stated is something like, “Players on bad teams unfortunately miss out on opportunities to add to their list of accomplishments and/or add to their overall body of work.” Nothing stronger than that, because that accurately reflects the way most of us digest sports.
This unfairness shouldn’t stop us from celebrating the players who do perform well on the big stage, mainly because the omission of these accomplishments paints such an incomplete picture of their careers. Sandy Koufax wasn’t just a guy who had four great regular seasons. He’s a guy who did that and dominated two World Series and pitched well in a third, all in that same four-year span. The impact of those accomplishments still echo, strongly, across the baseball universe. So do Bob Gibson’s. And so will what David Ortiz has done. And we should recognize that.
Also, could the coaching of Barry Bonds possibly be having a role in Ichiros increased plate discpline?
Good point, Jimbo. Certainly couldn’t hurt to have that kind of coaching, especially being another LH hitter.
Ichiro’s sudden rise in walk rate reminds me of Pete Rose’s 1985 (age 44) season when a posted a 17.2% walk rate in 501 PA. That came after four straight seasons below 10% and with a previous high of just 13.7%, eleven years before. My first thought was that maybe Rose batted eighth a lot that year and got those extra free passes ahead of the pitcher, but no, he was in his customary position near the top of the order, with about 60% of PAs batting second and most of the rest batting third (with .301 slugging from that spot, ugh!). Evidently Rose was simply adapting (with some success) to no longer being able to catch up to a good fastball.
Nothing fills my day with more joy than a celebration of David Ortiz. Since I’m a political junkie as much as a baseball one, Ortiz is the perfect representative of the bipolar approach we often take to both. If you are a critic, you point out his position, his WAR, his PED issues, and the inexplicable way that MLB promotes him, while shunning and penalizing other users. If you are a fan, you exult in his accomplishments and place him with the baseball gods.
I think part of the reason that Ortiz has become the people’s choice is that he succeeded in something that few accomplish, by resurrecting his career well into his thirties. After a miserable 2009 season, he started 2010 in a terrible slump and looked for all the world like he was done. But, he got himself back in shape, took a more selectively aggressive approach at the plate (hitting good pitches early in the count – I did a piece on that at the time), and brought his career back from the dead, and then some.
How can you not like that storyline!
Doug–being a Yankee fan perhaps blinds me to his charms, but we have several all-time greats who are presently waiting for admission to HOF who were also high performers at a late age–but had the PED taint. Clemens won the Cy Young at 41, finished 3rd the year after while leading the league in ERA. Bonds put up an insane year at 39. At 41 and 42, he managed 4.0 and 3.4 BWAR with ridiculous OBA’s.
Papi clearly has a better personality (cursing notwithstanding) but there’s no question he gets markedly different treatment.
Mike L – This Indians’ fan is also blind to his charms. Far from likeable, I find him to one of the least likeable players in all of sports. In addition to possible/probable PEDs used, it seems like all he never does is whine and complain. I say good riddance…
I’m rather late to the party, but—the most relevant event of Ortiz’s career was when he was signed by the BoSox. Why? Because the most relevant element of Ortiz’s success is Fenway Park. In this he is rather like Larry Walker, only not as good, in so far as 1) after his early years in the majors he, too, found a home park particularly suited to his batting style, but 2) whereas he was a marginal player for most of his early years, Walker gained All-Star credit, a Silver Slugger award, and some fielding honors while still an Expo.
I didn’t do all the math, but Ortiz’s Home/Road splits for OPS are approximately negative .100 as a Twin and positive .100 as a Red Sock. This is far from an abnormal situation, actually: Fenway produced a +.131 split for Jim Rice, +.125 for Yaz, +.149 for Dom Dimag, +.087 For Dw. Evans, all Boston lifers.
At any rate . . . anyone pumping for Otiz’s enshrinement had better be pumping for Walker’s first. He could field as well as hit at home.
Ortiz’s career slash lines in the ballparks he’s had the most PA:
.311 / .408 / .588 / .996 … Boston (4206)
.269 / .353 / .428 / .781 … Metrodome (952)
.264 / .352 / .591 / .943 … Totonto (537)
.258 / .361 / .505 / .865 … Baltimore (521)
.262 / .391 / .559 / .951 … St. Petersburg (506)
Ortiz’s career home OPS is 69 points higher than away OPS. Walker’s career home OPS is 203 points higher than away OPS. I don’t really see a strong similarity, nsb. Ortiz’s career home/road tOPS+ split is 108/92, which looks fairly normal for a guy who’s played almost 15 years at Fenway.
Ortiz also has 70 fewer home HRs than road ones. The one stat where he’s really benefited is doubles — 134 more at home than on the road (Wade Boggs has a similar-looking split.) So, in an average park all these years, Ortiz would probably be somewhere around 600 HRs and 500 doubles, which would be fewer XBH overall. So, more than anything, his rank on career XBH lists that Doug outlined above is definitely a Fenway thing. But he’s not the only Red Sock on that list, of course.
Bstar:
Over 17% of Ortiz’s PAs occurred for the Twins, where his H/R OPS split was basically the reverse of that playing for Boston. The difference can be seen in a general sense in Voomo’s list (#21 above), which shows a .215 differential between his OPS in the Metrodome and Fenway. Someone with more time than I have—or an in to the statistical workings of B-Ref, maybe—could work out the exact split for Fenway, but it isn’t .069, which covers his whole career, not just his Red Sox years.
To me there’s no getting around the fact that Ortiz was cut loose by the Twins in 2002 when they couldn’t trade him in spite of his having a decent year—20 HR, 120 OPS+. They didn’t want him, and no other teams wanted to give up any talent to get him. After signing as a free agent with Boston at a pretty bargain-basement rate he rode the bench for a while the following year, but suddenly, given a chance, he blossomed amazingly, especially at Fenway.
As for his greater number of HRs on the road is concerned, 1) that’s not unheard of for BoSox left handed batters; 2) it gives a lift to his away OPS that a lesser hit would not. The career .039 drop in BA from home to road I’d guess is even greater in his Fenway years, and my feeling is that while the dingers compensate to a degree for the drop in average, they don’t make up for it entirely.
Regarding the comparison between Ortiz and Walker, the point was not that they were cloned from the same model but that they both became much more productive players at approximately the same point in their careers by adapting their talents to a new home park environment in which they were particularly comfortable and which they found that they could exploit. Ortiz appears to have became a more productive overall hitter home and away, but, unlike Walker, he wasn’t dropped into the extreme environment of Coors, just the very friendly confines of Fenway.
A question to one and all: what kind of career would Ortiz have had if the DH rule were not in existence?
I’ve found a way to get H/R OPS splits for partial careers using the Split Finder.
Ortiz Twins overall OPS: .809
Ortiz Twins home OPS: .791
Ortiz Twins away OPS: .827
So, yes, a reverse split but only a 36-point difference.
Ortiz BOS overall OPS: .957
Ortiz BOS home OPS: 1.002
Ortiz BOS road OPS: .911
A 91-point difference.
Here’s Larry Walker in Colorado, which unfortunately includes 40 games with St. Louis in 2004 because I don’t know how to separate that from his 2004 Rockies tenure. But 40 games is only 3-4% of his games from 1995-2004. Anyway:
Walker ’95-’04 overall OPS: 1.041
Walker ’95-’04 home OPS: 1.174
Walker ’95-’04 road OPS: .899
That’s a 275-point difference, about 300% bigger than Ortiz’s difference in Boston.
It’s really the disparity in those two differences that makes me question whether these two situations can really be considered “similar” from a strictly numerical perspective, though it’s certainly true in a general sense that both players did improve upon switching teams.
Using the PI Game Finder I found that with Colorado from 1995-2004 Walker’s OPS values were 1.044 overall, 1.179 at home and .899 on the road.
Richard, great! I’d love to hear how you did that. If you happen to have the component parts of his OPS for that time period (home/road OBP and SLG), I can finally compute Walker’s tOPS+ splits for his time in Colorado. Back-of-the-envelope says around 126/74 but I’d like to get a definite number, if only to satisfy a personal curiosity.
Reply to #32. Here are the steps I took.
Player Batting Game Finder
Most Matching Games in Multiple Years
Years From 1995 To 2004
Player’s Team Rockies
Home
Get Report and look for Walker’s name on the list
Then repeat but replace Home with Visitor
Repeat again but replace Visitor with Either
Good points by Bstar @17, and NSB @18. Piling in here a little bit more:
1. On post season, yes, Ortiz did do it, and he deserves credit for it. But it’s an enhancement to his resume, not a ticket to Cooperstown. I think the Boston media perhaps overestimate the centrality that Red Sox World Series wins hold in the hearts and minds of the rest of the country.
2. I don’t think there’s any question that if I were picking a roster, I’d grab a multifaceted player (including glove and legs) like Larry Walker, who, like Oritz, had stats that were enhanced by his environment, before I’d take Ortiz. Walker has been in the teens on HOF voting.
3. And, one more thing, which is where I started. I just don’t see how we relegate a generation of PED-tainted players to the dustheap but assume that Ortiz is the only clean one (or the only one where it doesn’t matter)–which is what Ortiz’s boosters insist we do. You want to say PEDS don’t count–then reset your thinking. A Hall that welcomes Ortiz and keeps out players far greater (Clemens, Bonds, and A-Rod when his time comes) is acting irrationally.
OK, I’m done. I’m going out to use 60 year old-non-PED enhanced legs in a run through Central Park. No-one one from the Track and Field Hall of Fame will be watching. Glad to see HHS gaining steam again.
Bstar – As Mike L says, you make some fair points.
But counter to Mike’s #1, Ortiz’ postseason resume is good, but it’s nowhere close to what the media has built it up to be.
His overall postseason OPS is .962. Looking just at the years his teams made the postseason, his weighted OPS those years is .957. So he’s basically performed at the level we would expect him to be. Now, there’s nothing wrong with that but Ortiz is no Carlos Beltran.
Of course, Ortiz supporters will point out that it’s the WS where he’s really shined, putting up a 1.372 OPS. But let’s look at that in more detail.
In 2004 and 2007, the Red Sox swept the World Series and Ortiz was 4th among Red Sox regular position players in OPS in both of those World Series. Of course, if you factor in fielding and baserunning, he probably wasn’t their 4th best position player in those two World Series. So his contributions to those two WS victories were negligible at best.
The 2013 WS, of course, is where he really shined, putting up a 1.948 OPS which was more than 3 times greater than the #2 Red Sox hitter (Ellsbury at .599). Of course, that WS was as much about the Red Sox pitching staff (1.84 ERA) as it was about Ortiz. And you can’t mention 2013 without also mentioning this: Ortiz was absolutely dreadful in the ALCS putting up a .427 OPS (yes, he had the big grand slam to tie up game two but that was his only run and rbi’s of the whole 6 game series).
Has Ortiz been good in the playoffs? Yes, no doubt about it. But he’s not the transcendent, mythological creature, single handedly carrying his team to WS victories that the media has made him out to be.
Mike, I agree with a lot of what you say.
1. “I think the Boston media perhaps overestimate the centrality that Red Sox World Series wins hold in the hearts and minds of the rest of the country.” I don’t mean this in a mean way, Mike, but do you not sense a little irony in this statement considering you are a Yankees fan? Non-fans of either NY team or the Bosox have to suffer through over-coverage of these three teams every single year. I’d say any Cub haters out there are having a tough time this summer, too.
2. I would pick Walker, too, for sure, because he was a better player than Ortiz.
But I will say this. If you’re entering the postseason and you have a choice between a 5-WAR player who is an all-around player and a 5-WAR player who is a 150 OPS+ hitter but below-average everywhere else, I would take the latter, because it’s more likely that the great hitter is going to get hot and dominate a playoff series than the all-around player.
It’s much harder/rarer for a guy to significantly impact a playoff series with great baserunning and fielding simply because those traits tend to build up value over time, game-by-game, week-by-week, while hitters tend to accumulate their value more in discrete bunches. My suspicion is that this is one of the biggest reasons why great hitters make more money than all-around players of similar value.
The only dominant fielding postseason series I recall are Brooks Robinson and maybe Graig Nettles. The 2014 Royals would be the rare example of excellent (fielding + baserunning) at the team level. I don’t recall any others.
Let’s say Ortiz has been a 3-4 WAR player. His DH status notwithstanding, I would rather have him for the postseason than a great-fielding shortstop with an 85 OPS+ who is also a 3-4 WAR player, for the reasons outlined above (though I wouldn’t want a whole team of Ortiz players.)
3. Yes, the HOF is a mess. It’s beyond nuts that Bonds and Clemens aren’t in. But do you not think there are different levels of steroid use/taint? If not, you’re saying that what Andy Pettitte did (HGH use to recover from an injury) is the same thing as what A-Rod did (used before and after baseball banned steroids). I don’t think those two should be lumped in the same category because they’re clearly not the same thing. Just my opinion. So I think David Ortiz deserves only the same steroid taint as maybe a Kevin Brown or Gary Sheffield, but not as much as an A-Rod or Manny Ramirez.
Bstar–yep–I knew what I was saying “I think the Boston media perhaps overestimate the centrality that Red Sox World Series wins hold in the hearts and minds of the rest of the country.” Just having some fun with it.
On the steroid front, I understand the point you are making, and I do accept the idea that there are differences in degree. But older players currently on the outside–like Bonds, Clemens, McGwire, Palmeiro, played the bulk of their careers in an era when PED use was either ignored, or officially penalized, but tacitly tolerated and even encouraged. What people are doing, once you take out the most flagrant of cases (and A-Rod and Manny would be the big names there) is applying a nuance based on popularity. We don’t really know what any players does–we know who got caught. And what we know from other sports is that doping is an extraordinarily sophisticated enterprise and often goes undetected for long periods. So, to use your analogy, if Ortiz only deserves the same steroid taint as Sheffield or Brown, Sheffield is sitting at under 12% in the vote and Brown was one and done. Yet Ortiz is an obvious first ballot?
Ortiz is going to make it in, probably first ballot. Others will need a ticket to see the place. Special rules for special people, and episodic application of morality to suit public relations needs. There was a time that MLB couldn’t get enough of Clements, McGwire, Bonds, Sosa. Fannies in seats. The same applies to Ortiz. He’s going in. Doesn’t make it equitable.
Again, I agree with just about everything you say, Mike. Perhaps I’ve sent out confusing signals — no, I do not think Ortiz SHOULD be an obvious first ballot inductee, or an inductee at all, but I suspect/fear that he will be. Too many career HR & XBH, too many postseason walk-off hits, and not enough steroid taint to cancel those out.
Sheffield/Brown probably weren’t the best examples I could have used. Maybe Andy Pettitte is the only relevant comp, because I do think he will not be judged as harshly for HGH use.
One other aspect that may separate Ortiz from others who have failed a test — he has played a much larger portion of his career outside the steroid era than guys like Bonds, Palmiero, Sosa, etc, even more than A-Rod. So the type of voter who refuses to vote for anyone from that era probably feels that Ortiz doesn’t necessarily fit under that umbrella. Maybe, maybe not. Again, not campaigning for the guy, just trying to explain the dynamic.
Bstar –
I find your #2 quite confusing, making it difficult to respond to but I’ll do my best.
“His DH status notwithstanding, I would rather have him for the postseason than a great-fielding shortstop with an 85 OPS+ who is also a 3-4 WAR player, for the reasons outlined above.”
That’s an obvious false choice since no manager would ever be faced with that decision. But if they were, then you’d have to take it to its logical conclusion. In other words, if you’re choosing Ortiz over the great fielding shortstop, that means that you now have to play Ortiz as your shortstop. And if you did, I think you’d quickly see that defense is about more than just dominating. It’s also about making the routine play. And it’s also about turning the double play when another fielder wouldn’t. Or scooping the low throw at first instead of letting it get past you. Those sort of plays may not make the ESPN highlight reel but they can have a huge impact, especially in a short series.
“…it’s more likely that the great hitter is going to get hot and dominate a playoff series than the all-around player.”
Even if we stipulate that hot streaks exist (and I doubt they’ve been proven for a series of 4-7 games), there are several problems.
First, there’s no way to know ahead of time who will have a good hitting series. Here are the Red Sox hitters who had a higher OPS than Ortiz in the 2004 WS:
Mark Bellhorn, Bill Mueller, Manny Ramirez
And here they are for 2007:
Mike Lowell, Jacoby Ellsbury, Julio Lugo
Of those 6 players, only Ramirez had a regular season OPS that was within 150 points of Ortiz. Heck, Lugo had a 65 OPS+ in 2007, yet outhit Ortiz and his regular season 171 OPS+.
Secondly, you’ve missed the opposite problem. If a one-dimensional hitter has a cold streak during the short series, then they have no other way to contribute. Whereas an all around player has multiple ways to contribute. Just take Willie Mays who you cited above as someone who failed to hit in the WS. Mays, as I’m sure you’re aware, made one the the greatest defensive plays in the history of the WS. Long-time Indian fans insist that that play changed the entire complexion of the series.
As for PEDs, we’ll obviously never know who used what, for how long, and for what reason(s). Relying on failed tests has proven to be incredibly unreliable evidence (the vast majority of players caught in the Biogenesis scandal had never flunked a drug test). And we obviously can’t take players at their word. I do think it’s interesting that Ortiz is now using the Bonds’ defense (I’ve never knowingly put anything illegal in my body) and the Lance Armstrong defense (I’ve been tested more times than anyone else). Make of that what you will…
I hope Barry Lamar comes back for a few pinch-hitting appearances this season so that he can be exempted from the HOF discussion for another half decade.
Boston wasn’t cursed, they just thought they were. Looking at the five major sports leagues (from a blog post I wrote)…
Let us turn back the clock to the beginning of the 2004 baseball season, before the Red Sox ended their curse, and look at the longest droughts in professional sports at that time.
NL World Series : Chicago Cubs, 1908 (last Boston Braves series title : 1914)
NL Pennant : Cubs, 1945 (Boston Braves : 1948)
AL World Series : Chicago White Sox, 1917 (Red Sox : 1918)
AL Pennant : White Sox, 1959 (Red Sox : 1986)
Stanley Cup : Chicago Black Hawks, 1961 (Bruins : 1971)
NFL : Chicago Cardinals, 1947 — even moving away from Chicago did not help them any (Patriots won the Super Bowl after the 2003-04 season for their second title in three years)
NBA : Celtics 16 titles (last in 1986), Bulls 6 (last in 1998) — however, the Bulls had not made the playoffs since their last title
Since the Early Season thread is no longer really applicable, I’m putting my Danny Salazar update here:
Last night saw a third less-than-stirling outing out of four, 6 earned runs in 5.2 innings—thanks in part to his reliever Otero, who allowed a 2-out bases-loaded triple which put the Yanks ahead and threatened Salazar with his first loss since god knows when. Four days of rest again. Eight hits, only 2 walks—112 pitches, though, and ERA skyrocketing to 2.75 from 2.36. One bad outing can do that. He still leads the AL in WAR, though.
A couple more things, vis-a-vis Ichiro:
He’s now only 10 hits away from 3000. That is so insane. I’m so glad to see him do it.
I was also looking at his OPS+ numbers. He hasn’t been over 100 in 5 years. I don’t even know how to phrase such a query on the Play Index, but I’ve got to think that it’s just about unique in the annals of MLB to be a sub-average hitter for 5 years, and then come back with a vengeance at age-42 and be above average, much less to do so with the 121 OPS+ Ichiro’s currently sporting.
Not quite the same but Julio Franco put up a 94 OPS at age 38 in 1997. He was then basically out of MLB for the next 3+ years, other than a token PA with the Rays in 1999. He returned to the majors in 2001, a few days after turning 43, playing full time for the Braves down the stretch and compiling a 109 OPS+.
Here’s the closest I found for position players. From ages 38-41 Deacon McGuire was a sub-average player and at age 42 he had an OPS+ of 110 with 159 PA. From ages 34-40 Jimmy Dykes was sub-average and had an OPS+ of 105 at age 41 with 99 PA.
From ages 33-39 Bert Campaneris had an OPS+ of 92, 88, 78, 37, 58, 75 and 85. After being out of the ML for age 40 he came back with the Yankees at age 41 and produced 101 OPS+ with 155 PA. His .322 BA that year was the highest of his career and the only time he hit above .290.
It was at a younger age, but same pattern for Davey Lopes who posted 84 OPS+ age 35-37 (season scores were 87, 66 and 90) and followed that with four straight years (age 38-41) of 290+ PA and OPS+ above 115.
Stan Musial posted a better season at age 41 than in any of the three preceding years, in terms of WAA, WAR and OPS+ (he had 0.1 total WAA for 1959-61, but 1.7 WAA in 1962). In that expansion year, Musial beat the Mets like a drum with 1.347 OPS but was woeful against the Colt .45s with only .599 OPS.
At the AS break, the combined W/L records of the 10 AL starters with a SO/9 above 9:
61 – 71
The top two guys, Pineda and Archer, are 7 -20.
In the NL it is what you would expect:
87 – 46
And 53 – 16 from the top 5.
____________________________
Pitching Records that could be broken this year:
WHIP:
.7273 … Kershaw (2016)
.7373 … Pedro
.7803 … Walter Johnson
.8062 … Addie Joss
.8108 … Greg Maddux
SO/BB
16.1111 … Clayton Kershaw 2016
11.6250 … Phil Hughes
11.0000 … Bret Saberhagen
10.2778 … Cliff Lee
H/9
5.2606 … Nolan Ryan
5.2955 … Luis Tiant
5.3064 … Nolan Ryan
5.3088 … Pedro Martinez
5.3257 … Ed Reulbach
5.5208 … Marco Estrada 2016
Notable:
Juerys Familia has 31 Saves.
Couple of Josh Donaldson factoids.
– He has 20 home runs and 80 runs scored at the A-S break. Which other five players have done this?
– He is on a run of 23 consecutive stolen bases with his last caught stealing more than three years ago. If he avoids a CS the rest of the year, he’ll be the first searchable player with 3 consecutive seasons of 5+ steals and no CS.
– Barring injury, this will be his fourth consecutive season with 5 WAA to join Wade Boggs (5 straight) and Mike Schmidt (4 straight, twice) as the only third basemen with that accomplishment.
One of them is Manny Ramirez – 25 HRs and 96 RBIs at the All Star break in 1999.
It’s 80 runs scored, not 80 RBI.
Oops saw what I wanted to see. Then we’ll go with the guy who was on pace to break the home run record but didn’t even make it to 50. In 1969, Reggie Jackson had 37 homes runs and 84 runs scored at the All-Star break.
Correct.
One of the others is an active player, and the other three, like Reggie, are HOFers.
Doug: I am at a loss. My PI Split Finder run for the First Half shows 11 different players who meet the criteria during the All-Star game era. Evidently the PI defines the First Half of a season as ending with the date of the All-Star game.
Just goes to show can’t rely on stuff on the Internet (even stuff with a cachet of rigor about it). I didn’t check because I thought that Split Finder was using actual 1st and 2nd halves, and not using the A-S break as a cutoff. Thanks for checking it out.
Here’s Richard’s list:
Generated 7/12/2016.
Trout has moved up the list…
Plate Appearances per Win Above Average (PaWaa)
Career – Minimum 2000 PA
84.4 … (10622) Babe Ruth
97.2 … (9480) Rogers Hornsby
99.8 … (3263) Mike Trout*
102.1 … (12606) Barry Bonds
104.0 … (9788) Ted Williams
113.5 … (12496) Willie Mays
123.1 … (9663) Lou Gehrig
125.7 … (9907) Mickey Mantle
127.7 … (11748) Honus Wagner
128.5 … (13084) Ty Cobb
If trout decided to go play football or something, I’d vote for him for the hall of fame. The peak and WAA are high enough, career wise. Age 24 be damned. I think it’s a moot point because he’s hardly done producing but this is about the point where he’s crossed my line. 32.7 WAA is more than a lot of HOF’ers and nobody who’s out has a peak 5 looking ANYTHING like trout.
If Trout is already a HOFer, what about Kershaw? And if the answer to Kershaw is yes, then what about Johan Santana?
Kershaw so far has 1732 IP, 51.9 WAR, 38.2 WAA.
During his 9 year peak (which is most of his career), Santana posted 1779 IP, 50.1 WAR, 34.1 WAA. Virtually identical to Kershaw.
Kershaw has 3 Cy Youngs (plus a second and third place), an MVP, 6 All Star games, 1 gold glove.
Santana has 2 Cy Youngs, (plus two thirds, a fifth, and a seventh place), 4 All Star games, 1 gold glove.
Both hit well. Kershaw has 1.6 WAR in 620 PAs, Santanta has 0.8 in 279.
Both pitched poorly in the playoffs. Kershaw is 2-6 with a 4.59 ERA, Santana 1-3 with a 3.97 ERA.
No doubt Kershaw is ahead. But the margin to me appears to be slim.
At the risk of stating the obvious, Kershaw has compiled Santana’s numbers in two fewer seasons. By the end of this season, Kershaw is likely to stand at least 5th and possibly 2nd among live ball era pitchers in most career WAR through age 28, with only Bert Blyleven out of reach in top spot. Being only 28 , he is likely to have two or three more seasons of peak level performance and possibly 5 or more years after that of being a top cailber pitcher, albeit below his peak level.
Even if Kershaw follows Santana in having his career derailed by injury after his age 31 season, he is likely to have compiled 20+ more WAR than Santana by that point. Ergo, as good as Santana was, I don’t see him as being that comparable to Kershaw.
Here’s the list of WAR through age 28 for live ball era pitchers (Santana ranks 26th, with 35.5 WAR).
Generated 7/20/2016.
Except my comparison between Santana and Kershaw was based on their respective 9 year peaks, which are incredibly similar. The point being that if Kershaw were to retire tomorrow, he’d probably be a first ballot HOFer. Whereas I doubt that Santana will get more than minimal support. No doubt Kershaw’s 9 year peak is better than Santana’s. But I don’t see it as so much better to justify how they’ll likely be treated by the HOF.
Doug:
Just a tiny thing your chart fails to account for: Feller, third on the list, missed nearly four years of his career prior to age 29 due to WWII service. Allow him a modest 5.0 WAR per each of those seasons and he’s so far ahead of the others that they seem mediocre.
Somehow Feller gets lost in the background when the discussion turns to great all-time pitchers. I’m guilty of that type of thinking myself. Your chart is a wake-up call.
Excellent point about Feller, nsb.
David, I would just add that their respective 9 year peaks are *currently* very similar. Assuming Kershaw isn’t derailed by his back problem, I expect his 9 year peak will improve significantly over the next few seasons.
Trout’s exceptional peak vs lifetime numbers for all time greats? That Babe Ruth fellow was pretty good….
Nobody’s saying Trout is comparable to Babe Ruth at the career level. He’s very comparable to him, though, at this point of their respective careers (Trout 44 WAR and counting during age-24 season, Babe with around 40 WAR after age 24 season, including pitching WAR.) Ty Cobb leads with 47 WAR at that age, which Trout will likely pass later on this season.
If we can’t get excited about the start of Trout’s career, who will we ever be allowed to get excited about in this regard?
Wasn’t dissing Trout, Bstar. Marveling at the sustained performance of inner circle HOFers.
Just for fun.
Ichiro’s entire MLB career (ages 27-42) vs.
Pete Rose ages 27-42
25.9 WAA, 60.0 WAR……Ichiro career
26.1 WAA, 60.4 WAR……Rose age 27-42
Ichiro 2 batting titles, 1 MVP, tons of counting-stat black ink
Rose 3 batting titles, 1 MVP, tons of counting-stat black ink
43.6 WAR7 peak (9-8-6-6-5-5-5)……Ichiro career
44.3 WAR7 peak (8-7-7-6-6-5-5)……Rose age 27-42
2433 G, 10296 PA, 2994 H……Ichiro career
2491 G, 11334 PA, 3091 H……Rose age 27-42
.314/.357/.406/.753, 108 OPS+……Ichiro career
.309/.383/.418/.801, 123 OPS+……Rose age 27-42
But Ichiro closes that OPS+ gap with excellent baserunning, the best DP avoidance in MLB history, and Gold-Glove defense in right.
So, Ichiro career and Rose for that same 16-year age period are very comparable. Rose’s years prior to that (18 WAR) are also a pretty good guess for what Ichiro would have done had he played in the U.S. earlier. You could probably justify a little more WAR for Ichiro because you don’t really need a 4 or 5-year break-in period to become an elite defender. He likely would have been putting up great Rfield numbers very early in his career.
Nice stuff, bstar.
Kind of eerie how close those numbers are.
By the end of the season, Rose will likely have had 850-900 more PA than Ichiro aged 27-42 but less than 100 more hits. Part of the explanation is one number that wasn’t mentioned among all the similar totals, Rose’s 1157 to 619 edge in walks. Another number that’s quite different is Ichiro’s 506 steals to only 146 for Rose.
Here’s the Top 10 for Hits aged 27-42 (I don’t think I ever would have come up with number 7).
Generated 7/20/2016.
Doc Cramer is also an unlikely member of this group. What is the accomplishment that only these players share?
Generated 7/20/2016.
Don’t know where to post this so I’ll do it here. I just read that Jacoby Ellsbury’s 9th time reaching on catcher’s interference tonight is an ML seasonal record. Heres’ a list I got for the most in a season since 1930, listed by number of C.I., year and player.
8….1992….Roberto Kelly
7….1983….Dale Berra
6….2012….Tyler Colvin
6….2010….Carl Crawford
6….2004….Craig Counsell
6….1987….Alan Ashby
6….1986….Johnny Ray
6….1978….Bob Stinson
6….1965….Pat Corrales
Of course data prior to 1974 is incomplete.
Not sure that it’s a good thing to be on this list. Seems to indicate a player who’s swinging late a lot despite standing deep in the batter’s box. Could be a sign of not being able to catch up to the heater or having trouble recognizing/reacting to pitches.
It’s not a good thing. Ellsbury is exactly the player that the Yankees should have understood they were signing, with a bit of age regression. 7.3 bWAR in two and a half years. Not at all bad, still useful, not in the least bit worth the commitment they made. Prior to that, he had a terrific 2011, and a good contract year in 2013. Plus two seasons where he couldn’t stay on the field, and two others with 3.0 and 2.8 bWAR respectively. Great salesmanship by Boras. Ellsbury has five seasons to go, with a buyout for a sixth. He’s likely to follow the path of Michael Bourne.
Back to Danny Salazar:
Tuesday he went according to his recent pattern in some ways, at least, holding the opposition scoreless until the middle innings before losing it, on this occasion giving up 3 runs in the sixth and seventh. Only one walk, 8 hits, 104 pitch count. The Tribe gave him his normal six+ runs and he’s regained his league lead in ERA and maintained his lead in WAR.
nsb, there’s a Tigers rookie pitcher named Michael Fulmer nipping at Salazar’s heels for the AL WAR lead. He’s 9-2 with a 2.13 ERA, 197 ERA+, and 3.7 WAR (only 0.2 behind Salazar) in only 84 innings. He should qualify for the ERA title sometime in his next two or three starts. He pitches Friday and will pass Salazar for the pitching WAR lead with a good start against the Chisox.
Tigers had another rookie phenom with the same initials. Here’s hoping Fulmer lasts a fair bit longer.
Ichiro just got his second hit of the night so he’s only 4 hits away from 3000. I’d say it’s a safe bet he will get starts until it happens as the Marlins just opened a 10-game homestand and will want it to happen in front of their fanbase.