Winning One Run Games and Winning Pennants

The Texas Rangers, leaders in the AL West, have posted a sparkling 19-7 (.731) record in one-run games this season, reminiscent of the Orioles’ record-breaking 29-9 (.763) mark in that situation in 2012. Barely missing the ALCS last season, could the Rangers be poised to take that next step this year? I’ll take a look at that question after the jump.

If Texas maintains a .700 winning percentage in one run game, they would become just the 16th team since 1901 with that accomplishment. Nine of those other 15 teams were pennant winners, two won a division and the 2012 Orioles won the wild card game before extending the Yankees to the limit in a memorable ALDS (the other three teams all finished second, two of them just one game behind the leader). With that pedigree, it shouldn’t be a surprise that winning percentage in one-run games correlates strongly with overall winning percentage as illustrated in the chart below.

One Run vs Overall
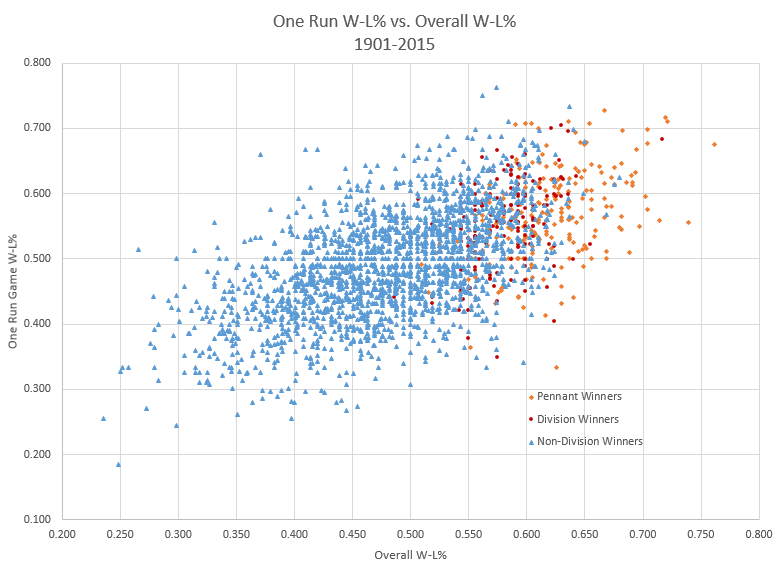
Among other things, the chart shows that no team with a .650 winning percentage (105-57) has posted a losing record in one-run games, and only two teams have won a pennant with a winning percentage under .400 in one-run games.

As would be expected, there is also strong correlation between winning one-run games and posting a positive Pythagorean deviation, as shown.

One Run vs Pythag

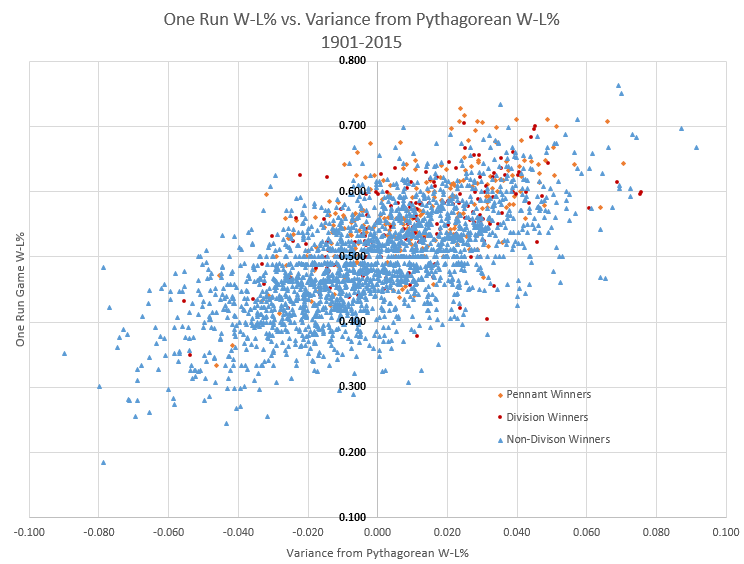
Even a .600 winning percentage in one-run games almost guarantees a positive Pythagorean deviation, something that can’t be said for the same winning percentage in games decided by two or more runs.

Two Run vs Pythag

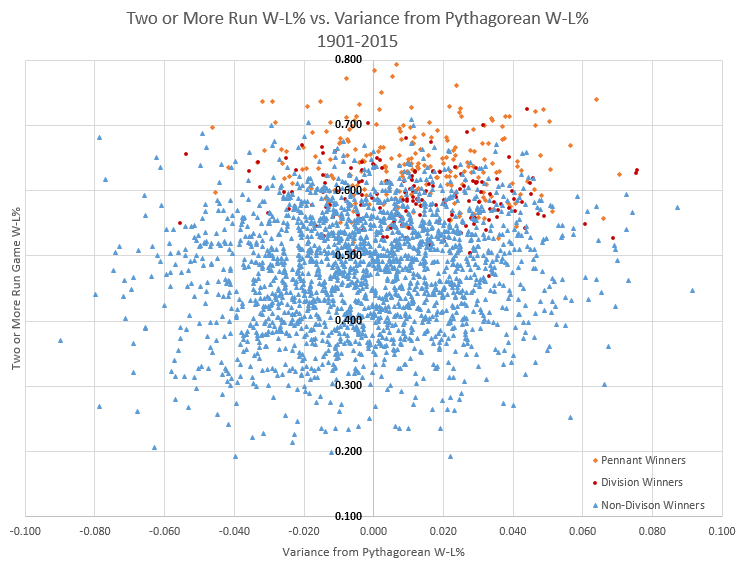
The chart above is showing very weak correlation (if any) between Pythagorean deviation and success in games decided by two or more runs. That said, you do need to have a winning record in those games to win a pennant, and probably a .600 record to give yourself a good chance at the post-season, especially if you don’t exceed your Pythagorean projection.

The last chart below is looking at the importance of succeeding in one-run games relative to run-scoring environment.

One Run vs Overall Pennant Winners

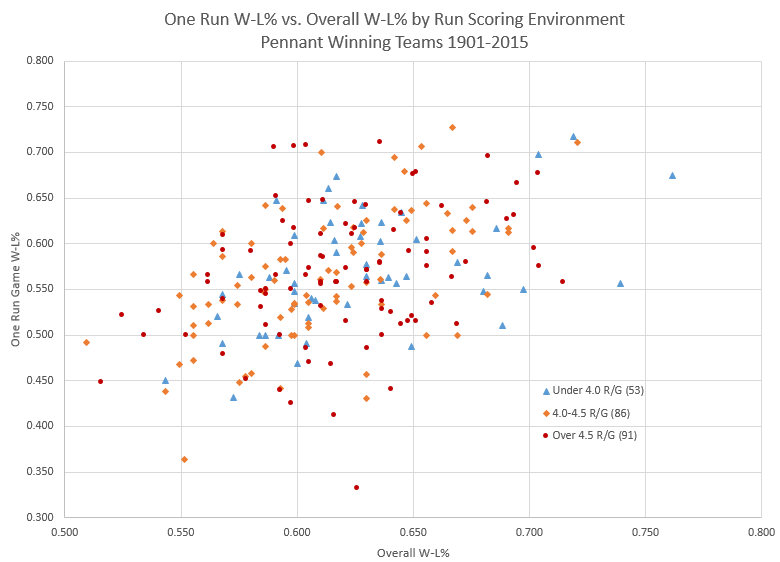
Looking only at pennant-winning teams, only 9 of 230 posted a winning percentage below .450 in one-run games, and just one of those 9 came in a season with fewer than 4 runs per team game. Below a .500 record adds twenty more pennant winners, but only four of those come from the lowest run scoring seasons. So, as would be expected, being successful in one-run games becomes a more important attribute of pennant winning teams as the level of offense diminishes.

So, where does this leave the Rangers? First, they’ll need to snap out of their current 4-12 slump pretty quickly to maintain post-season aspirations. Second, they’ll likely need to start winning more games decided by more than one run. Currently, Texas has a negative run differential in those games and are thus fortunate to have posted a 36-32 record (.529) in that situation. Only two teams have won a pennant with a lower winning percentage in games decided by two or more runs: the 1973 Mets (.520) and 1987 Twins (.526).

To close, here’s a table with some one-run game team superlatives.

[table id=296 /]

0 0 votes
Article Rating
Subscribe
Notify of
guest

18 Comments
Oldest
Newest Most Voted
Inline Feedbacks
View all comments
Kahuna Tuna
Kahuna Tuna
7 years ago

Nice work, Doug. A few years ago I investigated what team missed out on a pennant due largely to poor performance in one-run games. I concluded that it was the second-place 1909 Athletics: 95-58, 3.5 GB Detroit, 29-28 in one-run games (.509), 66-30 in all other games (.688). The ’09 A’s did suffer for not winning more close games, true, but I think I should have looked more carefully at the second-place 1935 Yankees: 89-60, 3.0 GB Detroit, 15-29 in one-run games (.341), 74-31 in all other games (.705). Whoa. Ironically, the only team against whom the Yanks fared well… Read more »

Doug
Doug
7 years ago
Reply to  Kahuna Tuna

Those ’35 Yankees have the largest spread (.364) between success in games decided by 2+ runs and by one run. It’s only one point higher than the ’48 Indians, but those Indians played 14 fewer one run games, so the bite on the Yankees was more severe as almost half of their total losses were by one run.

no statistician but
no statistician but
7 years ago

Here are some one-run scenarios: Shutout 1-0. 1-run lead taken early, both teams scoreless the rest of the way. Multiple run lead taken early, losing team closing to within one by the end. See-saw game with teams trading lead. Tie game decided in later innings. Come-from-behind one-run win in late innings. Extra inning contest. Variations on and combinations of the above. My point: it’s convenient to think of one-run games as being decided in the final frame, but actually most aren’t, except as failures by the losing team to catch up and go ahead. So, while it’s always good to… Read more »

Voomo Zanzibar
Voomo Zanzibar
7 years ago

We may have a new Three True Outcomes champion in the major leagues:

Miguel Sano.

His career stats:

148 G
627 PA

33 HR
91 BB
216 SO

Ken S.
Ken S.
7 years ago

Rangers are now 23-7 in 1-run games. They are 61-44 with a run differential of just +7 runs (500-493). I’m wondering when was the last time a team was 61-44 with that small run difference. I wasn’t able to determine this using Play Index.

The Angels have a very similar run differential of +3 (482-479), but are 47-57, 13 1/2 games behind Texas.

Richard Chester
Richard Chester
7 years ago
Reply to  Ken S.

It can be done with the Play Index but it involves a bit of work. Here’s how to do it. Streaks 105 games from beginning of season All Years Select a Team or Streaks 105 games from beginning of season All Teams Select a year I made a run for the Cubs. They were 61-44 in 1928, 1930, 1984 and 2008. The respective differentials were 73, 73, 58 and 110. Due to the possibility of tie games a separate search has to be made to find seasons with a W-L total of fewer than 105 and adjust accordingly. You cannot… Read more »

Ken S.
Ken S.
7 years ago

You can use both all teams and all years if either the “From beginning of season only” or “To the end of the season only” box is checked, but it only lists the top 200 performances. So for 105 games and ordering by Wins, 65 wins is as low as it goes.

Richard Chester
Richard Chester
7 years ago
Reply to  Ken S.

Ken S.: I ran the PI as you described above but I got the entire list of teams, not just the top 200.
Here are the 5 lowest total run differentials for teams with a 61-44 record.

-12….1984 Mets
7…..2016 Rangers
15….1966 Giants
15….1977 Orioles
18….2011 Giants

Ken S.
Ken S.
7 years ago

Thanks Richard! Don’t know how you did that, I never get anything besides top 200 and bottom 200 performances in the Streaks Analyzer.

Richard Chester
Richard Chester
7 years ago
Reply to  Ken S.

When you make your run leave the “Order By” box in its default setting of “Date”. I forgot to mention that in my comment #6.

Ken S.
Ken S.
7 years ago

I tried that and it worked. Thanks Richard, very useful tip.

Mike L
Mike L
7 years ago

Can I suggest a new article (or just a new thread) on the trades?

David P
David P
7 years ago
Reply to  Mike L

I’ll second Mike L.’s suggestion.

Kahuna Tuna
Kahuna Tuna
7 years ago

Aug. 15 update: Starting play today, the Rangers have a 69-50 record and a 5½-game lead in the AL West. For the season they have scored 554 runs and allowed 555, giving them a Pythagorean W-L record of 59-60. Their actual record is about 10 games better than their Pythagorean record. Division winners with sub-.500 Pythagorean records: 2007 Diamondbacks, 90-72 (1st in NL West), 712 RS, 732 RA 2005 Padres, 82-80 (1st in NL West), 684 RS, 726 RA 1997 Giants, 90-72 (1st in NL West), 784 RS, 790 RA 1994 Rangers, 52-62 (1st in AL West), 613 RS, 697… Read more »

Richard Chester
Richard Chester
7 years ago
Reply to  Kahuna Tuna

Biggest difference between a team’s actual and Pythagorean for a team that finished the season with a .500+ W-L record is for the 1905 Tigers. They finished the season with a 79-74 record and their Pythagorean was 65-88, a difference of 14 games.

Kahuna Tuna
Kahuna Tuna
7 years ago

The +14 Pythagorean delta of the 1905 Tigers (for whom Ty Cobb debuted in late August) is the largest for any team since 1901. Only two other teams have exceeded +12: the 2004 Yankees (101-61, 89-73 Pythagorean) and the 2008 Angels (100-62, 88-74 Pythagorean).

Ken S.
Ken S.
7 years ago

Thanks Tuna for the list of teams winning the division despite being out-scored. The Rangers -1 run margin is second worst in history for teams with 69-50 records; the 1979 Astros barely edge them out at -2. No one else was below +25.

Kahuna Tuna
Kahuna Tuna
7 years ago
Reply to  Ken S.

Those ’79 Astros came very close to being the first division winner to be outscored for the year: 89-73, 1.5 games behind the Reds, one more run scored than allowed.