
That’s pitches, not pitchers! In the never-ending cat-and-mouse game between pitcher and hitter, the pitcher’s biggest advantage is choosing the type of pitch to throw to different batters in different situations. Fangraphs provides summary data from PitchFX, the system employed by MLB to track every pitch thrown in every game. Included are data on the success of each hitter against different types of pitches. Those data for the 2016 season are after the jump.
Data for pitches seen by the 146 players who qualified for the batting title last season are shown in the table below.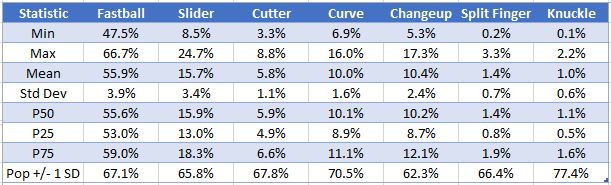
Of course, the fastball, being the staple pitch for almost every pitcher, is also the principal offering faced by every hitter. The remaining pitches are mixed in, primarily to keep the hitter guessing, but also to setup the hitter for the pitcher’s preferred pitch in a critical count or game situation.
The hitters collectively approximate a normal distribution for most of the pitches. The moments shown for the knuckleball are for the 95 hitters who actually saw one last year, a treat that more than one-third of qualified batters missed out on.
To evaluate hitters who had the best results against each type of pitch, Fangraphs uses pitching linear weights, a quantitative method for approximating the run value for events resulting from each pitch. The largest run values, which can be both positive or negative, are associated, of course, with the events that result from the final pitch of each plate appearance. Much smaller run values accrue for each preceding pitch in a PA, and these amounts tend to cancel each other out as pitch counts become more or less favorable to the batter (in the case of pitches fouled with two strikes, the run value is zero because the count does not change). Unlike metrics like RE24 or WPA, the pitching linear weight run values are in all cases context neutral. So, for example, the same result (a walk, perhaps) from a 3-2 pitch always yields the same run value in the linear weights computation, whether it’s the first batter of the game or there are two outs and the bases are loaded in a tie game in the bottom of the ninth. Fangraphs duly notes that pitching linear weights tend to have limited predictive value when applied to hitter results, with relatively low correlation from season to season.
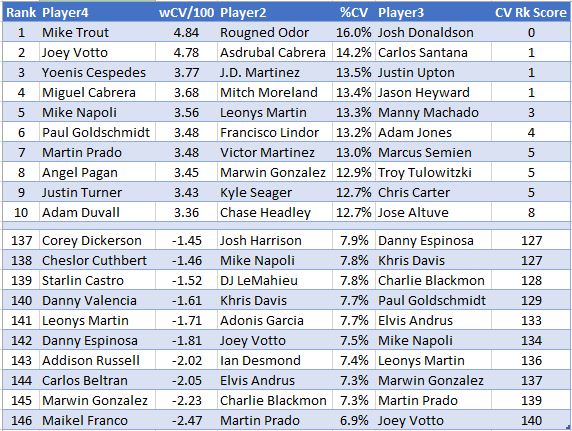
So, with those explanations and qualifications out of the way, here are the 2016 results against each pitch for our 146 qualified batters. Let’s start with the fastball, as noted the principal pitch faced by each one of these hitters.
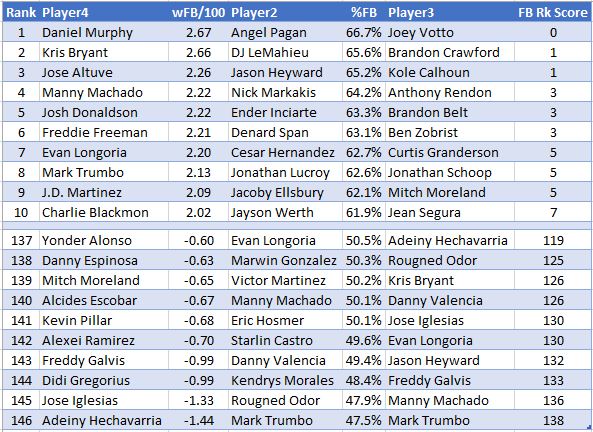
The table is showing the top 10 and bottom 10 for three metrics. First is the linear weights run value above average per 100 fastballs faced. Next is the percentage of total pitches faced that were fastballs, and last is a score or index based on the difference in rankings for the first two metrics.
The last metric is intended to convey the “vulnerability” of the hitter to this pitch. That vulnerability can work in two ways: first if the hitter struggles with that pitch (a low ranking) with the result that he sees of a lot of that type of pitch (a high ranking); or second, if a hitter hits that pitch well (a high ranking) with the result that he sees fewer of those pitches than most batters (a low ranking). Both of the preceding scenarios yield large differences in the rankings for the first two metrics and thus a large result in the ranking score, indicating a player more vulnerable to having a weakness exploited or a strength avoided by wise and crafty pitching. Examples of both types of vulnerability can be seen in the bottom 10 of the third metric that includes hitters who eat up fastballs (Bryant, Trumbo, Longoria, Machado) and those who don’t (Iglesias, Hechavarria, Galvis).
In contrast are those with low fastball vulnerability, shown in the top 10 of the last metric, indicating similar rankings (and thus, a low ranking difference) in fastball value and percentage of fastballs seen. All kinds of hitters can show this “invulnerability”: great hitters like Joey Votto, who ranked 12th in fastball value and 12th in highest proportion of fastballs seen, indicating pitchers were unable to find better options because Votto can handle most any pitch he sees; and not so great hitters like Mitch Moreland who last year, at least, had enough guile and moxie (or, maybe, just luck) to mask a weakness against the fastball by inducing pitchers not to throw them to him (he ranked 134th in % of fastballs seen, to go with his 139 ranking in run value produced against the fastball). Also in the low vulnerability group are those with middling (but similar) rankings in the first two categories and who thus lack a notable strength to avoid or weakness to exploit.
The remaining results all involve a much smaller sample size of pitches and are thus more prone to distortion and less likely to be showing “true” tendencies. So, take these results with a grain of salt. The slider results look like this.
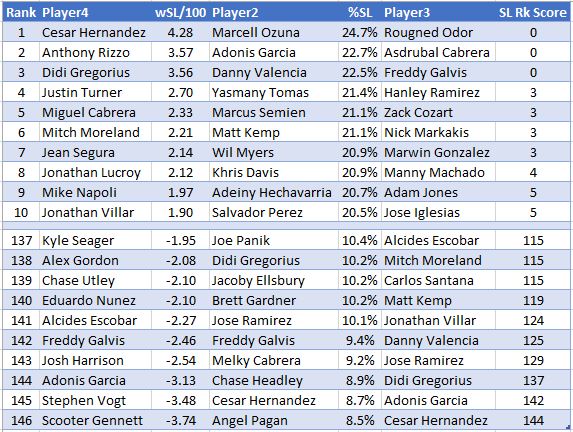
Among the most dangerous against the slider, Hernandez, Gregorius, Moreland and Villar all were “pitched around” in terms of seeing very few of these pitches. Other better hitters against the slider (Rizzo, Cabrera, Segura) were able to indulge more often because they are better hitters period, thus not affording pitchers a “safe haven” with other offerings. Freddy Galvis shows up as weak against the slider but not vulnerable to it, probably because he was just as weak against the fastball (so, why mess with the slider when you can get him out with old reliable no. 1).
On to the cutter which shows these results.
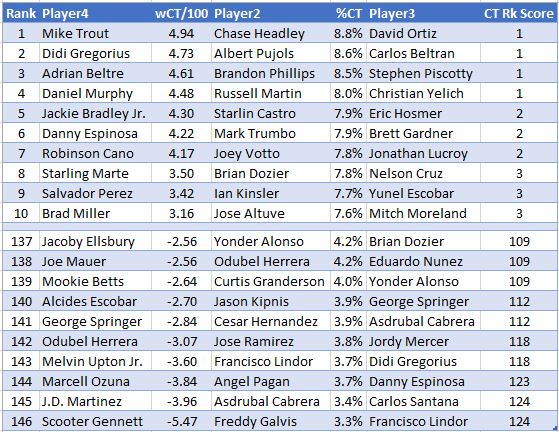
Scooter Gennett, last against the slider, is last again against the cutter. Just not a lot of cutters thrown, suggesting that it’s a difficult pitch to master (we certainly know from the career of Mariano Rivera that, if mastered, the cutter can be absolutely devastating). The difficulty in using the cutter to good effect is also reflected in that, among the top 10 and bottom 10 in results against the pitch, only three hitters (Gregorius, Espinosa, Springer) had that strength avoided or weakness exploited to the extent of being among the 10 most vulnerable to the pitch. And, those highest vulnerability scores are notably lower than the same scores for the fastball or slider.
Now on to the curve.
Some notable players here top the list for most effective against the curve, which pitchers were particularly unwilling to throw against the likes of Votto and Goldschmidt. In the case of Votto, it’s pick your poison, with the prevailing approach apparently being to go with the heater (see earlier remarks on the fastball) and cutter, rather than Uncle Charlie.
For the changeup, we have these results.
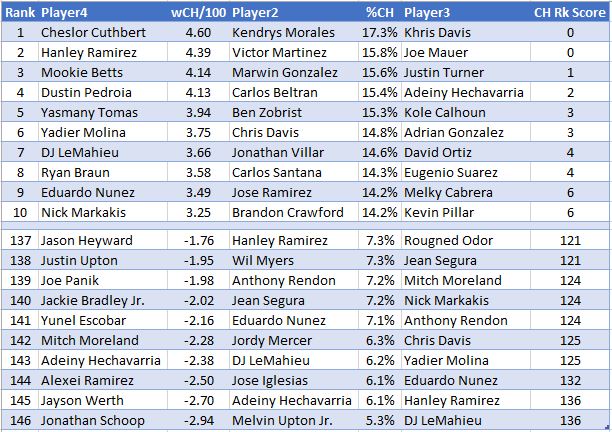 NL batting champ DJ LeMahieu enjoyed facing the second highest proportion of fastballs among our qualified batters, evidently because pitchers did not want to offer him many curves or changeups. Yadier Molina, Hanley Ramirez and Nick Markakis were other notable batters who feasted on the change and thus didn’t see a lot of them.
Finishing with the split finger pitch, we see these results.
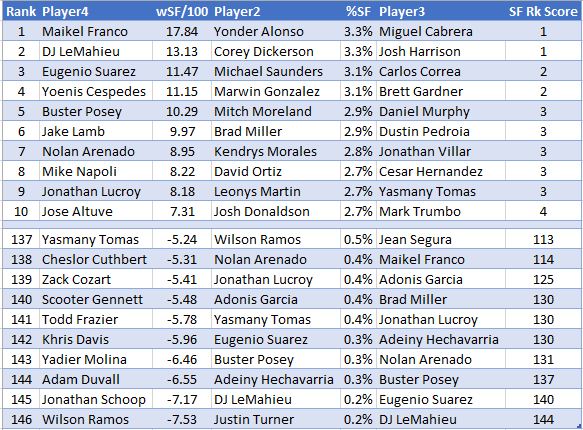
Surprising there are so few splitters being thrown anymore as, like Mariano’s cutter, the splitter can be a deadly offering in the hands of the right practitioner. That small sample size has produced the extreme run values shown above. Pitchers, though, evidently saw LeMahieu’s success against the split finger as real enough, again giving him a wide berth with this pitch.
As noted above, over one third of the qualified batters did not see a single knuckleball, so we have an abbreviated leaderboard against that pitch.
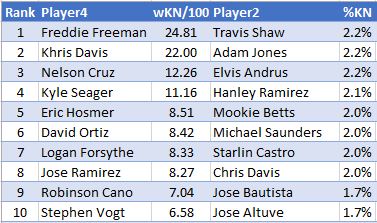
Michael Saunders had the misfortune of facing the most pitches with a trap door, the only player to top 5% for splitters and knucklers combined.
For those who would like to take a closer look at these data for all 146 qualified batters from 2016, here is the link.