
The Fall Classic starts Tuesday matching two up-and-coming young clubs with just enough veteran presence. The Astros make their second World Series appearance, but first as the AL champion while the Dodgers carry the NL honors for the 19th time in the modern era and 22nd overall. Both teams reached the century mark in wins, the Dodgers on the strength of league leading pitching results, and the Astros with firsts in nearly every offensive category. More after the jump.
While the Astros have become the first franchise to represent both leagues in the modern World Series, their opponent can claim the same distinction for the first incarnation of the Fall Classic; the Brooklyn Bridegrooms represented the AA in 1889 and the NL in 1890, in the last two of seven post-season series between the champions of those leagues.
Both league champions topping 100 wins is a lot rarer than you might think. This is the first World Series between two such teams since way back in 1970 and only the seventh overall, the others coming in 1910, 1912, 1931, 1941, 1942 and 1969.
With their 19th pennant, the Dodgers join the Giants and Cardinals as the most prolific of NL champions. But, that hasn’t been the case recently, with a 29 year gap since LA’s last World Series appearance, a franchise record drought. That’s long enough so that none of the 1988 champion Dodgers ever played with or against any of the current crop (second baseman Chase Utley was a Phillie rookie in 2003 and might have faced ’88 Dodger Jesse Orosco playing his final season that year; but Utley was sent back down to the minors a week before the Phillies visited Orosco’s Padres in May of that season).
For the Astros, it took more than 40 years to record their first championship season in 2005, so a 12 year gap before their second is pretty short in comparison. No current Astros remain from the 2005 club, though current DH Carlos Beltran was a member of the 2004 Astro team that almost claimed the NL pennant before falling in 7 games to the Cardinals in the NLCS (that was Beltran’s first post-season, logging 20+ hits and runs incl. 8 home runs, and batting .400 with 1.500 OPS in both the NLDS and NLCS).
The Dodgers and Astros have faced each other in the post-season once before, in the 1981 NLDS with the Dodgers prevailing in the maximum 5 games, winning the last three at Dodger Stadium (by a combined 12-2 score) after dropping a pair at the Astrodome. Home field advantage could also be a big factor in this series, with both teams undefeated at home in this post-season and the Dodgers fashioning a majors-leading 57-24 record at Chavez Ravine, equaling the home record of last season’s world champion Cubs. Notwithstanding a 1-4 road record through their first two post-season series, the Astros recorded a majors best (tied with the Indians) 53-28 record away from home, a .654 clip that ranks as the best by a pennant winner since the 1986 Mets, and 11th best among all pennant winning seasons since 1913.
The Dodgers will throw mostly left-handed starters against the Astros, a split in which Houston posted an .814 OPS this season, second best in the majors. Despite that ranking, the Astros were only 21-24 in 45 games this season against a left-handed starter, with that starter collecting 15 of those 24 wins. The Dodger relief corps recorded the majors’ fourth best ERA and fourth best OPS+ against. Houston, though, feasted on relief pitching with an .828 OPS, far ahead of the .783 mark by the runner-up Nationals, that 45 point gap larger than the spread between the Nats and Dodgers in 12th place.
Dodger pitchers led the NL in strikeouts while Houston batters led the majors in fewest times striking out. On the flip side, Houston pitchers ranked 2nd in the AL in strikeouts (but ahead of the Dodgers) while Dodger batters recorded the 12th highest strikeout total. Removing batting strikeouts by Dodger pitchers, LA’s batters still struck out 170 more times on the season than did the Astros. Part of the reason the Dodgers struck out as much as they did was because of extending AB’s, with their 3.95 pitches seen per PA just a tick behind the NL-leading 3.96 mark by the Brewers. That patience yielded a majors-leading 649 walks, 140 more than the free-swinging Astros who finished third from the bottom in pitches seen at 3.79 per PA.
Houston pretty much ran the table on team offensive stats, recording firsts in runs, hits, extra-base hits, batting average, on base percentage, slugging percentage and OPS (and, as noted above, fewest strikeouts). Thus, it’s not a surprise that they also led, by healthy margins, in lowest swing and miss percent (14.9% of all strikes, compared to LA’s middling 17.6%) and highest ball in play percent (30.9% of all strikes, more than a full point higher than second place and well head of the Dodgers’ 27.3%). That success is partly due to being selective about pitches they swing at, with Houston posting a 7th best 37.5% of pitches taken for balls, just a bit lower than the majors leading 38.7% mark by the Dodgers.
Both teams posted solid results in protecting late leads, with marks of 87-3 (Dodgers) and 89-4 (Astros) when leading after 7 innings. But LA was almost that good when leading at any point of the game, with a remarkable .864 or better winning percentage when holding the lead at the beginning of any inning (by comparison, Houston did not reach an .864 clip until taking the lead starting the 7th inning; see chart below).
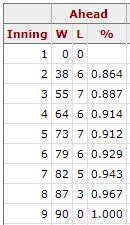
2017 Dodgers
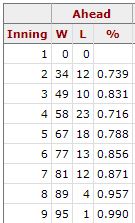
2017 Astros
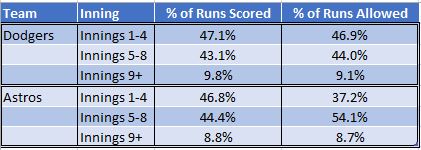
Thus, to be successful, it would seem the Astros will have to avoid falling behind early, something they were better at than the Dodgers, trailing after the first, second and third innings in only 23, 38 and 46 games respectively, compared to 40, 48 and 55 for LA. To counter, the Dodgers will need to strike in the 5th through 8th innings when Houston has been most vulnerable, allowing 54% of their total runs; LA, though, has scored just 43% of their runs in those innings. Here’s that comparison.
Enjoy the series!
No dog in this fight. But I’m still a satisfied Yankees fan–progress was made on youth and athleticism. I’m hoping this offseason they continue to focus on that, instead of spending on mid-thirties players.
Came a long way in 4 years.
The 2013 Yankee starters included:
Chris Stewart
Vernon Wells
Jayson NIx
Ichiro
Lyle Overbay
Travis Hafner
… all of whom were terrible
______________
Emotional recall can be a hard thing, Voomo
64-6 when leading after 4? Wow.
It’s actually even better, 64-6 when leading after 3 (i.e. at the beginning of the 4th).
Laz Diaz is umpiring in the World Series??? Talk about an undeserved honor.
Squeaky wheel gets the grease, I guess.
Doug, did you feel a small amount of schadenfreude when Diaz directly absorbed that pickoff throw?
This is actually Diaz’s second World Series, so some people in the upper echelons must think that he’s worthy.
I’m inclined to think it has more to do with blunting his labor grievance than anything else. Cuzzi has also made some worst umpire lists.
Taylor’s home run is second (known) on team’s first pitch seen in a World Series. Alcides Escobar greeted Matt Harvey the same way in 2015.
At two hours, 28 minutes, this was a real throwback game, shortest in the WS since 1992, and shortest WS opener since 1983. At 211 combined pitches, it was the second lowest recorded total, more than only the 202 pitches in game 2 of the 2001 WS.
Before Chris Taylor and Justin Turner accomplished the feat this evening, there had been three World Series games in which the same team’s leadoff and second-place hitters homered:
— Merv Rettenmund and Don Buford, Baltimore, 1971 Game 1.
— Terry Pendleton and Lonnie Smith, Atlanta, 1991 Game 4.
— David Wright and Curtis Granderson, N.Y. Mets, 2015 Game 3.
Each of these three teams won the game but lost the Series.
Opponent reaching base three or fewer times in a World Series game:
0: Yankees over Dodgers 2-0, 1956 Game 5. Don Larsen perfect game.
2: Cubs over Tigers 3-0, 1945 Game 3. Claude Passeau shutout.
2: Red Sox over Cardinals 5-0, 1967 Game 2. Jim Lonborg shutout.
3: Red Sox over Phillies 2-1, 1915 Game 2. Rube Foster complete game.
3: Yankees over Pirates 8-1, 1927 Game 3. Herb Pennock complete game.
3: Athletics over Cardinals 3-0, 1931 Game 4. George Earnshaw shutout.
3: Yankees over Reds 4-0, 1939 Game 2. Monte Pearson shutout.
3: Yankees over Phillies 1-0, 1950 Game 1. Vic Raschi shutout.
3: Yankees over Reds 2-0, 1961 Game 1. Whitey Ford shutout.
3: Braves over Indians 3-2, 1995 Game 1. Greg Maddux complete game.
3: Cardinals over Tigers 5-0, 2006 Game 3. Chris Carpenter 8 IP, Braden Looper 1 IP.
3: Dodgers over Astros 3-1, 2017 Game 1. Clayton Kershaw 7 IP, Brandon Morrow 1 IP, Kanley Jansen 1 IP.
Dodger pitchers recorded zero walks and 12 strikeouts, the 8th team with no walks and double-digit K’s in a WS game. Of those eight games:
– Three were in a losing cause, including two in the series clinching game, by the Royals in 2014 and Astros in 2005
– Four of the eight games were WS openers, in 1903, 1949 (the other loss), 2009 and now this year.
New WS record with 8 home runs in tonight’s game. Five of them in extra innings is also, of course, a record, three more than in the famous Rangers/Cardinals game 6 in 2011.
I believe David Schoenfield noted there had only been 17 extra-inning HR’s in WS history before tonight – and now 5 in one game. Yowch.
Verlander has now given up 16 postseason HR’s. Kershaw is at 17. That’s 4th and tied for 2nd (John Smoltz also has 17) among pitchers to never play in the postseason with the Yankees – only Tom Glavine (21) has more.
Bravo to Houston for winning away. They had 14 hits and 5 walks, scored 7. Dodgers had 6 hits and 3 walks and scored 6. A strange disparity.
It’s just the second time in World Series play that a team with more runs than hits has lost the game. The other time was in Game 3 of the 1997 Series.
I’m sorry about the outcome — but what a terrific game!
13th time (out of 323, that’s .040) that a visiting team has won a WS game that it trailed starting the 9th. Teams doing this previously are 8-4 in the series.
First time this season the Dodgers have lost a game (home or away) that they led in the 9th.
That 1941contest was the famous dropped third strike game. Yankees behind 4-3 with two outs. Heinrich whiffs, but reaches first, then the deluge: single, double, walk, double, walk, groundout. Yankees ahead 7-4 going into the bottom of the ninth, and the shell-shocked top of the Dodger lineup—Reese, Walker, Reiser—go down one-two-three.
This game makes the Bill Buckner blunder game seem mild by comparison.
There might have been two such games in the 1975 series, game 2 noted above but also game 3 when the Red Sox scored two in the ninth to tie, before losing in the 10th after the Ed Armbrister play.
Apropos of nothing statistical, but Joe Girardi was dropped today. That’s three playoff managers (Dusty and Farrell the other 2) who are looking for new work. I remember some famous firings (I’m a Yankee fan, so of course) but I don’t recall this level of carnage amongst playoff teams.
Dusty was overdue. But I don’t get Farrell and, especially, Girardi. But, if they wan’t to keep managing, I’m sure they will get the opportunity.
I always suspect there’s another story out there that may leak out over time. Ten years with any time is impressive. Ten years with the Yankees is a near-miracle. He looked tired at the end of the season.
Mike L:
Historically, ten years with the Yankees is close to the norm:
Huggins 12
McCarthy 15
Stengel 12
Houk 10 in two stints
Torre 12
Girardi 10
I doubt any other franchise except maybe the Dodgers comes close to having so many long reigns. Someone with more time could look it up.
From 1954 to 1996, Walter Alston and Tommy Lasorda managed 6691 games. Since Lasorda retired there have been eight Dodger managers for 3487 games.
And then, there’s Connie Mack, 7466 Games over 50 years (but he didn’t have to deal with a pushy front office)
Excluding mid-season replacements, the Cardinals have had only 4 managers since 1981, and only 7 since 1965.
The Twins have had three managers since September, 1986.
I’m still dizzy from the early George Years. Virdon, Martin, Howser, Martin, Howser, Lemon, Martin, Howser, Michael, Lemon, Michael, King, Martin, Berra, Martin, Pinella, Martin, Green, Dent, Merrill, and Buck…
Three managers have had 10+ year stints with two franchises. Two are TLR and Bruce Bochy. Who is the third?
It’s been reported that Game 2 was the first time in the WS that a team’s first 2 hitters hit HR in the first extra inning (the 10th). I found 4 regular season such occasions since 1930: Dodgers, 6-7-1966; Twins, 8-20-1966; Orioles, 8-4-1968; Giants, 4-15-1969.
Also 9-4-1964 by the White Sox, the only time the home team has done this.
While we wait for game 3, who can answer this question: Two players who homered in this post-season share a regular season accomplishment with Lou Gehrig and Mandy Brooks. Who are the players and what is the accomplishment?
Does a ratio of HR/3B = 2 have anything to do with it? Gehrig, Brooks, Ethier and Descalso have done it.
Something simpler than that.
Mandy Brooks holds the ML record for most RBI in his first 25 games with 34. He flamed out rather quickly.
What Brooks also did in the 1925 season was tie the modern era NL record* for rookie home runs, the same year that Lou Gehrig set the same record in the AL, This is the first year since then that players in each league (Aaron Judge and Cody Bellinger) have done the same.
* if the modern era had started two years earlier, Buck Freeman’s 25 home runs in 1899 (he also had 25 triples for a unique 25/25 season) would have been the NL rookie record in 1925, making Brooks’s total of 14 look puny by comparison; Del Bissonette matched Freeman in 1928 before Wally Berger blasted 38 two years later, a record that stood for 87 years until Bellinger added one more to that mark.
Rob Manfred: “He maintains that he did not intend to be offensive, but he understands that it was, and that’s what’s important.”
The Grand Doosh of MLB summed up in one sentence the madness that has engulfed our society.
We will still spend years in a courtroom dissecting evidence to determine whether an unfortunate death was murder or manslaughter, but in the verbal (even non-verbal!) arena, intent makes zero difference as long as Somebody claims that they were hurt.
It is all murder.
…
I am happy to be the pariah on this one, and say that someone using chinky eyes for one second as a form of sign language is of zero importance.
…
Indicating someone’s ethnicity is Not racism.
…
Using sign language when you do not speak the language of the person you are trying to communicate with is Normal.
…
Gurriel actually lived in Japan, so most likely he has respect for the culture and people.
And if he developed the opposite impression, well, at least he actually has that experience from which to form an opinion.
…
And, if we are to completely disregard Gurriel’s explanation, and label him a racist, … well why don’t we dig a little deeper, hmmmmm?:
Darvish is actually half-Iranian. So perhaps, Yuli’s gesture was to mimic the movement of a Muslim Doctor pulling back a baby’s labia and clitoral hood before performing a traditional female genital mutilation.
Aha!
Oh, is that too real? Too hardcore? Sorry, did I introduce Actual Problems With Humanity into this important discussion?
…
We are so screwed.
Voomo, I understand your reaction. Hypersensitivity on matters of race, gender, body-type, and so forth can sometimes feel as if we are living in a latter day era of puritanism, where new rules catch us off guard and subject us to public shaming, while humor, nuance, and moral complexity are being purged from culture. At the same time, this trend is a reaction against another cultural framework, one I grew up in, where racial and gender stereotyping were pervasive and socially sanctioned, and racial and religious minorities, women, and a host of other people in some way construed as non-normal, and so less-than-ideal, lived with permanent social handicaps. often quite severe. That framework has been destabilized, but it is still very much with us.
I think it is no wonder that are living through this uncomfortable battle between two very unattractive sides: PC vs. Social Revanchism, and if we’re screwed because of PC culture, we’d be equally screwed if we still lived in a culture of sanctioned bigotry. Asking that there be a livable, ethical, forgiving balance that tolerates our imperfections while making clear that we’re expected to live up to our better ideals is asking more than our society is currently able to deliver, and I’m not sure any society has ever done much better. I personally think PC culture has become unrealistic, destructive of its own ideals, and an awful echo of the holier-than-thou pose of the radicals of the ’60s, who knew they were right on some level, and assumed that meant they were enlightened beings who were right on all levels. (Of course, fifty years ago, my hair was long and I was there, marching alongside — I sure do miss the hair, and I preferred marching to the shuffling I do now.) But the old easy tolerance for bigoted humor is no alternative. I see this as a transition phase: I hope that we find our way through it to a positive solution, and fear a negative one.
I don’t know that Manfred’s “sentence” corresponds to a murder conviction, rather than a manslaughter one. It’s not particularly heavy in terms of the actual penalty, and if Gurriel’s action or statements had been more flagrant, I believe the penalty would have been greater. I would have preferred Manfred to follow Darvish’s lead, skip the penalty phase, and move towards reconciliation, but I don’t think his solution was out of line. Many fans, including me, found Gurriel’s actions repugnant (and, for me, very surprising), and in need of corrective action, especially during a time where PC’s overreach has stimulated some groups of people to become assertive in support of casual racism.
I disagree with your point that “indicating someone’s ethnicity is not racism,” not because the statement is wrong, but because “indicating” is not what Gurriel did: what he did was mocking, or, at best, caricaturing, and those are, indeed, generally “racist” ways of alluding to someone’s ethnicity, even though particular contexts of association and friendship can create a transforming nuance. (Nor would Gurriel’s experience in Japan be relevant unless it were something he had shared personally with the player he was caricaturing in a way that created such nuance.)
Female genital mutilation is common but not universal in Iran, and in many other countries. It is not specifically Muslim (for example, most Egyptian Christians practice it), and Islamic clerics are widely divided on whether it has any religious sanction at all: many Iranian clerics have issued fatwas against the practice. Male genital mutilation, a practice of Jews and Muslims (but one Paul generously excused Christians from following) was and is more widespread. Since circumcision has been discovered to have health benefits, it is now linked as closely to Western medical culture as to religious culture and we have tended to lose track of just how shocking a practice it is (especially for the newly arrived initiate), but until the past century, the impulse had many aspects in common with forms of female genital mutilation that repulse us now. Where female mutilation differs is that it is often associated with the desire to sexually disempower women, and that brings us back to the realm of gender/race bigotry that our idealistic culture has framed as such a toxic problem.
These are heavy issues for HHS, and I initially thought of simply saying as much and not responding further. But, as with the NFL anthem issue, I think we’re seeing more and more that sports is in fact a major field for exposing and working through cultural stress in America (and why should that seem surprising to anyone who recalls Jackie Robinson?), so perhaps it’s appropriate after all that we talk about it alongside Yankee managerial tenures and the career accomplishments of Mandy Brooks.
Thank you. That was a solid and acutely intelligent response.
I’m currently quarantined with the flu in a man cave deep in the mountains of Appalachia, perhaps a bit pent up.
Very helpful to hear a sane voice.
…
And I hope you’re right that we are in a transition phase that will trend towards something better.
Not feeling that optimism at all.
Voomo (and EPM) without getting into the specifics of the politics of it (which is admittedly very hard) I think that the management of professional sports is driven mostly by business considerations. Ownership (here and in the NFL on the kneeling issue) are acutely aware that we’ve moved into an era in which many people are all too willing to act on their political beliefs (or their sense of being insulted) with their feet and their wallets. They want a homogenized, family friendly product in which all are welcomed and no one is offended. Of course, that’s unrealistic, but these are people who are constantly looking at the bottom line–and very often subsidized by they taxpayer.
Politics and baseball are my two favorite distractions. I write about politics (getting thrashed at times), and come here for fun and interesting details posted by smart people who share my affection for the game.
But as to your and EPM’s back and forth about whether we are going through a transitory phase….I think I agree with you. I’m not optimistic about civility returning in the foreseeable future. I think people have forgotten how to talk to each other, or maybe more accurately have lost their willingness to listen.
Voomo:
Manfred obviously decided to play it safe, have his cake (the suspension)—and eat it, too (but not till next season). Knowing there was no way he could come out a winner with everyone, he decided to weasel out of the issue with half portions all around, keeping a careful eye on his own keister to make sure he wasn’t seen as condoning any racism, a performance, to my mind, far more offensive that the offense it was meant to address. But that is the way in most situations of this type: the punishment turns the offender into a second victim because it is made with the aim of satisfying the public rather than addressing the person and the issue with intelligence and resolve.
epm raises the subject of “the NFL anthem issue,” which I’ve been wondering about in an idle way as it pertains to Major League baseball. When we take for granted that patriotism and sports are linked and that the ritual blaring of the SSB sanctifies the contest that follows, then there’s no question that non-standard behavior (other than looking bored, of course, or checking one’s phone, texting, or standing at no attention whatsoever) is anathema in the eyes of many. The first time I saw a flag burned in protest, though, back in the late 1960s, two things came to me in a blinding revelation of the obvious: 1) that as long as we make a state religion of patriotism and a sacred object of the banner, we will have to put up with persons of a different persuasion from ours who don’t regard them as such because not to do so would be to deny them their first amendment right to freedom of religion; 2) that because the flag (and as a corollary the anthem) is so charged with symbolic significance, those protesting against the failures of the country it represents will inevitably be drawn to action involving it to underscore their disgruntlement.
If I went to sporting events, which I don’t anymore, I’d be kneeling with the players, not for injustice to blacks or minorities in particular, but against the way people of all types are being shafted in an astounding number of ways by the failure of government generally and the idiocy, incompetence, and disingenuousness of the current gang in power.
We now return you to our regular programing.
By suspending him for regular season games, there is a loss of salary that would not have been there had he been suspended for a postseason game. And any potential postseason suspension would probably have been appealed, and might not have taken effect until April anyway. Some have also asked why punish the team for the acts of one player — at one point, high school field hockey had a green card to send off a player with replacement for such an unsportsmanlike act. Recall the Roberto Alomar suspension for spitting on the ump in 1997-98.
It was only a footnote to game 4, but this is the first time in Kenley Jansen’s career allowing home runs in consecutive appearances, when facing the same opponent (Jansen allowed homers in consecutive games in 2015 against different opponents; like tonight, both were AL West foes).
Houston tonight became the first team in the post-season to hit multiple home runs and record no other hits.
Two starting middle-infielders, Altuve and Correa, have been batting in the number 3 and 4 positions in their team’s batting order during the WS. I could find only 2 other such pairs, Lou Boudreau/Joe Gordon for the Indians in the 1948 WS and Frank Isbell/George Davis for the White Sox in the 1906 WS.
Boudreau, Gordon, and Davis are all members of the Circle of Greats (not to mention the far less exclusive HoF): a 75% rate, which bodes well for Altuve and Correa (not that Altuve, in particular, needs much more boding . . .).
Richard,
I might be crazy but, you probably couldn’t find too many non-pennant winners with the keystone batting 3rd and 4th, either. When I think of great hitters in those slots like Vern Stephens or Joe Morgan, there seems to be a Ted Williams or a George Foster/Johnny Bench in the other slot. I dunno
Crazy game 5.
Brandon Morrow’s six pitches thrown is a new post-season low for a reliever when allowing four runs or more, and ties the regular season mark. Old records were 12 in the post-season and 14 in the WS.
Five Astro home runs (through the 8th) ties the WS record by the 1928 Yankees (game 4) and 1989 A’s (game 3).
Some more WS records from game 5.
– Longest 10 inning game (5 hours, 17 minutes) in the regular season or post-season
– 12 players in the game with an extra-base hit
– 4 players in the game with two extra-base hits
– 59 total bases, with both teams exceeding 25
– 7 Dodgers with an extra-base hit (3rd such game)
– 3 Astros with two extra-base hits (3rd such game)
– three 3-run home runs in a game (first time in WS, only 2nd time in post-season)
– 5 players in the game had 0.300 WPA
– both teams exceeded 0.800 WPA (ties 2011 game 6)
– 15 high-leverage (1.5+ aLI) hits (ties 2011 game 6)
– 8 WPA scores of 0.200+ from high-leverage hits (previous record was 5, in 1975 g 6, 2000 g 1 and 2011 g 6)
– both teams reached base 20+ times (6th such game)
– Astros had 5 players with a home run
– 4 Astro pitchers allowed two or more earned runs (7th such game, but first by a winning team)
– not a first, but Dodgers had a hit and a run from every batting order position
I try not to overreact in the moment – I hate the phrase ‘instant classic’ – but it’s tough not to rate that as one of the best WS games ever. Well, it’s wholly on the offensive side of the spectrum – I’d say it’s the yin to the yang of 1991 WS Game 7 – but certainly a game with about as much excitement as you can cram into just over 5 (!) hours.
Poor Kershaw – just when it looked like he got over his postseason woes with a career defining performance earlier in the series, he gets shelled again and sets the record for most HR given up in a single postseason with 8. With the current HR boom, I doubt that record will last long. Anyway, if this series goes 7 (and I hope it does!), Kershaw still has a chance to be a hero out of the bullpen.
Kershaw has surrendered a four run lead in 2 of 19 post-season starts (Dodgers lost by a run each time), but in only one of 290 regular season starts (Dodgers won that 2010 game by a run).
Easy to second guess, but Dodgers’ fate seemed to be decided by a few questionable managing/coaching calls:
– Bringing Morrow into the game after publicly announcing he wouldn’t pitch; tough for a pitcher to prepare himself to come into a game when he was expecting to have the night off
– Playing for (and getting) only one run in a 7-7 game in the 7th
– Not scoring runner from third in the 8th with two chances to do so. On Pederson’s double Taylor was approaching third (two or three steps away) with the ball still in the outfielder’s hand, but got the stop sign. On the fly ball to medium right, the third base coach said “Go”, but Taylor heard “No”; throw was 20 feet up the line.
Last night the pressure was on the Astros—going back to Dodger Stadium having to win two would be an enormous challenge—and it looked like an el-foldo at first, but they showed their mettle by coming back and their toughness by coming through.
In game six similar pressure is going to be on the Dodgers to win at home and stay alive as Houston did with the home field advantage. We’ll see.
I didn’t think Game 2 could be topped for drama, and now it has been, but as a Brooklyn fan, what that means is that I spent the day taking long walks through the woods, listening to music, poring over news sites I’d normally avoid out of consideration for my blood pressure, and staying far, far away from MLB.com and HHS.
I’ve long subscribed to the theory — I think it’s someone else’s — that the great fan joy of a famous win, sun-filled as it seems at the time, cannot balance the black cloud of a devastating loss, even when you feel appreciation for the valor of the team that defeated yours (as was the case last night, much easier than it would have been had they been wearing pinstripes). At points during the day I’ve called to mind halcyon autumns of the past, such as 1955, 1963, or, with an adopted passion, 1969, but immediately these have been blotted by dark images of Newk getting shelled in ’56, Stan Williams walking the pennant away in ’62, and the doubly vicarious nightmares of Mickey Owen and Ralph Branca that I was raised to dream over and over again, as if I’d actually been at those ballparks those days (when, my mind showed me, they existed only in black-and-white).
The Buddhists tell us that this is the root of enlightenment: grasping the truth that beneath the thin illusion of joy, life is anchored in the unrelenting experience of suffering. But, frankly, I don’t think the Buddha knew first base from third, and he’s about as relevant now as the Browns.
And when at last I log on to HHS, I see a comment by Cursed Clevelander and I think, What have I been moping about? My very first Series I was all in for the Indians – a record-breaking team and, my older brother assured me, a cinch to cream the Giants, hated by red-blooded Brooklyn fans more even than the Yankees. My earliest concrete baseball memory is the two of us wailing in outrage and disbelief as the Giants danced off the field on our fuzzy Magnavox television screen — and here’s Cursed Clevelander, still waiting to find out what the other outcome feels like!
So hats off to Houston and let’s knock Verlander out of the box in the first!
As elegant a distillation of being a fan as I have ever read.
Perhaps if when Prince Guatama snuck out of the palace he had gone to a baseball game instead of wandering through the alleyways of human misery, he would not have chosen to create a religion dedicated to not-living life with passion and desire. A lot of historical a-holes would have likely chosen a more constructive course if they just had a ball team to root for.
But Voomo, given his utter naivete with regard to ordinary life, he’d surely have become a Lumbini Browns fan, and have wound up heading off to the forest after a season or two of nothing but suffering anyway.
And Mike, thanks for the kind words!
I love how the threads here have recently blossomed and stretched out into other fields beyond sports. Just this month, we have witnessed cogent discussions on classical music, social justice and Eastern philosophies, all of which are passions of mine.
This illustrates vividly what an interesting collection of people this site has attracted, and the importance of keeping this community together. I can’t imagine finding such a good-natured and open-minded group in the comment sections at Fangraphs (although John Autin posted there yesterday), MLB.com or (shudder) ESPN.
Hah, certainly never thought I’d be held up as a paragon of being magnanimous in defeat! Thank you for the kind words, epm. Of course, I’m still only human – had this series been Yankees-Cubs, I feel like I’d be wandering around in sackcloth and ashes, too bitter and shell-shocked to even think about baseball. But seeing two fantastic young ballclubs give us a couple classic games already makes it easier to stomach the fact that the Indians will spend at least one more year wandering the desert before finding that championship promised land.
(I too spent those days after the ALDS wandering through the sun-drenched halls of memory, though many of mine are imagined or possibly from a past life – the alternate universe where the Indians become the dynasty of the 90’s instead of the Yankees, the world where Kenny Lofton isn’t held up at 3rd and the pennant-winning Indians crush the not-ready-for-primetime Rockies in 2007, a world where Rajai Davis joins Steve Bartman in Cubs infamy and makes it 109 seasons and counting, and imagining what it must have been like in 1920 and 1948 when Cleveland was truly rocking)
The only thing that will continue to irk me is that this Indians team was truly special, and going forward I fear that much like the 2001 Mariners they’ll be much more remembered for what they didn’t do than what they did do. And that’s a shame – a 22 game winning streak is, without exaggeration, a once-in-a-lifetime happening. But it’s an accomplish that certainly looks a bit hollow when it’s followed up by a stinker in the playoffs.
CC, I understand your concern about the 2017 Indians losing their rightful place in memory, like the 2001 Mariners. This relates again to the issue of the unearned winners in contemporary post-seasons. No one fails to learn about the 1906 116-36 Cubs if they study Baseball History 101, even though the team ended its season with an ignominious defeat at the hands of the Hitless Wonders from the South Side. That’s because the teams we recall for excellence are generally the pennant winners, not just the Series winners. Teams like the 1912 Giants, the ’44 Browns, the ’54 Indians, the ’67 Red Sox, and so forth, have prominent places in historical memory because they were exceptional teams that were in the Series, which fixed them in a type of pantheon. That’s the case with very few also-rans — perhaps the old playoff losers (the ’51 Bums!) — but generally speaking, as the saying goes, no one remembers who came in Second. Who remembers the fine ’73 Reds team that the incredibly mediocre Mets knocked off on their way to a close loss to Charlie O’s A’s? The 2001 Mariners are destined to be a footnote, rather than a highlight in an honor roll, like the 116-game-winning ’06 Cubbies. Losing the Series is not coming in Second.
But the Indians’ streak is going to survive, just as the 1916 Giants remained in memory because of their 26-game streak, which, given the interruption of a tie game in that run, the Indians surpassed. It may be true that the memory has an asterisk because of the playoff loss (a much smaller one than the Giants’, though — I remember first learning of that streak through a caption that read something like: The 1916 Giants Won a Record 26 Games In a Row and Finished Fourth!), but the winning streak stands on its own. If DiMaggio’s team had lost the ’41 pennant, his streak would be as much a milestone as it is now. Future teams on streaks will always be compared to the Indians, at least until the record falls, if it ever does.
And I agree about the Buddha – Siddartha may have said life was naught but suffering, but he also never got to see a 6-4-3 double play.
As we await game 6 and a possible first world championship for Carlos Beltran, I was struck by how similar Beltran’s career totals are to those of HOFer Andre Dawson, with the differences that do exist (Runs, 2B, SB%, BB) all favoring Beltran.
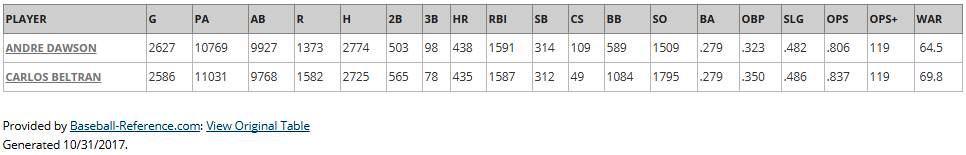
Incidentally, only Barry Bonds, Alex Rodriguez and Willie Mays have also recorded 300 steals, 400 HR and 500 doubles.
Eerily (Halloween-speak) similar. Between the higher OBP and SB%, I get Beltran ‘neutralized’ to about 5.94 RC/27 outs versus Dawson’s 5.49. Beltran’s post-season performance was off the charts spectacular at one point. First ballot HoF?
I think first ballot is pretty unlikely. But 70 WAR seems like quite a reliable predictor for eventual election, with only Grich, Trammell and Whitaker not making it among those without “baggage” who have fallen off the ballot (those with baggage are Rose and Palmeiro, while Bonds and Walker are still on the ballot).
Beltran’s post-season performance could presumably be the factor that could push him over the top, though there is some irony in crediting that to a player who hasn’t yet played (and may still not) on a WS champion.
Both won the ROY award. Dawson did much better with awards generally and black/gray ink, but he picked the wrong teams to be on for the post season, and he shouldn’t even have played in the 1989 NLCS with his bad knee? I think it was. The eras the two played in were quite different, so I’m not sure the statistical similarities mean that they were quite so similar, even though you and Baseball Reference have them closely matched.
Certainly the 300/400/500 counting stats are more impressive in Dawson’s era than in Beltran’s. But, OPS+ and WAR supposedly make adjustments for the run scoring environment, showing the similarities seen here.
Seems like Beltran compensates for playing in a higher run scoring environment with a higher OBP and better baserunning, with the latter, especially, more exceptional in Beltran’s era than in Dawson’s. Also, while Dawson’s gross SO numbers are slightly better than Beltran’s, for their eras, Beltran’s look better, at 89% of MLB average strikeout rate vs. 98% for Dawson.
Back when Josh Hamilton had his 4-homerun game, Beltran had a great week in the National League. From May 2nd to 11th, 2012, Beltran had 3 multi-homer games including a two-homer game where he finished a single short of a cycle, and 2 HR / 6 RBI the night of Hamilton’s 4 homers.
For those who may be interested, there is a new, (vaguely) Hallowe’en-themed quiz under the Quiz pages
As a child of the (baseball) 1970s, I like to think of this World Series as a tiebreaker for 1980 and 1981.
Many people forget the first round. In 1980 the Astros, leading the Dodgers by three games, came to Los Angeles for a season-ending three-game series. We Angelenos knew our team had only a very slim chance. All three games were low-scoring, tight affairs, played before huge, passionate crowds. Friday, the Dodgers won 3-2, tying the game in the ninth when Ron Cey singled home pinch runner Rudy Law, then winning it on an emotional Joe Ferguson walk-off homer in the tenth. The final two (scoreless) relief innings were pitched by a poised 19-year-old (?) rookie named Fernando Valenzuela, a few months from becoming known to the world as “Fernando.” Saturday, the Dodgers beat Nolan Ryan 2-1 behind a complete game by Jerry Reuss, who got the final out with Astros on first and third. (Exhale, everyone.) Sunday, the Dodgers completed the improbable sweep, 4-3, overcoming an early 3-0 deficit and finally taking the lead on a tie-breaking two-run homer by Ron Cey in the eighth; Friday starter Don Sutton came in with two outs in the ninth, runners on first and third, and retired Denny Walling on a grounder. Delirium! For many of us, Monday’s one-game playoff in L.A. was almost anticlimactic, and good thing, too, because the Astros shelled Dave Goltz and Rick Sutcliffe early to win 7-1 and earn the franchise’s first playoff berth. A beautiful Round One went to the Astros.
The second round was, as Doug noted, when the Dodgers and Astros faced each other in the 1981 NL West Divisional Series (an odd artifact of that season’s players’ strike). The Astros won the first two at the Astrodome and the Dodgers then took the last three at Dodger Stadium by scores of 6-1, 2-1, and 4-0. Exultation, though it was hard to know exactly how to feel about winning (as it seemed then) a playoff to get into the playoffs. It would turn out to be the first of three playoff series that the eventual world champion Dodgers came from behind to win.
In 2017, these two former division rivals once again have stretched their elimination series to its limit. Tonight I hope we see them bring out the very best in each other one last time—for bragging rights, and for the love of the best game in the world.
Those ’81 Dodgers were the last team (of twelve) to win two WS games finished by a reliever going 3+ IP. Now, the Astros are the 13th such team, all of them winning the series.
The Dodgers are 1-5 in World Series-deciding games on their own diamond. The only time they won was against the Yankees in Game 4 of the 1963 Series.
And now 1-6. That 1963 game was played in one hour, 50 minutes, shorter than all WS deciding games since, save one: the Orioles dispatched LA in another sweep three years later, with the final game completed in only 1:45.
Congrats to the Astros, who just found a way to win, taking two games the Dodgers should have won, and successfully employing unorthodox management of their pitching staff to overcome a shaky bullpen.
Yu Darvish will wear the goat horns for the Dodgers. He was perhaps an odd choice to start game 7 over Wood (or even Kershaw), given how much better Houston does against right-handers and also given his regular season record against the Astros; since 2014, Darvish started eight times against Houston, averaged less than 6 IP per start, and posted a 1-4 record with 4.11 ERA.
Pitchers who have driven in a run in the deciding Game 7 of a World Series:
Lance McCullers, Jr., Astros, 2017 (ground out to second)
Jesse Orosco, Mets, 1986 (single to center)
Bob Gibson, Cardinals, 1967 (home run)
Murry Dickson, Cardinals, 1946 (double to left)
Dizzy Dean, Cardinals, 1934 (infield single)
All these pitchers’ teams won. No pitcher has ever driven in more than one run in a deciding WS Game 7.
McCullers has the second shortest shutout start in a game 7. The shortest belongs to Curly Ogden of the 1924 Senators who retired the first batter of the game, but got the hook after walking the second. Like McCullers, Ogden’s game came in a winning effort that included, again like this year, a starter (Walter Johnson) closing out the game with 4 relief innings.
Ogden had an unusual career in that he pitched over 1200 innings in the minors, but ALL of them came after his major league career ended. In contrast, Ogden’s brother Jack pitched over 2500 minor league innings before his age 30 rookie season for the Browns.
Ogden is one of 10 players whose surname matches the name of the town of his birth.
Richard, How in the world did you have that insanely obscure factoid ready to deploy instantly with such splendid effect?
It is listed in a book titled “The Baseball Maniac’s Almanac”. It has a lot of weird stats that are fun to browse through.
And I should have mentioned that Curly’s brother Jack is also 1 of those 10 players.
John Ogden and $ 70,000 talked Richie and Era Allen into signing with the Phillies in 1960. I believe Allen’s hometown Pirates had already committed even more $$$$ to Bob Bailey
I have lived in Delaware County PA for the last 60 years. Ogden PA has a fire company, I don’t believe they have a post office. It’s kind of just an intersection and certainly not a municipality of its own. It is located in Upper Chichester Township which also gave us Chichester HS, Widener College, and Houston Oilers standout Billy “White Shoes” Johnson – the inventor of the endzone celebratory dance known as “The Funky Chicken” (ca. 1978)
Be that as it may, Richard, the surprise isn’t that the factoid is in some book, it’s that it popped into your head at just the right time. In my life it pops into my head the next time I re-read the book.
And I just discovered that Curly Ogden holds the record for fewest batters faced by a starting pitcher in a WS game. In game 7 of the 1924 WS between the Senators and the Giants he faced just 2 batters.
Here’s the scoop on Ogden’s WS start from his SABR bio.
Warren Harvey “Curly” Ogden became part of World Series lore in 1924 when Washington manager Bucky Harris started him in Game Seven as a ploy to fool Giants manager John McGraw. The idea was to get McGraw to play rookie first baseman Bill Terry and other left-hand batters against the right-handed Ogden, so that Harris then could bring in lefty George Mogridge.
Terry, 6-for-12 at that point in the series, had not been playing against left-handers. The ruse worked. McGraw put Terry in the lineup, and Harris watched Ogden strike out Freddie Lindstrom and walk Frankie Frisch before bringing in his left-hander, who had warmed up secretly below the grandstands. The Nationals, behind the relief pitching of Walter Johnson, won in 12 innings to capture the team’s lone world championship.
In fact, Ogden played a significant role in getting the Senators, as the team was commonly if unofficially known, to the World Series. Picked up on waivers from the Athletics in May, the often sore-armed right hander went 9-5 for Washington as a spot starter. His contribution was crucial to Washington’s finishing two games ahead of the Yankees. The 1924 season was the highlight of Ogden’s five-year major-league career.
The town of Ogden was named after one of his ancestors.
Has a World-Series MVP batter ever had a 4-strikeout game before Springer’s game 1 ? It doesn’t look like it. Mantle had a golden sombrero in ’53 before they had an MVP.
Three 4 strikeout games (Springer’s and two by Bellinger) is also a WS record.
That Mantle game came in the 14 strikeout game by Carl Erskine, then the WS record. Mantle had company as teammate Joe Collins also had four whiffs, the only time two players have done so in the same WS game. Despite Erskine’s domination, the Dodgers needed an 8th inning HR from Roy Campanella for a 3-2 win.
Despite some clutch hitting in other games, including a grand slam, Mickey was not close to being the 1953 MVP. Who was? By universal consensus, Billy Martin. Who?
Has to be Martin, 12 for 24, incl. 5 extra-base hits, 8 RBI, 5 runs. He and Paul Molitor (1993) are the only players with multiple triples and multiple HR in a WS.
Also, his single in the bottom of the ninth drove in the winning run of the sixth and final game.
My only disappointment was that Verlander didn’t come in in the 9th to close it out but other than that it was as exciting and satisfying a World Series as any I can think of in the past 40 years.
Hartvig! How great to hear from you!!
Verlander didn’t wind up with results that reflected the quality of his contributions, but he was indeed a great asset to the Astros. It was nice, I thought, that Kershaw did get to add some quality innings after his disastrous start in Game 5.
Even a Dodger fan has to recognize the poetic justice of the Astro win. These are two excellent young teams, and it wouldn’t be a shock to see a rematch next year.
Indeed; it felt that no matter the outcome, there weren’t going to be any true losers…certainly not for the viewers. The expectations had raised the bar so much that I kept waiting for madness to break out again in last night’s game, but it wasn’t to be.
Hartvig, I would say that last year’s Series was also very satisfying, along with those in ’91, ’92 and 2001. Just an opinion, of course.
You won’t get any argument out of me on any of your choices- much as I hated the Homerdome in Minnesota that game 7 was easily in the top 5 most exciting sporting events I’ve seen. And after living in eastern Iowa for nearly 30 years where Cubs fans abound I was happy just to see all of them so happy. Funny thing is that if someone were to ask me maybe 5 years ago which ML team you have the LEAST connection with, Houston probably would have been #2 on the list. I’m an AL guy. I’m a fan of ML history. I grew up & again now live about as far north as you can get in this country. All kinds of reasons. But they switched to the AL, started to develop some exciting young talent and then went out an gave Verlander a shot at a ring so I felt like I had a dog in the fight.
And thanks, epm. I’ve been lurking for the past year or so and checked in every now & then to see what people were talking about but politics have taken up much of my on-line time. Then my primary outlet for nearly a decade (Newsvine) decided to close up shop October 1st, the playoffs started and I decided it was time to talk baseball again.
I’m hoping that the BBWAA will decided to elect 3 or 4 guys again this year and we can get back to arguing about the COG this winter.
Brandon Morrow joined Darold Knowles as the only pitchers to appear in 7 World Series games.
Knowles had the better showing, with one un-earned run allowed in 6.1, plus two saves, including being on mound for the final out.
Springer blew away the record for Total Bases in a WS:
29 … George Springer
25 … Willie Stargell
25 … Reggie Jackson
24 … Lou Brock
24 … Duke Snider
24 … Paul Molitor
___________________
He tied Reggie and Chase Utley for HRs, with 5 (Utley’s in a losing effort).
___________________
Cody Bellinger now dominates the strikeout leaders:
17 … Cody B
13 … Javier Baez
13 … Ryan Howard
12 … Willie Wilson
He also beat out Aaron Judge for the Playoff record:
29 … Cody
27 … Judge
26 … Soriano
22 … Pat Burrell
In each of the last two years’ World Series both teams have scored exactly the same number of runs (27, Cubs and Indians; 34, Astros and Dodgers). The only other time this has happened in a Series was 1948 (17, Indians and Braves).
While there’s still time, maybe we could have an HHS impromptu vote on the 2017 National League MVP, for which award there are, in my estimation, no standout or walkaway candidates. To get the ball rolling—if I can generate any takers on the proposition—here is a ballot:
1) Arenado
2) Blackmon
3) Goldschmidt
4) Rizzo
5) Bellinger
6) Votto
7) Turner
8) Bryant
9) Stanton
10) Tie: Rendon, Harper, Zimmerman, Murphy
I Don’t list pitchers for the MVP. As for my possibly eccentric positioning of Rizzo and others, call it whimsical.
Great idea. BTW, is Altuve that much of a runaway over Judge or Jose Ramirez…or Lindor, that we shouldn’t consideran AL vote?
1) Blackmon
2) Stanton
3) Bellinger
4) Goldschmidt
5) Votto
6) Bryant
7) Arenado
8) Harper
9) Seager
10 Travis Shaw
FWIW, per B-Ref, Blackmon did create 30 more runs than Arenado
No problem there, except it’s a two-man race. The NL seems more open. The Cy Young in the NL is kind of interesting too.
1. Marcell Ozuna
2. Joey Votto
3. Nolan Arenado
4. Paul Goldschmidt
5. Giancarlo Stanton
6. Kris Bryant
7. Anthony Rendon
8. JD Martinez
9. Max Scherzer
10. Clayton Kershaw
Marcell Ozuna vs Giancarlo Stanton with RISP:
.356 / .444 / .619 / 1.063
.253 / .372 / .520 / .892
I give Arenado the vote over Blackmon because of defense, and because Nolan’s Home/Road splits are fairly normal:
.336 / .392 / .644 / 1.036
.283 / .355 / .531 / .886
…whereas Blackmon did this:
.391 / .466 / .773 / 1.239
.276 / .337 / .447 / .784
And going back to the Larry Walker debate, I’m still torn as to how to evaluate Denver performance. Because on the one hand, hitting is hitting, and learning to take advantage of your home park is good hitting. So I dunno.
I didn’t watch enough NL this year to have a well-informed list but I may look things over and weigh in anyways.
But what’s the story behind Eric Thames? Spent what should have been his prime struggling to reach replacement level- I have a vague recollection of him in Toronto and getting traded to Seattle- then he disappears entirely only to re-emerge as one of the preeminent power hitters in the NL 5 years later.
How on earth is this the first I am finding out about this?
Don’t think you need to worry much about him, Hartvig. His WAR was 12th on the Brewers, and his stats with men on base are abysmal. 31 HRs, 63 RBIs batting mostly second in the lineup. Three years feasting on Korean pitching may have honed his skills a little.
I did a few calculations to see how punchless Thames’s 31 HRs were from another perspective. Using the B-R Home-Run Log statistics, I compared him with Arenado and Blackmon (37 HRs each), Bellinger (39) and Stanton (59) on two measures:
(A) Percent of HRs that either eliminated a team run deficit or put the team ahead (or both);
(B) Percent of HRs hit when the teams were separated by 5 or more runs.
(I suppose the results of B might differ significantly with a different threshold to indicate a “blowout”; I chose five runs because that’s the lowest gap at which the tying run can’t come to the plate).
The first would be high-leverage HRs (although, unlike WPA, I did not take into account anything but the score when the HR was hit), the second, low-leverage HRs. Here is how these five players rank (to the half-pct.):
……High-lev HRs / Low-lev HRs
Thames: 58% / 9.5%
Stanton: 56% / 8.5%
Arenado: 48.5% / 19%
Bellinger: 36% / 13%
Blackmon: 38% / 24%
Now you could get really tiresome and also calculate the average WPA per HR for all these guys, so I did that too.
……….WPA/HR
Thames .139
Stanton .127
Arenado .124
Bellinger .122
Blackmon .103
So it seems to me that although Thames drove in very few runners-on-base with his HRs (only 12!), and he did hit fewer home runs than the leaders, he also made up for this somewhat in tending to hit home runs when they had a significant impact on his team’s game status.
Of course all this assumes I did the calculations correctly . . .
epm:
I don’t doubt your calculations, but they fail to account for these stats to modify their impact:
BA with RISP .180; with 2 out RISP .118; late and close .228.
15 HRs in innings 1-3; 9 in innings 4-6; 6 in innings 7-9.
.304 BA in innings 1-3; .236 in 4-6; .182 in 7-9.
20 HRs with the bases empty (65 %)
So I’m guessing that the high leverage result you’re getting has a lot to do with him homering early in the game when there hadn’t been much scoring done (6 in the first inning, 7 in the third) and the game wasn’t exactly—or necessarily—on the line.
Stanton, who also batted second most of the time, was not that great in clutch situations either, or late in the game. Bellinger hit 18 of his 39 dingers in the 6th inning or later. Blackmon batting leadoff hit 24 of 37 with the base empty, but his spread was 12 in innings 1-3; 14 in 4-6; 10 in 6-9. Arenado drove in 93 runs minus his HRs, Stanton 73, Thames 32.
I prefer my take—that what you have is a statistical anomaly, not a representation of Thames’ actual value.
Well, nsb, I started from the premise that Thames had performed terribly as a “clutch” hitter: it’s the general narrative on his year, and I actually was curious to see whether his HR record would show it to be even worse: lots of solo HRs in blowouts. It turned out to be just the opposite. It doesn’t alter any of the stats you cite (I hadn’t checked his inning-by-inning BA), but it seems to me to be an interesting new perspective that says something positive about Thames that was not obvious. It’s not a “your take or mine” situation: I think that both takes are valid, and that it would be an error to say that because they do not seem to show the same picture one must be adopted and the other discarded.
The inning in which a HR is hit is less important than the game context (and there are posters on HHS who will argue that the notion of late-inning runs being of added value or showing “clutch” ability is an illusion — I agree with the first but not the second). For example, let’s compare Thames and Blackmon, who are at the extremes of the stats I listed: None of Thames’s 7 (you left out his 10th inning walk-off) HRs in innings 7+ were in “blowout” situations (that is, where the teams were separated by 5 or more runs); Blackmon hit more HRs in innings 7+ — 11 of them — but 4 were in those sorts of circumstances, where the HRs weren’t really worth much, despite being hit in the late innings. In fact, a HR in a blowout context is actually less valuable in the late innings, when the odds of a comeback reversing the lead are lower. Bellinger’s 18 in innings 7+ include 4 blowouts (his only grand slam came with a 6-1 lead in the 9th); if you exclude those, he and Thames are within .004% in terms of proportion of meaningful late-inning HRs.
Thames had only 11 HRs with runners on, but 7 of them gave his team the lead. Blackmon had 12, but only 4 gave his team the lead. Of Thames’s 12 runners driven in with HRs, only 2 were in scoring position; Blackmon drove in 14 runners with HRs, of which 9 were in scoring position. So Blackmon obviously picked up a lot of RISP that way — but so what? In the case of HRs, it’s more valuable to drive in the RNISP. (A two-run homer with a runner on third nets five bases; with a runner on first it nets seven.)
The basic facts are as they are: Thames hit for a low average, he was lousy with men on base, and when you look away from his 31 HRs, there’s not a lot to cheer (although he did draw a lot of walks per PA, and a 125 OPS+ really isn’t bad). Your general picture is right. But I think it’s wrong to suggest that because he drove in few runs, his rather high number of HRs was an “empty” 31. It turns out to be just the opposite: he may have missed opportunities with runners on base, but when he seized opportunities and did hit a HR, solo or not, his shots made a difference in an unusually high proportion of cases.
epm:
This is the kind of discussion, I regret to say, that used to appear here regularly but has almost ceased to occur. I am notoriously against the easy analysis—Highest WAR means Most Valuable, etc.—and prefer to dig deeper into the context of what has happened when. Your last paragraph is penetrating. I would insist, though, that the leverage aspect of hitting a solo home run in the third inning in a previously scoreless or tied game is not the same as doing so in the eighth or ninth. Famously, after Tommy Henrich’s walk-off HR in the ninth of the first game of the 1949 Series, reporters noted that it was the first time a Series game had ended 1-0 via a home run since Casey Stengel had slugged one in the seventh inning of game three of the 1923 Series. Stengel, Henrich’s manager in ’49, when asked if Henrich’s blast wasn’t more dramatic coming in the last inning, admitted as much, saying something like, “Yeah, it’s true, but I got nervous and couldn’t wait.” The point, though, is that the earlier in a game such an event occurs the less likely it is to be the deciding factor. Context is important, as you yourself argue about Blackmon’s late innings HRs. But if those HRs had been game tiers or put the Rockies in the lead, wouldn’t they have had value above early innings dingers in similar context?
Good post, nsb. It’s a challenging issue. I’m not sure I can do it justice, but here’s a try.
There’s a basic tension between games viewed as narratives and viewed as event sequences. My feeling is that there is no right or wrong choice between them: there is truth in both perspectives. (This holds for the way we look at seasons too: I think Voomo is the HHS poster who holds that pennant races are simply 162-games long, and the late-season “race” is just an illusion.)
Let’s take the Henrich game as a model (much as I would have preferred a different outcome had I been more cognizant at the time): a 1-0 game decided on a last-pitch walk-off HR. Contrast it with its mirror opposite: a 1-0 game where the difference was a first-pitch HR in the top of the first — let’s call the batter “Casey” for convenience.
In the case of a Henrich game, throughout the tie game everyone is aware that no team has more than a transient advantage: each batter confronts an opportunity to have the determinative impact on the game outcome, the odds that a HR will have that effect rising with each out, and climaxing with home-team batters having sudden-death-dealing power, as Henrich did. Henrich’s role is every kid’s dream. But all 50+ batters preceding Henrich have been aware of the increasingly urgent need to seize the advantage: each has been trying and each has failed, while each pitcher and fielder have been trying to foil the batters and have succeeded.
But what about Casey? After his HR, every home team batter faces an increasingly urgent need to counteract the effect of his first-pitch clout. While the impact of his blow may have initially seemed minimal, with each out it grows gradually larger, having placed the home team batters under slowly growing pressure, and providing increasingly significant breathing space to the visiting team defense and batters. The odds may have been low that the HR would be determinative, but the story of the game is the way those odds have grown, out by out. In the Henrich case, for 8+ innings the game situation is an impersonal outcome, the identity of the key player being in doubt until revealed at the close. In Casey’s case, the positive edge Casey’s team has and the negative pressure their opponents feel for 8+ innings is entirely due to Casey – but the drama is deflationary: no one, including Casey, ever felt the thrill of his game winning hit, and so gradually did it become likely that Casey would be the hero that at the end of the game his teammates may forget even to congratulate him. Nevertheless, the impact is identical to the case of Henrich, who is being carried of the field on his teammates’ shoulders, foreshadowing the ticker-tape parade to come.
In Casey’s game, the full-game dynamic is a product of what Casey did. It could be reversed at any moment, but until it is, it’s Casey’s game. In Henrich’s case, you could say that one component of the game context in every inning was that Henrich (like his teammates) did not hit an early-inning HR, like Casey, to put the Yankees at an advantage.
Another way to examine this would be to analyze the issue of “clutch” performance. Obviously, Henrich was a clutch performer and Casey wasn’t. In the Casey game, the clutch performers would be the visiting team ninth-inning pitchers; the closer or CG starter would be the hero: Casey, not so much. But maybe we should look again at Henrich’s case: after all, Newk developed such a reputation for choking in the big games, perhaps we shouldn’t make such a big deal about Henrich: maybe the story was that Newk grooved it (I’m sure that was indeed a story line, but no one likes a downer story as much as a heroic tale). (In my first-ever game at Ebbetts Field, I watched Newk let a 7-2 lead slip to 7-6 before he was relieved, in a game with the pennant on the line – I do think he reacted poorly to maximum pressure situations: interesting, considering what a strong character he developed into later in life.)
I think every game, no matter how complex, can be compared to a mirror-image version where late contributions are shifted earlier and vice versa, and the contrast will resemble the Henrich/Casey one, though the complexity may be far greater (think Maz). The way we tell narratives, the late inning performance – the “clutch” role – will always stand out as more meaningful, and in many ways I think the psychology of clutch situations is of unique human interest and really does warrant the attention we give it, regardless of statistical analyses that may suggest the effect is illusory. But when the sum total of game impacts is taken, I think the early-inning contributions turn out to have equal weight, both in the simple terms of being worth as much as runs, and in micro-calculations about the way impact is distributed over time. And I think the neat thing is that we don’t have to give up either perspective: looking through both gives us a 3D view of games and players.
But, to finish on a simpler level, in the Thames case we can get at this more easily. While some of Thames’s early-inning HRs were as you describe them, that is balanced by the fact that a greater percentage of his later-inning HRs were high-impact in terms of win probabilities. The result is that the total WPA of his HRs was higher than comparable hitters’, even allowing that early-inning HRs will generate lower WPA.
nsb, I want to pursue this a little further in light of Richard’s stats below. (I apologize for the data-dump tone of this addition, but the sad fact is that I just have a lot of data to dump.)
The “double vision” portrait of Thames is reinforced by looking at how he fares under the two interpretations of RDI%, one not counting the batter as an RDI, the other counting him. Under the theory of RDI that does not count the batter as a runner, Thames ties for a really mediocre rank of 224/300. Under the alternative theory, he ties for a solid 114/300. A huge difference — he goes from the 8th decile to the 4th! I think Thames is both these players: awful about stranding base runners when game impacts are relatively strong, good when it comes to producing high-impact unassisted runs.
Given that Thames also has a high WPA/HR number, but a pretty mediocre season WPA number (1.9), this seems very much like the same guy. He’s unusually productive in driving himself in from home to home and doing that at usefully high-leverage times overall, but his contribution is sharply reduced by how often he fails to deliver simple base hits when they would yield runs scored.
But here again, I think Thames may be an anomaly, although I can’t undertake the kind of comparative data search that would establish a norm he may deviate from. Thames drove in only 20 runs with batting events other than HRs — in one case producing 2 RBIs in one PA, so he “came through” in only 19 non-HR PAs (8 in innings 1-3; 6 in innings 4-6; 5 in innings 7-9, if you’re tracking traditional “clutch” categories). How significant were those RBI?
Let’s sort these 19 RBI PAs into categories: how many gave his team the lead; how many erased a deficit, etc. . . .
A) Broke a tie and gave the Brewers the lead: 7
B) Erased a deficit and created a tie: 5 (incl. one two-run hit)
C) Padded a modest lead: 4 (added a run to two 2r leads and two 3r leads)
D) Reduced a modest deficit: 1 (cut a 2r deficit in half)
E) Meaningless RBIs in “blowout” (5r gap or more) contexts: 2
This seems to me pretty much the same pattern we saw with HRs. Thames missed a lot of RBI opportunities and that’s the headline: but when he delivered RBIs, 63% of the time they had an immediate impact, changing the fundamental game situation, and only 11% of the time did they have no significant impact.
Now, maybe these figures are actually typical of the average player, but they don’t give that impression. In the case of the leverage of Thames’s HR-based RBI, his distribution was very similar (58% / 10%) and proved not only better than the league HR leaders’, but very different in structure from Arenado, Bellinger, and Blackmon’s (though close to Stanton’s). By the way, Thames’s 58% of HRs that were tying or go-ahead blasts compares with the following lifetime figures for some well known players I checked out: Trout 55%; Mays 50%; Pujols 47%; Bonds 46%; Mantle 46%; McGwire 45%; Stanton 45%. (Of course, these players all may have had individual years with percentages as high as or higher than Thames’s, but I think this may give some sense of normal range.)
To clarify, as I saw my nom de electro-plume in there, the games in September, and their accompanying pressure, are indeed pennant race material. I never disputed that.
Where I’ve taken issue in the past is Managers’ tendency to treat the games earlier in the season with less urgency.
Apologies if I misrepresented you, Voomo. It may also be that I projected your name over a remembered comment that came from a different HHS poster who employed more strident phrasing.
The basic idea, though, seems critical to me: Although late-game/late-season events often entail an awareness of urgency that earlier events do not, the actual urgency of early and late events is equal. (And whether the late events do carry that sense of urgency is generally due to early events.)
Perhaps it was me.
I do phrase stridently at times, particularly about baseball.
Regardless, I agree with you.
My girlfriend surprised me with a tickets to a Yankees game in Oakland, 11 years ago.
It was game 2 of the season.
Had I been born one day earlier, I’d have gone to opening day, and seen a delightful 15-2 drubbing.
Instead, I got to watch Scott Proctor come in to a tie game in the 9th.
Not the Greatest Relief Pitcher of All Time.
No. Scott Proctor.
Walk, Bunt, Single, Ballgame.
Lousy Birthday.
Thank you Joe Torre.
Just to clarify, in spite of the wonderful discussion between you and epm that appears to show that on the relatively rare occasions that Thames did manage to produce it seems to have been in an above average percentage of situations where it had significant impact, I am also fully aware of the numerous deficiencies in his game. I just never would have predicted his having produced as much as he did altho I realize there’s precedent with Cecil Fielder (not to imply that Thames was anywhere near as good as Fielder, even overrated as he was).
Still, in a relatively normal season like this past one was, 31 home runs is a bunch and I don’t remember hearing about him a single time that I can recall. Maybe I had him confused with Marcus- their numbers have a fair bit in common.
This may or may not have some bearing on the MVP discussions. Sabermetrics tends to downplay or even ignore RBIs, deeming it to be a stat of opportunity. Nevertheless I don’t think that it should be ignored as it is a measure of how well a player hits with men on base and contributes to the production of runs. To level out the field I have created a table which lists the percentage of base runners driven in (%RDI) in decimal equivalents for all batters of the 2017 season with 275+ PA. There are 300 such players. I did not count PA in which the batter received a BB or HBP with runners on except for the bases loaded situation. I did not eliminate PA which resulted in CI.
Shown below are the results for the top 25 players with the highest %RDI. ROBadj is runners on base after subtracting out PA which resulted in a BB or HBP, ROBtot is the total number of runners on base, and HR, PA and RBI are seasonal values.
%RDI ROBadj ROBtot HR PA RBI Player
0.262 … 172 … 195 … 14 … 301 … 59 … Adam Lind
0.255 … 263 … 299 … 37 … 725 … 104 … Charlie Blackmon
0.252 … 214 … 250 … 17 … 389 … 71 … Adrian Beltre
0.230 … 404 … 449 … 37 … 680 … 130 … Nolan Arenado
0.229 … 293 … 322 … 23 … 515 … 90 … Marwin Gonzalez
0.229 … 328 … 378 … 25 … 605 … 100 … Anthony Rendon
0.228 … 355 … 396 … 20 … 616 … 101 … Nomar Mazara
0.226 … 234 … 266 … 21 … 428 … 74 … Willson Contreras
0.225 … 374 … 443 … 36 … 665 … 120 … Paul Goldschmidt
0.221 … 312 … 337 … 13 … 540 … 82 … Josh Reddick
0.220 … 363 … 423 … 39 … 645 … 119 … Nelson Cruz
0.220 … 355 … 410 … 24 … 712 … 102 … Mookie Betts
0.220 … 264 … 296 … 25 … 429 … 83 … Justin Bour
0.218 … 216 … 243 … 6 … 454 … 53 … Adam Frazier
0.215 … 325 … 366 … 23 … 593 … 93 … Daniel Murphy
0.215 … 209 … 241 … 33 … 496 … 78 … Josh Donaldson
0.214 … 257 … 295 … 7 … 463 … 62 … Dustin Pedroia
0.213 … 329 … 342 … 27 … 497 … 97 … Scooter Gennett
0.210 … 353 … 407 … 35 … 635 … 109 … Justin Upton
0.209 … 358 … 388 … 26 … 665 … 101 … Nicholas Castellanos
0.209 … 416 … 467 … 37 … 679 … 124 … Marcell Ozuna
0.208 … 307 … 403 … 36 … 707 … 100 … Joey Votto
0.207 … 280 … 320 … 29 … 492 … 87 … Bryce Harper
0.206 … 199 … 230 … 27 … 440 … 68 … Michael Conforto
0.206 … 355 … 405 … 59 … 692 … 132 … Giancarlo Stanton
The overall range for %RDI was .262 for LInd to .061 for Trevor Plouffe. The median value for those 300 players is .157. In case you’re wondering, Aaron Judge was tied for 91st place with a %RDI of .176. Also Adam Duvall, who had 99 RBI, was tied for 192nd place with a %RDI of .147. He led the ML with 490 ROBtot and 463 ROBadj.
If anyone requests I can publish the entire list.
Richard, Please count me as requesting the entire list – I think this is great stuff. Thank you!
In light of the exchanges with nsb above, I think there are interesting ways your RDI stat could be combined with HRs (taking the batter as a runner to be driven in) and WPA to move towards a weighted figure that reflects both contributions to the production of runs and contributions that influence game outcomes.
Here’s the list.
%RDI ROBadj ROBtot HR PA RBI Player
0.262 … 172 … 195 … 14 … 301 … 59 … Adam Lind
0.255 … 263 … 299 … 37 … 725 … 104 … Charlie Blackmon
0.252 … 214 … 250 … 17 … 389 … 71 … Adrian Beltre
0.230 … 404 … 449 … 37 … 680 … 130 … Nolan Arenado
0.229 … 293 … 322 … 23 … 515 … 90 … Marwin Gonzalez
0.229 … 328 … 378 … 25 … 605 … 100 … Anthony Rendon
0.228 … 355 … 396 … 20 … 616 … 101 … Nomar Mazara
0.226 … 234 … 266 … 21 … 428 … 74 … Willson Contreras
0.225 … 374 … 443 … 36 … 665 … 120 … Paul Goldschmidt
0.221 … 312 … 337 … 13 … 540 … 82 … Josh Reddick
0.220 … 363 … 423 … 39 … 645 … 119 … Nelson Cruz
0.220 … 355 … 410 … 24 … 712 … 102 … Mookie Betts
0.220 … 264 … 296 … 25 … 429 … 83 … Justin Bour
0.218 … 216 … 243 … 6 … 454 … 53 … Adam Frazier
0.215 … 325 … 366 … 23 … 593 … 93 … Daniel Murphy
0.215 … 209 … 241 … 33 … 496 … 78 … Josh Donaldson
0.214 … 257 … 295 … 7 … 463 … 62 … Dustin Pedroia
0.213 … 329 … 342 … 27 … 497 … 97 … Scooter Gennett
0.210 … 353 … 407 … 35 … 635 … 109 … Justin Upton
0.209 … 358 … 388 … 26 … 665 … 101 … Nicholas Castellanos
0.209 … 416 … 467 … 37 … 679 … 124 … Marcell Ozuna
0.208 … 307 … 403 … 36 … 707 … 100 … Joey Votto
0.207 … 280 … 320 … 29 … 492 … 87 … Bryce Harper
0.206 … 199 … 230 … 27 … 440 … 68 … Michael Conforto
0.206 … 355 … 405 … 59 … 692 … 132 … Giancarlo Stanton
0.205 … 312 … 369 … 7 … 597 … 71 … Joe Mauer
0.205 … 249 … 292 … 34 … 629 … 85 … George Springer
0.203 … 300 … 316 … 10 … 425 … 71 … Gerardo Parra
0.201 … 374 … 436 … 30 … 635 … 105 … Jake Lamb
0.200 … 345 … 379 … 33 … 675 … 102 … Jose Abreu
0.200 … 185 … 220 … 12 … 370 … 49 … Tyler Flowers
0.199 … 266 … 283 … 9 … 459 … 62 … Ryan Goins
0.199 … 216 … 241 … 22 … 401 … 65 … Luis Valbuena
0.197 … 370 … 396 … 32 … 675 … 105 … Jonathan Schoop
0.196 … 301 … 321 … 19 … 630 … 78 … Whit Merrifield
0.196 … 358 … 404 … 31 … 606 … 101 … Travis Shaw
0.195 … 231 … 249 … 20 … 367 … 65 … Matt Adams
0.195 … 380 … 412 … 23 … 648 … 97 … Robinson Cano
0.195 … 185 … 208 … 16 … 311 … 52 … Jesus Aguilar
0.193 … 336 … 367 … 36 … 617 … 101 … Jay Bruce
0.193 … 321 … 347 … 18 … 561 … 80 … Avisail Garcia
0.193 … 223 … 234 … 12 … 325 … 55 … Evan Gattis
0.193 … 223 … 244 … 9 … 375 … 52 … Michael Brantley
0.193 … 306 … 345 … 45 … 489 … 104 … J.D. Martinez
0.192 … 240 … 257 … 19 … 412 … 65 … Aaron Altherr
0.192 … 167 … 178 … 7 … 301 … 39 … Sandy Leon
0.191 … 225 … 236 … 12 … 343 … 55 … Nick Williams
0.191 … 367 … 422 … 20 … 658 … 90 … Andrew Benintendi
0.190 … 378 … 413 … 36 … 576 … 108 … Ryan Zimmerman
0.190 … 168 … 183 … 9 … 334 … 41 … Howie Kendrick
0.190 … 405 … 482 … 32 … 691 … 109 … Anthony Rizzo
0.190 … 242 … 289 … 18 … 491 … 64 … Dexter Fowler
0.190 … 158 … 170 … 10 … 344 … 40 … Jose Pirela
0.190 … 290 … 326 … 22 … 613 … 77 … Corey Seager
0.189 … 317 … 357 … 24 … 481 … 84 … Carlos Correa
0.188 … 298 … 342 … 22 … 636 … 78 … Shin-Soo Choo
0.188 … 165 … 187 … 19 … 309 … 50 … Kurt Suzuki
0.187 … 342 … 359 … 18 … 543 … 82 … Yadier Molina
0.187 … 171 … 191 … 14 … 307 … 46 … Jose Martinez
0.187 … 246 … 307 … 23 … 622 … 69 … Matt Carpenter
0.187 … 230 … 281 … 28 … 514 … 71 … Freddie Freeman
0.187 … 359 … 404 … 30 … 593 … 97 … Mark Reynolds
0.187 … 418 … 449 … 23 … 636 … 101 … Albert Pujols
0.186 … 220 … 249 … 10 … 398 … 51 … Daniel Descalso
0.185 … 243 … 284 … 19 … 427 … 64 … Matt Holliday
0.185 … 335 … 368 … 33 … 690 … 95 … Manny Machado
0.184 … 369 … 389 … 17 … 666 … 85 … Melky Cabrera
0.184 … 207 … 216 … 8 … 323 … 46 … Albert Almora
0.184 … 376 … 432 … 38 … 669 … 107 … Edwin Encarnacion
0.183 … 300 … 341 … 30 … 607 … 85 … Domingo Santana
0.183 … 202 … 224 … 15 … 361 … 52 … Aaron Hicks
0.183 … 366 … 400 … 43 … 652 … 110 … Khris Davis
0.183 … 372 … 421 … 8 … 670 … 76 … Nick Markakis
0.182 … 225 … 251 … 16 … 376 … 57 … Travis d’Arnaud
0.182 … 379 … 414 … 25 … 671 … 94 … Eric Hosmer
0.182 … 303 … 345 … 14 … 645 … 69 … Jed Lowrie
0.181 … 188 … 199 … 11 … 447 … 45 … Trea Turner
0.181 … 216 … 253 … 24 … 507 … 63 … Zack Cozart
0.180 … 217 … 283 … 33 … 507 … 72 … Mike Trout
0.180 … 323 … 353 … 24 … 555 … 82 … Trevor Story
0.179 … 285 … 309 … 21 … 568 … 72 … Chris Taylor
0.179 … 190 … 199 … 9 … 359 … 43 … Manny Pina
0.178 … 381 … 405 … 20 … 689 … 88 … Elvis Andrus
0.178 … 264 … 279 … 16 … 473 … 63 … Starlin Castro
0.178 … 309 … 368 … 12 … 568 … 67 … Buster Posey
0.178 … 281 … 326 … 23 … 530 … 73 … Tommy Pham
0.177 … 288 … 313 … 15 … 500 … 66 … Danny Valencia
0.177 … 226 … 241 … 16 … 373 … 56 … C.J. Cron
0.177 … 328 … 380 … 39 … 548 … 97 … Cody Bellinger
0.177 … 345 … 369 … 13 … 544 … 74 … Jorge Polanco
0.176 … 306 … 328 … 24 … 586 … 78 … Trey Mancini
0.176 … 363 … 404 … 26 … 620 … 90 … Josh Bell
0.176 … 358 … 407 … 18 … 695 … 81 … Christian Yelich
0.176 … 148 … 172 … 17 … 316 … 43 … Chris Iannetta
0.176 … 353 … 427 … 52 … 678 … 114 … Aaron Judge
0.175 … 263 … 275 … 12 … 491 … 58 … Eduardo Nunez
0.175 … 223 … 235 … 12 … 386 … 51 … Chris Owings
0.175 … 286 … 308 … 13 … 480 … 63 … Brandon Drury
0.174 … 287 … 340 … 21 … 543 … 71 … Justin Turner
0.174 … 345 … 381 … 28 … 650 … 88 … Andrew McCutchen
0.174 … 299 … 314 … 21 … 499 … 73 … Eduardo Escobar
0.174 … 311 … 336 … 13 … 539 … 67 … Hunter Pence
0.174 … 265 … 290 … 18 … 512 … 64 … Yangervis Solarte
0.173 … 300 … 346 … 19 … 654 … 71 … Kole Calhoun
0.173 … 381 … 416 … 20 … 677 … 86 … Evan Longoria
0.173 … 301 … 323 … 23 … 508 … 75 … Javier Baez
0.173 … 330 … 380 … 22 … 576 … 79 … Mitch Moreland
0.173 … 278 … 296 … 11 … 550 … 59 … Ben Gamel
0.173 … 278 … 293 … 6 … 489 … 54 … Jose Iglesias
0.172 … 343 … 390 … 34 … 705 … 93 … Brian Dozier
0.171 … 257 … 282 … 24 … 413 … 68 … Ian Happ
0.171 … 333 … 371 … 33 … 525 … 90 … Gary Sanchez
0.170 … 335 … 357 … 18 … 564 … 75 … Yuli Gurriel
0.170 … 312 … 328 … 27 … 499 … 80 … Salvador Perez
0.170 … 224 … 270 … 4 … 411 … 42 … Kolten Wong
0.169 … 366 … 383 … 25 … 570 … 87 … Didi Gregorius
0.169 … 260 … 288 … 18 … 399 … 62 … Brian McCann
0.168 … 256 … 282 … 10 … 573 … 53 … Joe Panik
0.167 … 282 … 304 … 20 … 481 … 67 … Jedd Gyorko
0.167 … 210 … 239 … 14 … 448 … 49 … Neil Walker
0.167 … 168 … 174 … 12 … 303 … 40 … Stephen Vogt
0.166 … 199 … 216 … 20 … 365 … 53 … Welington Castillo
0.165 … 284 … 312 … 38 … 598 … 85 … Mike Moustakas
0.165 … 339 … 374 … 33 … 723 … 89 … Francisco Lindor
0.165 … 291 … 319 … 11 … 481 … 59 … Jason Heyward
0.164 … 384 … 411 … 14 … 570 … 77 … Brandon Crawford
0.163 … 153 … 170 … 1 … 306 … 26 … Miguel Rojas
0.163 … 184 … 209 … 10 … 386 … 40 … Marcus Semien
0.163 … 184 … 199 … 5 … 374 … 35 … Norichika Aoki
0.162 … 345 … 376 … 8 … 682 … 64 … DJ LeMahieu
0.162 … 376 … 414 … 27 … 650 … 88 … Kyle Seager
0.162 … 352 … 398 … 24 … 662 … 81 … Jose Altuve
0.162 … 229 … 256 … 29 … 485 … 66 … Mike Napoli
0.162 … 229 … 263 … 10 … 407 … 47 … Jason Castro
0.161 … 223 … 241 … 13 … 391 … 49 … James McCann
0.161 … 279 … 306 … 14 … 540 … 59 … Asdrubal Cabrera
0.161 … 261 … 323 … 10 … 503 … 52 … David Freese
0.160 … 268 … 301 … 25 … 544 … 68 … Matthew Joyce
0.160 … 262 … 276 … 26 … 443 … 68 … Matt Davidson
0.160 … 150 … 167 … 7 … 339 … 31 … Starling Marte
0.159 … 309 … 343 … 28 … 483 … 77 … Miguel Sano
0.158 … 265 … 284 … 14 … 383 … 56 … Yan Gomes
0.158 … 202 … 233 … 2 … 433 … 34 … Jon Jay
0.158 … 221 … 255 … 14 … 376 … 49 … Alex Avila
0.158 … 341 … 376 … 29 … 645 … 83 … Jose Ramirez
0.158 … 297 … 317 … 12 … 534 … 59 … Yolmer Sanchez
0.158 … 209 … 222 … 7 … 373 … 40 … Ian Desmond
0.158 … 298 … 321 … 22 … 533 … 69 … Tommy Joseph
0.158 … 292 … 318 … 11 … 718 … 57 … Ender Inciarte
0.157 … 318 … 357 … 19 … 568 … 69 … Max Kepler
0.157 … 350 … 371 … 14 … 647 … 69 … Andrelton Simmons
0.157 … 364 … 393 … 28 … 608 … 85 … Kendrys Morales
0.156 … 276 … 301 … 14 … 577 … 57 … David Peralta
0.156 … 180 … 204 … 7 … 318 … 35 … Austin Jackson
0.155 … 251 … 295 … 41 … 532 … 80 … Joey Gallo
0.155 … 335 … 371 … 10 … 635 … 62 … Xander Bogaerts
0.155 … 213 … 251 … 18 … 451 … 51 … Brandon Belt
0.155 … 362 … 426 … 26 … 632 … 82 … Eugenio Suarez
0.155 … 291 … 315 … 19 … 467 … 64 … Matt Kemp
0.155 … 220 … 248 … 17 … 426 … 51 … Carlos Gomez
0.154 … 227 … 251 … 14 … 466 … 49 … A.J. Pollock
0.154 … 240 … 262 … 18 … 417 … 55 … Austin Hedges
0.154 … 253 … 280 … 25 … 435 … 64 … Mike Zunino
0.154 … 156 … 169 … 9 … 326 … 33 … Leury Garcia
0.153 … 215 … 223 … 3 … 336 … 36 … Ronald Torreyes
0.153 … 189 … 202 … 11 … 436 … 40 … Jonathan Villar
0.153 … 365 … 428 … 23 … 667 … 79 … Carlos Santana
0.153 … 339 … 371 … 19 … 626 … 71 … Alex Bregman
0.153 … 346 … 362 … 25 … 605 … 78 … Ryon Healy
0.153 … 262 … 295 … 13 … 464 … 53 … Derek Dietrich
0.153 … 249 … 279 … 26 … 527 … 64 … Curtis Granderson
0.153 … 236 … 277 … 9 … 456 … 45 … Robbie Grossman
0.152 … 341 … 389 … 38 … 637 … 90 … Justin Smoak
0.152 … 309 … 326 … 13 … 604 … 60 … Brandon Phillips
0.152 … 316 … 374 … 30 … 617 … 78 … Steven Souza
0.152 … 224 … 243 … 19 … 432 … 53 … Michael Taylor
0.152 … 165 … 195 … 10 … 302 … 35 … John Jaso
0.150 … 173 … 185 … 8 … 353 … 34 … Chase Utley
0.150 … 233 … 254 … 17 … 425 … 52 … Ryan Braun
0.150 … 327 … 391 … 27 … 576 … 76 … Todd Frazier
0.150 … 307 … 348 … 28 … 570 … 74 … Yasiel Puig
0.150 … 167 … 189 … 6 … 295 … 31 … Danny Espinosa
0.150 … 301 … 349 … 6 … 551 … 51 … Dansby Swanson
0.149 … 194 … 204 … 7 … 312 … 36 … Adam Rosales
0.149 … 261 … 306 … 28 … 521 … 67 … Yonder Alonso
0.149 … 295 … 327 … 16 … 529 … 60 … Miguel Cabrera
0.149 … 228 … 238 … 18 … 362 … 52 … Wilmer Flores
0.149 … 309 … 340 … 17 … 541 … 63 … Jackie Bradley
0.149 … 175 … 196 … 5 … 304 … 31 … Francisco Cervelli
0.148 … 230 … 257 … 6 … 481 … 40 … Jonathan Lucroy
0.148 … 271 … 285 … 22 … 575 … 62 … Tim Beckham
0.147 … 251 … 281 … 7 … 423 … 44 … Tucker Barnhart
0.147 … 285 … 322 … 21 … 682 … 63 … Brett Gardner
0.147 … 353 … 384 … 24 … 623 … 76 … Maikel Franco
0.147 … 211 … 228 … 12 … 542 … 43 … Denard Span
0.147 … 463 … 490 … 31 … 647 … 99 … Adam Duvall
0.146 … 219 … 248 … 7 … 409 … 39 … Jacoby Ellsbury
0.145 … 117 … 135 … 13 … 278 … 30 … Brian Goodwin
0.145 … 276 … 295 … 25 … 443 … 65 … Paul DeJong
0.145 … 166 … 187 … 7 … 381 … 31 … Yunel Escobar
0.144 … 208 … 256 … 6 … 439 … 36 … Logan Forsythe
0.144 … 292 … 320 … 10 … 465 … 52 … Matt Wieters
0.144 … 299 … 324 … 15 … 561 … 58 … Jose Reyes
0.144 … 174 … 186 … 17 … 321 … 42 … Yoenis Cespedes
0.144 … 216 … 227 … 8 … 332 … 39 … Bradley Zimmer
0.143 … 328 … 348 … 26 … 635 … 73 … Adam Jones
0.142 … 309 … 354 … 30 … 649 … 74 … Wil Myers
0.142 … 190 … 200 … 15 … 309 … 42 … Chad Pinder
0.142 … 183 … 197 … 14 … 326 … 40 … Matt Chapman
0.142 … 359 … 380 … 27 … 589 … 78 … Eddie Rosario
0.142 … 338 … 349 … 6 … 629 … 54 … Alcides Escobar
0.141 … 262 … 273 … 14 … 458 … 51 … Hernan Perez
0.141 … 312 … 379 … 29 … 665 … 73 … Kris Bryant
0.141 … 213 … 243 … 9 … 401 … 39 … Stephen Piscotty
0.141 … 348 … 381 … 12 … 586 … 61 … Chase Headley
0.141 … 185 … 191 … 4 … 294 … 30 … Kevan Smith
0.140 … 242 … 283 … 30 … 491 … 64 … Lucas Duda
0.140 … 314 … 355 … 14 … 558 … 58 … Jordy Mercer
0.140 … 308 … 342 … 14 … 534 … 57 … Carlos Gonzalez
0.139 … 187 … 223 … 11 … 342 … 37 … Enrique Hernandez
0.138 … 224 … 260 … 9 … 407 … 40 … Brad Miller
0.138 … 254 … 298 … 26 … 524 … 61 … Chris Davis
0.138 … 189 … 200 … 13 … 529 … 39 … Manuel Margot
0.137 … 342 … 402 … 38 … 601 … 85 … Logan Morrison
0.137 … 233 … 286 … 31 … 551 … 63 … Eric Thames
0.137 … 226 … 256 … 12 … 385 … 43 … Addison Russell
0.137 … 351 … 384 … 17 … 579 … 65 … J.T. Realmuto
0.137 … 249 … 265 … 11 … 566 … 45 … Jean Segura
0.136 … 176 … 204 … 11 … 323 … 35 … Joc Pederson
0.136 … 360 … 385 … 12 … 663 … 61 … Freddy Galvis
0.136 … 309 … 351 … 23 … 686 … 65 … Jose Bautista
0.136 … 140 … 155 … 10 … 289 … 29 … Jayson Werth
0.135 … 274 … 303 … 10 … 435 … 47 … Victor Martinez
0.135 … 282 … 312 … 12 … 496 … 50 … Ben Zobrist
0.134 … 283 … 302 … 15 … 548 … 53 … Orlando Arcia
0.134 … 246 … 263 … 13 … 486 … 46 … Cory Spangenberg
0.134 … 232 … 258 … 16 … 410 … 47 … Mitch Haniger
0.133 … 113 … 131 … 3 … 299 … 18 … Eric Sogard
0.133 … 196 … 212 … 9 … 303 … 35 … Nick Hundley
0.132 … 204 … 215 … 5 … 345 … 32 … Christian Vazquez
0.131 … 175 … 194 … 12 … 373 … 35 … Jason Kipnis
0.131 … 274 … 300 … 22 … 482 … 58 … Yasmani Grandal
0.130 … 161 … 184 … 17 … 309 … 38 … Robinson Chirinos
0.130 … 324 … 343 … 14 … 563 … 56 … Odubel Herrera
0.129 … 225 … 258 … 30 … 486 … 59 … Kyle Schwarber
0.129 … 280 … 314 … 9 … 541 … 45 … Alex Gordon
0.128 … 288 … 308 … 22 … 442 … 59 … Randal Grichuk
0.128 … 187 … 205 … 13 … 348 … 37 … Steve Pearce
0.128 … 141 … 168 … 2 … 290 … 20 … Greg Garcia
0.128 … 149 … 159 … 1 … 308 … 20 … Ben Revere
0.127 … 353 … 377 … 30 … 651 … 75 … Rougned Odor
0.127 … 236 … 263 … 22 … 613 … 52 … Ian Kinsler
0.127 … 276 … 306 … 16 … 511 … 51 … Byron Buxton
0.127 … 158 … 176 … 14 … 331 … 34 … Cameron Rupp
0.126 … 222 … 245 … 22 … 401 … 50 … Brandon Moss
0.126 … 270 … 290 … 4 … 633 … 38 … Billy Hamilton
0.126 … 278 … 304 … 27 … 629 … 62 … Corey Dickerson
0.126 … 183 … 193 … 9 … 279 … 32 … Pablo Sandoval
0.125 … 296 … 315 … 14 … 509 … 51 … Carlos Beltran
0.125 … 232 … 257 … 20 … 463 … 49 … Keon Broxton
0.123 … 260 … 273 … 26 … 479 … 58 … Hunter Renfroe
0.123 … 301 … 339 … 30 … 531 … 67 … Scott Schebler
0.121 … 256 … 284 … 16 … 542 … 47 … Josh Harrison
0.121 … 281 … 308 … 15 … 645 … 49 … Lorenzo Cain
0.120 … 183 … 205 … 0 … 348 … 22 … Gorkys Hernandez
0.120 … 325 … 370 … 23 … 553 … 62 … Hanley Ramirez
0.119 … 202 … 220 … 15 … 421 … 39 … Kevin Kiermaier
0.119 … 329 … 345 … 17 … 606 … 56 … Tim Anderson
0.118 … 211 … 233 … 10 … 450 … 35 … Cameron Maybin
0.118 … 211 … 237 … 5 … 390 … 30 … Jarrod Dyson
0.118 … 355 … 375 … 23 … 603 … 65 … Mark Trumbo
0.118 … 161 … 180 … 13 … 373 … 32 … Seth Smith
0.118 … 221 … 235 … 12 … 379 … 38 … Mikie Mahtook
0.118 … 187 … 196 … 8 … 348 … 30 … Adeiny Hechavarria
0.117 … 213 … 240 … 9 … 577 … 34 … Cesar Hernandez
0.117 … 188 … 223 … 13 … 365 … 35 … Russell Martin
0.116 … 268 … 278 … 2 … 695 … 33 … Dee Gordon
0.113 … 282 … 302 … 5 … 518 … 37 … Jose Peraza
0.113 … 186 … 195 … 4 … 348 … 25 … Andrew Romine
0.112 … 205 … 222 … 17 … 422 … 40 … Jorge Bonifacio
0.112 … 161 … 180 … 7 … 276 … 25 … Chris Young
0.106 … 226 … 249 … 11 … 411 … 35 … Gregory Polanco
0.106 … 179 … 199 … 7 … 280 … 26 … Taylor Motter
0.104 … 164 … 168 … 4 … 343 … 21 … Carlos Asuaje
0.100 … 160 … 177 … 5 … 365 … 21 … Wilmer Difo
0.096 … 157 … 166 … 4 … 277 … 19 … Joey Rickard
0.093 … 258 … 274 … 14 … 471 … 38 … Martin Maldonado
0.090 … 166 … 188 … 7 … 370 … 22 … Erick Aybar
0.090 … 134 … 145 … 2 … 295 … 14 … Omar Narvaez
0.089 … 180 … 201 … 6 … 440 … 22 … Delino DeShields
0.089 … 169 … 189 … 6 … 336 … 21 … Adam Engel
0.088 … 147 … 155 … 7 … 301 … 20 … Aledmys Diaz
0.087 … 218 … 224 … 6 … 362 … 25 … Darwin Barney
0.084 … 143 … 162 … 8 … 325 … 20 … Ezequiel Carrera
0.083 … 180 … 194 … 5 … 366 … 20 … Rajai Davis
0.081 … 322 … 336 … 16 … 632 … 42 … Kevin Pillar
0.080 … 226 … 243 … 6 … 426 … 24 … Guillermo Heredia
0.076 … 132 … 142 … 2 … 282 … 12 … Mallex Smith
0.071 … 141 … 151 … 0 … 281 … 10 … Tyler Saladino
0.061 … 163 … 173 … 9 … 313 … 19 … Trevor Plouffe
This list can be placed into an Excel spreadsheet but you have to know how to use the Text-to-Column feature to separate the stats into individual columns.
Thanks, Richard. As a bonus I now know how to use the Text-to-Column feature (at least till my next aging short-term-memory wash).
epm: I did the analysis counting the batter as a base runner and the results did change. Here they are. Remember I did not take catcher’s interference and sacrifices into account, those numbers are very small for almost all players and will have a negligible effect.
ROBadj %RDI Player
742 ….. 0.140 ….. J.D. Martinez
955 ….. 0.138 ….. Giancarlo Stanton
445 ….. 0.133 ….. Adam Lind
645 ….. 0.129 ….. Justin Bour
926 ….. 0.129 ….. Nelson Cruz
937 ….. 0.128 ….. Paul Goldschmidt
1018….. 0.128 ….. Nolan Arenado
899 ….. 0.127 ….. Aaron Judge
560 ….. 0.127 ….. Adrian Beltre
626 ….. 0.125 ….. Josh Donaldson
703 ….. 0.124 ….. Bryce Harper
792 ….. 0.122 ….. Scooter Gennett
614 ….. 0.121 ….. Willson Contreras
1031….. 0.120 ….. Marcell Ozuna
911 ….. 0.120 ….. Justin Upton
811 ….. 0.120 ….. Cody Bellinger
753 ….. 0.120 ….. Marwin Gonzalez
907 ….. 0.119 ….. Ryan Zimmerman
842 ….. 0.119 ….. Anthony Rendon
574 ….. 0.118 ….. Michael Conforto
939 ….. 0.117 ….. Khris Davis
623 ….. 0.116 ….. Mike Trout
915 ….. 0.115 ….. Jake Lamb
872 ….. 0.115 ….. Joey Votto
568 ….. 0.114 ….. Luis Valbuena
936 ….. 0.114 ….. Edwin Encarnacion
700 ….. 0.114 ….. Joey Gallo
913 ….. 0.114 ….. Charlie Blackmon
574 ….. 0.113 ….. Matt Adams
743 ….. 0.113 ….. Carlos Correa
894 ….. 0.113 ….. Jay Bruce
444 ….. 0.113 ….. Kurt Suzuki
900 ….. 0.112 ….. Travis Shaw
808 ….. 0.111 ….. Gary Sanchez
467 ….. 0.111 ….. Jesus Aguilar
981 ….. 0.111 ….. Anthony Rizzo
912 ….. 0.111 ….. Nomar Mazara
882 ….. 0.110 ….. Mark Reynolds
627 ….. 0.108 ….. Ian Happ
862 ….. 0.108 ….. Daniel Murphy
613 ….. 0.106 ….. Aaron Altherr
803 ….. 0.106 ….. George Springer
672 ….. 0.106 ….. Freddie Freeman
970 ….. 0.105 ….. Jose Abreu
999 ….. 0.105 ….. Jonathan Schoop
734 ….. 0.105 ….. Miguel Sano
526 ….. 0.105 ….. Evan Gattis
977 ….. 0.103 ….. Nicholas Castellanos
988 ….. 0.103 ….. Mookie Betts
446 ….. 0.103 ….. Jose Martinez
621 ….. 0.103 ….. Matt Holliday
828 ….. 0.103 ….. Domingo Santana
509 ….. 0.102 ….. Aaron Hicks
421 ….. 0.102 ….. Chris Iannetta
542 ….. 0.101 ….. Nick Williams
789 ….. 0.101 ….. Salvador Perez
809 ….. 0.101 ….. Josh Reddick
701 ….. 0.101 ….. Gerardo Parra
614 ….. 0.101 ….. Brian McCann
845 ….. 0.101 ….. Mike Moustakas
658 ….. 0.100 ….. Mike Napoli
730 ….. 0.100 ….. Tommy Pham
681 ….. 0.100 ….. Matt Davidson
641 ….. 0.100 ….. Mike Zunino
903 ….. 0.100 ….. Justin Smoak
1015….. 0.100 ….. Albert Pujols
975 ….. 0.099 ….. Robinson Cano
857 ….. 0.099 ….. Logan Morrison
827 ….. 0.099 ….. Trevor Story
576 ….. 0.099 ….. Travis d’Arnaud
916 ….. 0.098 ….. Josh Bell
570 ….. 0.098 ….. C.J. Cron
542 ….. 0.098 ….. Welington Castillo
974 ….. 0.098 ….. Manny Machado
504 ….. 0.097 ….. Tyler Flowers
962 ….. 0.097 ….. Brian Dozier
778 ….. 0.096 ….. Javier Baez
853 ….. 0.096 ….. Yadier Molina
666 ….. 0.096 ….. Dexter Fowler
760 ….. 0.096 ….. Eduardo Escobar
667 ….. 0.096 ….. Lucas Duda
918 ….. 0.096 ….. Andrew McCutchen
908 ….. 0.096 ….. Didi Gregorius
658 ….. 0.096 ….. Zack Cozart
984 ….. 0.096 ….. Eric Hosmer
840 ….. 0.095 ….. Avisail Garcia
949 ….. 0.095 ….. Andrew Benintendi
752 ….. 0.094 ….. Justin Turner
806 ….. 0.094 ….. Todd Frazier
712 ….. 0.094 ….. Yonder Alonso
843 ….. 0.094 ….. Mitch Moreland
715 ….. 0.094 ….. Jedd Gyorko
694 ….. 0.094 ….. Paul DeJong
1061….. 0.093 ….. Adam Duvall
669 ….. 0.093 ….. Dustin Pedroia
842 ….. 0.093 ….. Steven Souza
832 ….. 0.093 ….. Corey Seager
565 ….. 0.092 ….. Michael Brantley
750 ….. 0.092 ….. Matt Carpenter
924 ….. 0.092 ….. Kendrys Morales
609 ….. 0.092 ….. Yan Gomes
850 ….. 0.092 ….. Shin-Soo Choo
534 ….. 0.092 ….. Alex Avila
960 ….. 0.092 ….. Kyle Seager
853 ….. 0.091 ….. Trey Mancini
744 ….. 0.091 ….. Matthew Joyce
701 ….. 0.091 ….. Curtis Granderson
811 ….. 0.091 ….. Yasiel Puig
570 ….. 0.091 ….. Wilmer Flores
647 ….. 0.091 ….. Kyle Schwarber
901 ….. 0.091 ….. Eugenio Suarez
566 ….. 0.090 ….. Daniel Descalso
511 ….. 0.090 ….. Albert Almora
800 ….. 0.090 ….. Chris Taylor
467 ….. 0.090 ….. Yoenis Cespedes
702 ….. 0.090 ….. Eric Thames
694 ….. 0.089 ….. Ryan Goins
426 ….. 0.089 ….. Robinson Chirinos
998 ….. 0.089 ….. Francisco Lindor
931 ….. 0.089 ….. Jose Ramirez
450 ….. 0.089 ….. Stephen Vogt
710 ….. 0.089 ….. Starlin Castro
746 ….. 0.088 ….. Danny Valencia
476 ….. 0.088 ….. Chad Pinder
442 ….. 0.088 ….. Sandy Leon
731 ….. 0.088 ….. Matt Kemp
846 ….. 0.087 ….. Jorge Polanco
631 ….. 0.087 ….. Austin Hedges
735 ….. 0.087 ….. Yangervis Solarte
896 ….. 0.087 ….. Whit Merrifield
796 ….. 0.087 ….. Tommy Joseph
475 ….. 0.086 ….. Howie Kendrick
591 ….. 0.086 ….. Chris Owings
870 ….. 0.086 ….. Yuli Gurriel
779 ….. 0.086 ….. Scott Schebler
733 ….. 0.086 ….. Brandon Drury
596 ….. 0.086 ….. Brandon Belt
596 ….. 0.086 ….. Carlos Gomez
947 ….. 0.086 ….. Jose Altuve
1029….. 0.086 ….. Elvis Andrus
1006….. 0.085 ….. Evan Longoria
714 ….. 0.085 ….. Chris Davis
913 ….. 0.085 ….. Eddie Rosario
586 ….. 0.085 ….. Brandon Moss
997 ….. 0.085 ….. Melky Cabrera
626 ….. 0.085 ….. Adam Frazier
626 ….. 0.085 ….. Michael Taylor
579 ….. 0.085 ….. James McCann
473 ….. 0.085 ….. Jose Pirela
840 ….. 0.085 ….. Joe Mauer
911 ….. 0.085 ….. Brandon Crawford
924 ….. 0.084 ….. Ryon Healy
617 ….. 0.084 ….. Ryan Braun
938 ….. 0.084 ….. Carlos Santana
475 ….. 0.084 ….. Matt Chapman
867 ….. 0.084 ….. Kris Bryant
702 ….. 0.084 ….. Randal Grichuk
883 ….. 0.084 ….. Wil Myers
967 ….. 0.084 ….. Christian Yelich
422 ….. 0.083 ….. John Jaso
808 ….. 0.083 ….. Buster Posey
808 ….. 0.083 ….. Hunter Pence
833 ….. 0.083 ….. Max Kepler
706 ….. 0.082 ….. Hunter Renfroe
524 ….. 0.082 ….. Manny Pina
598 ….. 0.082 ….. Neil Walker
933 ….. 0.081 ….. Maikel Franco
875 ….. 0.081 ….. Kole Calhoun
728 ….. 0.081 ….. Jason Heyward
716 ….. 0.081 ….. Yasmani Grandal
371 ….. 0.081 ….. Brian Goodwin
587 ….. 0.080 ….. Jason Castro
793 ….. 0.079 ….. Jackie Bradley
733 ….. 0.079 ….. Eduardo Nunez
873 ….. 0.079 ….. Jed Lowrie
672 ….. 0.079 ….. Derek Dietrich
903 ….. 0.079 ….. Alex Bregman
929 ….. 0.079 ….. Adam Jones
968 ….. 0.079 ….. Nick Markakis
767 ….. 0.078 ….. Miguel Cabrera
602 ….. 0.078 ….. Mitch Haniger
964 ….. 0.078 ….. Rougned Odor
450 ….. 0.078 ….. Joc Pederson
764 ….. 0.077 ….. Asdrubal Cabrera
806 ….. 0.077 ….. Tim Beckham
488 ….. 0.076 ….. Enrique Hernandez
648 ….. 0.076 ….. Keon Broxton
821 ….. 0.076 ….. Hanley Ramirez
530 ….. 0.075 ….. Marcus Semien
464 ….. 0.075 ….. Austin Jackson
518 ….. 0.075 ….. Bradley Zimmer
691 ….. 0.075 ….. David Freese
652 ….. 0.075 ….. A.J. Pollock
454 ….. 0.075 ….. Cameron Rupp
601 ….. 0.075 ….. Trea Turner
791 ….. 0.075 ….. Ben Gamel
792 ….. 0.074 ….. Yolmer Sanchez
578 ….. 0.074 ….. Addison Russell
393 ….. 0.074 ….. Jayson Werth
503 ….. 0.074 ….. Steve Pearce
886 ….. 0.073 ….. J.T. Realmuto
491 ….. 0.073 ….. Adam Rosales
947 ….. 0.073 ….. Andrelton Simmons
700 ….. 0.073 ….. Hernan Perez
784 ….. 0.073 ….. Carlos Gonzalez
745 ….. 0.072 ….. Jose Iglesias
718 ….. 0.072 ….. Matt Wieters
622 ….. 0.072 ….. Robbie Grossman
554 ….. 0.072 ….. Ian Desmond
582 ….. 0.072 ….. Kolten Wong
903 ….. 0.072 ….. Jose Bautista
445 ….. 0.072 ….. Pablo Sandoval
487 ….. 0.072 ….. Nick Hundley
808 ….. 0.072 ….. Jose Reyes
461 ….. 0.072 ….. Leury Garcia
869 ….. 0.071 ….. Corey Dickerson
436 ….. 0.071 ….. Danny Espinosa
915 ….. 0.071 ….. Mark Trumbo
887 ….. 0.071 ….. Brett Gardner
818 ….. 0.071 ….. Jordy Mercer
804 ….. 0.071 ….. David Peralta
566 ….. 0.071 ….. Brad Miller
496 ….. 0.071 ….. Russell Martin
668 ….. 0.070 ….. Victor Martinez
441 ….. 0.070 ….. Francisco Cervelli
868 ….. 0.070 ….. Chase Headley
485 ….. 0.070 ….. Chase Utley
557 ….. 0.070 ….. Stephen Piscotty
629 ….. 0.070 ….. Tucker Barnhart
722 ….. 0.069 ….. Ben Zobrist
745 ….. 0.068 ….. Byron Buxton
908 ….. 0.068 ….. Xander Bogaerts
778 ….. 0.068 ….. Joe Panik
884 ….. 0.068 ….. Brandon Phillips
590 ….. 0.068 ….. Jorge Bonifacio
518 ….. 0.068 ….. Jason Kipnis
461 ….. 0.067 ….. Starling Marte
595 ….. 0.067 ….. Jonathan Villar
582 ….. 0.067 ….. Jacoby Ellsbury
539 ….. 0.067 ….. Ronald Torreyes
794 ….. 0.067 ….. Orlando Arcia
571 ….. 0.067 ….. Mikie Mahtook
526 ….. 0.067 ….. Norichika Aoki
962 ….. 0.067 ….. DJ LeMahieu
587 ….. 0.066 ….. Kevin Kiermaier
693 ….. 0.066 ….. Cory Spangenberg
769 ….. 0.066 ….. Carlos Beltran
787 ….. 0.066 ….. Ian Kinsler
852 ….. 0.066 ….. Odubel Herrera
492 ….. 0.065 ….. Seth Smith
793 ….. 0.064 ….. Dansby Swanson
467 ….. 0.064 ….. Kevan Smith
747 ….. 0.063 ….. Josh Harrison
574 ….. 0.063 ….. Logan Forsythe
974 ….. 0.063 ….. Freddy Galvis
405 ….. 0.062 ….. Chris Young
919 ….. 0.061 ….. Tim Anderson
657 ….. 0.061 ….. Jonathan Lucroy
428 ….. 0.061 ….. Miguel Rojas
710 ….. 0.061 ….. Denard Span
529 ….. 0.060 ….. Christian Vazquez
516 ….. 0.060 ….. Yunel Escobar
438 ….. 0.059 ….. Taylor Motter
961 ….. 0.059 ….. Ender Inciarte
762 ….. 0.059 ….. Alex Gordon
775 ….. 0.058 ….. Jean Segura
586 ….. 0.058 ….. Jon Jay
607 ….. 0.058 ….. Gregory Polanco
521 ….. 0.058 ….. Adeiny Hechavarria
608 ….. 0.058 ….. Cameron Maybin
681 ….. 0.057 ….. Manuel Margot
948 ….. 0.057 ….. Alcides Escobar
867 ….. 0.057 ….. Lorenzo Cain
696 ….. 0.055 ….. Martin Maldonado
563 ….. 0.053 ….. Jarrod Dyson
388 ….. 0.052 ….. Greg Garcia
363 ….. 0.050 ….. Eric Sogard
508 ….. 0.049 ….. Andrew Romine
773 ….. 0.048 ….. Jose Peraza
725 ….. 0.047 ….. Cesar Hernandez
435 ….. 0.046 ….. Aledmys Diaz
435 ….. 0.046 ….. Ezequiel Carrera
915 ….. 0.046 ….. Kevin Pillar
442 ….. 0.045 ….. Ben Revere
421 ….. 0.045 ….. Joey Rickard
560 ….. 0.045 ….. Darwin Barney
497 ….. 0.044 ….. Gorkys Hernandez
859 ….. 0.044 ….. Billy Hamilton
477 ….. 0.044 ….. Carlos Asuaje
478 ….. 0.044 ….. Adam Engel
504 ….. 0.044 ….. Erick Aybar
447 ….. 0.043 ….. Trevor Plouffe
500 ….. 0.042 ….. Wilmer Difo
614 ….. 0.039 ….. Guillermo Heredia
518 ….. 0.039 ….. Rajai Davis
573 ….. 0.038 ….. Delino DeShields
390 ….. 0.036 ….. Omar Narvaez
928 ….. 0.036 ….. Dee Gordon
391 ….. 0.031 ….. Mallex Smith
396 ….. 0.025 ….. Tyler Saladino
Terrific info, Richard. Thanks so much!
For most of my life I did what many others do in assessing productivity through RBI: subtract HRs to substitute RDI for RBI, interpreting RDI as ROBDI. I remember reading arguments by sportswriters that allowing batters to count both an R and an RBI when they hit a home run was deceptive. But later, someone, perhaps Bill James, wrote that HRs should indeed get at least double credit, since an RBI on a base-hit or an R for a baserunner was not self-earned: both depended on a teammate to score the run, while a HR hitter depended only on himself, and provided his team with a double-service.
That makes sense to me, and your tables are a pretty dramatic illustration of how much difference there is in the two points of view.
(I’m going to go back to the exchange with nsb to pursue this stuff with particular regard to Eric Thames.)
Those who would like to have Richard’s data as a spreadsheet can find it here.
J.D. Matinez heads Richard’s list, and he had a spectacular 2 1/2 months with Arizona, although I’m not sure he exactly propelled then into the playoffs. Anyway, that got me thinking about other mid-season trades of high performance players. The two that came to mind right away involved Hank Borowy in 1945, who probably did propel the Cubs into the Series, going 11-2 with a 2.13 ERA in August and September (10-5 for the Yankees in the first half), and Mark McGwire who did nada to help the Cards in the last two months of 1997. I don’t count Sutcliffe in ’84 (traded too early in the season) but mind mind is blank after that. What other prominent players had a split season in which they made a difference for the team they were traded to in July? Any ideas?
Well, I can think of Ted Kluszewski for the ChiSox in ’59 (although his impact was larger in the Series than in the last month of the season); Doyle Alexander for the ’87 Tigers (9-0 after August 12 trade; Tigers won their division by 2 games); C.C. Sabathia for the ’08 Brewers (11-2 after July 7 trade; Brewers got a wildcard berth by a one-game margin) . . .
Well, Rickey Henderson did it twice.
The first time, he scored 72 runs in 85 games (5.1 WAR) for the 1989 Athletes, was the ALCS MVP, and then got 9 hits in the 4 game WS sweep, with this line:
.474 / .524 / .895 / 1.419
…
In 1993, he was actually uncharacteristically not-great (or good) in his 44 regular season games with the Blue Birds (though he replaced Darnell Coles and Turner Ward, so…)
In the World Series, he got on base 11 times in 6 games, scoring 6 runs.
And it was Rickey who led off the 9th in Game 6 with a walk.
Molitor got him to 2nd with a one-out single.
So it was Rickey, his team down by one, leading-off behind Mitch Williams when that pitch was delivered to Joe Carter.
To take a very recent example, Justin Verlander made the 2017 Astros’ BRef WAR Top-12 gallery, registering 1.8 WAR in five September starts (5-0, 1.06 ERA, 0.647 WHIP). The Astros didn’t need his help to make the postseason, but he contributed mightily to their postseason success: 4-1 in six appearances (five starts), with a 2.21 ERA and a 0.818 WHIP.
True, he was traded in August, not in July.
The spreadsheet that Doug is referring to demonstrates the pitfall of judging a player solely by RBIs. Joey Votto had 100 RBIs compared to Adam Duvall’s 99 which could lead one to conclude that they were equals. Also shown is that Votto had 307 ROBadj to Duvall’s 463, a huge difference. Had Votto had 463 ROBadj it would have meant an additional 32 RBIs. And it was Votto getting on base so often that provided Duvall with his excessive number of ROBadj. It makes you wonder what would have been had Votto and Duvall switched places in the batting order.
Doug:
I presume you’re going to enter a new post on Roy Halladay.
Yes. Working on it now.
In looking up Roy Halliday’s record, I came across an astounding fact that I find worrisome for a reason I’ll try to explain further on in this screed. First, the FACT:
In Cy Young voting, four of the top five and five of the top ten lifetime recipients of award shares were contemporaries, all active as full-time players in the years 1992-2005 with all but one, Roger Clemens, the oldest, lasting through 2008, and all but the youngest, Pedro Martinez, in a rotation position by 1989. So, in other words, for a stretch of 20 years, five pitchers dominated the CYA voting to the not quite exclusion of everyone else. Maybe this is just. I don’t argue with the voting or the outcome.
What disturbs me, though, is that much of this period overlaps the steroid era, the big hitting era, the explosion into the three true outcomes era, the 50 ho-hum runs era, the pitching count era. I find it difficult to articulate what bothers me in exact terms, so I’m just going to make a few conjectures: Could it be that the two phenomena are flip sides of the same coin in some way? Did the boom in hitting create an opening for durable pitchers with not the same skills but skills resulting in the same outcome, narrowing, at the same time the opportunities to succeed for pitchers of lesser durability and precision? Does the decline and fall of the complete game play a roll in whatever is going on? Is there any really accurate way left to compare pitchers from, say 1990 on, with those who labored in previous times, given the huge change in the way pitchers are handled and the all or nothing approach of so many batters those pitchers face? Does this all mean that in fact, baseball has not evolved but morphed dramatically in the matter of a few years with no turning back?
I don’t know.
What an interesting inroad into the way the game has changed — I wouldn’t have thought of Cy Young shares as an index of that. I do think it’s true that the changes in the game in recent years have been among the most dramatic since the transition to the Lively Ball Era, and, like the old timers of the 1920s and ’30s, I think most of the changes are bad. I expect it looks very different to younger generations.
I do see some issues to think about with regard to using the CYA as an index in this way, and I’ll mention a few. First, the award itself is somewhat “younger” than it would appear when you’re calculating “shares.” As you know, although the CYA was instituted in 1956, only one was awarded for all MLB during the period 1956-66, which cuts in half the available shares to distribute to pitchers of that era. So for an award with a history of only 50 years in its current form, it may not be very unusual for 4 of the top 5 to come from pitchers active over a 20-year stretch. Looking at the “MVP shares” leaderboard, an award that covers 86 years (or 172 “league-years,” vs. 111 for the CYA), 5 of the top 7 were all active together during the years 1954-59 (although their primes have less overlap).
Moreover, over the somewhat longer period of 1956-69, CYA ballots indicated only first-place votes, meaning that there were only a total of 1.00 annual shares to go round in 1956-66, and 2.00 in 1967-69. By contrast, in 2016 there were 4.84 shares distributed to pitchers in the two leagues who appeared anywhere on the ballot.
As an illustration of the impact of this, consider that during the years 1963, 1965, and 1966, pitchers other than Sandy Koufax garnered a total of exactly 0.00 CYA “shares.” Obviously, under these rules it would be very unlikely to find multiple pitchers piling up high numbers of lifetime shares in the period prior to 1970 (Koufax at #11, Gibson at #18t, and Spahn at #25 are the leaders). For example, many people thought Juan Marichal was second only to Koufax as a pitcher during the 1960s (others would pick Gibson). Marichal’s lifetime CYA share was 0.01. This wasn’t because wasn’t among the dominant elite of NL pitchers throughout the ’60s, but because of the CYA voting rules. Pedro’s 4.26 career shares would shrink to 2.96 or less under 1950s-60s rules; he’d fall behind Koufax and his truncated career.
Even after 1970, the number of distributed shares continues to grow with changes in voting rules (in 1970, there were 3.62 available shares, vs. the 4.84 available last year). This inflation in CYA shares may account for the fact that apart from the “Big Four” who dominate the top of the chart (Rocket, Unit, Mad Dog, and Pedro), there were still enough shares left to put Glavine at #10, Saberhagen at #15, and Schilling at #23 (and, of course, both Halladay at #9 and Santana at #12 accrued their early CYA shares in competition with guys like Rocket and Pedro). In an earlier era, it would have been Carlton, Seaver, and Palmer (near exact contemporaries, and ##1, 2, 3 at the time of their retirements, with room in the then-Top 10 for rough contemporaries Saberhagen, Jenkins, Hunter, Perry, and Guidry – only Koufax and Gibson appeared on that list from the earlier generation).
None of this is to say that the basic issues you raise about the pivotal role of the ’90s and ’00s in changes in the contemporary game are not on target. I’m just not sure that the CYA share system sharpens the issue.
I’ve always wondered if there was any rhyme or reason to how talent at a particular position seems to “bunch up” at certain periods in baseball history.
It’s fairly easy to explain why pitchers from the dead ball era and before do so well by both traditional and advanced statistical measures but why were 5 of the top dozen or so shortstops almost exact contemporaries in the 1980’s (pushing the window a bit on Larkin) or 3 of the 4 greatest second basemen all active in the 10’s or center fielders in New York in the 50’s?
No doubt coincidence plays a large part- probably a very large part- but is there something more to it?
JAWS and the Hall of Stats both see 3 of the top 6 or 7 Hall of Stats first basemen as being concurrently active from 1880 to 1897. Coincidence or something more? Was their a reason teams wanted their best player at first base? (To be fair, Anson was principally a 3rd baseman in 3 seasons, an outfielder in another and very nearly a catcher in yet another, but all in the 1870’s.) And why were first baseman so weak as a group in the 1950’s, especially if you view Musial as an outfielder? Mickey Vernon & Earl Torgeson had a couple of decent years each, as did Moose Skowron. Some people see Gil Hodges as belonging in the Hall of Fame because he was by far the best first baseman of his era but is that a testament to his greatness or a reflection of the talent in the rest of the league?
Third baseman in the 80’s? (Don’t forget that Boggs would have won the batting crown if he had been given enough plate appearances as a rookie and that it took 5 years of his hitting over .300 in the minors including 2 years at AA and 2 more at AAA for him to finally get a shot as a 24 year old rookie). Were there any third baseman prior to that were genuine major offensive forces other than Eddie Matthews? Probably Santo. Home Run Baker for a few years. To a lesser extent Bob Elliott & Ken Boyer maybe. Al Rosen was briefly. Who else? Pie Traynor had 1 top 10 finish in offensive WAR in his career (5th in 1923) and none in OPS+. Graig Nettles had 1 in both (9th). Brooks Robinson had 3 (including a 10th place) in oWAR and one 6th in OPS+. Bill James talked about 3rd base being primarily a defense first position prior to Harlond Clift in the mid-30’s but except for Mathews and possibly Santo & Baker is there anyone who could be viewed as a offensive force even remotely close to the big 3 of the 80’s for any length of time?
Maybe there’s a pattern to a couple of these that can be explain by something other than sheer chance- early pitchers & 1st baseman and possibly a very tenuous, long-term one at third base. But mostly it looks to be just random chance.