
This post is for voting and discussion in the 128th round of balloting for the Circle of Greats (COG). This is the last of four rounds adding to the list of candidates eligible to receive your votes those players born in 1973. Rules and lists are after the jump.
The new group of 1973-born players, in order to join the eligible list, must, as usual, have played at least 10 seasons in the major leagues or generated at least 20 Wins Above Replacement (“WAR”, as calculated by baseball-reference.com, and for this purpose meaning 20 total WAR for everyday players and 20 pitching WAR for pitchers). This fourth group of 1973-born candidates, including those with R-Z surnames, completes the roster of eligible 1973-born candidates and joins the eligible holdovers from previous rounds to comprise the full list of players eligible to appear on your ballots.
In addition to voting for COG election among players on the main ballot, there will be also be voting for elevation to the main ballot among players on the secondary ballot. For both ballots, which may be voted at the same time or in separate posts, voters must include three and only three eligible players. For the main ballot election, the one player who appears on the most ballots cast in the round is inducted into the Circle of Greats, while for the secondary ballot election, the one player appearing on the most ballots cast is elevated to the main ballot for the next COG election round. In the case of ties, a runoff election round will be held for COG election, while a tie-breaking process will be followed to determine the secondary ballot winner.
Players who fail to win either ballot but appear on half or more of the ballots that are cast win four added future rounds of ballot eligibility. Players who appear on 25% or more of the ballots cast, but less than 50%, earn two added future rounds of ballot eligibility. One additional round of eligibility is earned by any player who appears on at least 10% of the ballots cast or, for the main ballot only, any player finishing in the top 9 (including ties) in ballot appearances. Holdover candidates on the main ballot who exhaust their eligibility will drop to the secondary ballot for the next COG election round, as will first time main ballot candidates who attract one or more votes but do not earn additional main ballot eligibility. Secondary ballot candidates who exhaust their eligibility will drop from that ballot, but will become eligible for possible reinstatement in a future Redemption round election.
All voting for this round closes at 11:59 PM EST Sunday, March 4th, while changes to previously cast ballots are allowed until 11:59 PM EST Friday, March 2nd.
If you’d like to follow the vote tally, and/or check to make sure I’ve recorded your vote correctly, you can see my ballot-counting spreadsheet for this round here: COG 1973 Part 4 Vote Tally. I’ll be updating the spreadsheet periodically with the latest votes. Initially, there is a row in the spreadsheet for every voter who has cast a ballot in any of the past rounds, but new voters are entirely welcome — new voters will be added to the spreadsheet as their ballots are submitted. Also initially, there is a column for each of the holdover candidates; additional player columns from the new born-in-1973 group will be added to the spreadsheet as votes are cast for them.
Choose your three players from the lists below of eligible players. The ten current holdovers are listed in order of the number of future rounds (including this one) through which they are assured eligibility, and alphabetically when the future eligibility number is the same. The 1973 birth-year players are listed below in order of the number of seasons each played in the majors, and alphabetically among players with the same number of seasons played.
Holdovers:
| MAIN BALLOT | Eligibility | Secondary BALLOT | ELIGIBILITY |
|---|---|---|---|
| Kevin Brown | 10 rounds | Andre Dawson | 7 rounds |
| Luis Tiant | 7 rounds | Ken Boyer | 3 rounds |
| Dick Allen | 5 rounds | Ted Lyons | 3 rounds |
| Bill Dahlen | 4 rounds | Rick Reuschel | 3 rounds |
| Manny Ramirez | 4 rounds | Willie Randoph | 2 rounds |
| Graig Nettles | 3 rounds | Todd Helton | 2 rounds |
| Richie Ashburn | 2 rounds | Andy Pettitte | this round ONLY |
| Ted Simmons | 2 rounds | ||
| Bobby Wallace | 2 rounds | ||
| Dwight Evans | this round ONLY | ||
| Don Sutton | this round ONLY |
Everyday Players (born in 1973, ten or more seasons played in the major leagues or at least 20 WAR, R-Z surname):
Ichiro Suzuki
Mike Sweeney
Dmitri Young
Todd Walker
Desi Relaford
Chris Stynes
Pitchers (born in 1973, ten or more seasons played in the major leagues or at least 20 WAR, R-Z surname):
Julian Tavarez
Jason Schmidt
Brett Tomko
Scott Schoeneweis
Justin Speier
Ismael Valdez
John Thomson
This round’s tidbits.
1. Ichiro Suzuki started his career with ten consecutive 200 hit seasons (2001-10), the longest ever streak of such seasons. Whose record did Ichiro break? Lloyd Waner, Johnny Pesky
2. Julian Tavarez recorded 50+ IP for six consecutive seasons (1999-2004), each with a different franchise. Tavarez’s 89 games pitched led the NL in 1997 and are the most by a pitcher finishing fewer than 15% of his relief appearances. Who was the first pitcher to lead his league in appearances in such a season?
3. Mike Sweeney is one of five players with 200 career games at C, 1B and DH. Which of those players has hit the fewest career home runs? Joe Mauer
4. Brett Tomko is one of eight pitchers of the expansion era to record a 200+ IP season allowing 11 or more hits per 9 IP. Which of those pitchers, like Tomko, posted a winning record in that season?
5. Jason Schmidt posted a .678 W-L% for the Giants, but .468 everywhere else. Among the 15 pitchers with 100+ decisions for the Giants and 100+ decisions for other teams, who has the only W-L% difference larger than Schmidt’s? Jesse Barnes
6. Dmitri Young’s 5253 career PA are the fewest in the expansion era among retired players with 300 doubles. Young recorded a top season of 48 doubles as a 24 year-old in 1998. Who is the only younger Red outfielder with a 40 double season? Vada Pinson
7. Scott Schoeneweis’s 5.27 ERA is the highest of the expansion era for a left-hander in 400+ IP over the first three seasons of a career. Which expansion era southpaw has the most career IP among those, like Schoeneweis, with more career runs allowed than strikeouts?
8. Justin Speier’s four seasons with 50+ IP, 150 ERA+, but no starts or saves are the most for any pitcher. Speier’s post-season finale allowing 4+ runs in a relief outing of one-third of an inning or less is tied with five other pitchers for the worst to close out a post-season career. Which of those six pitchers took the loss in that game, while playing for the series winning team?
9. Todd Walker played 300 games for both the Cubs and Twins. Who is the only other such player? George Mitterwald
10. Ismael Valdez is one of 5 retired pitchers to play their entire careers since 1990 and compile 1000 IP through their age 25 seasons. Which one of those pitchers compiled 1000 IP after his age 25 season? Jon Garland
11. Desi Relaford played shortstop in over 95% of 300+ games through his age 26 season, but in less than 25% of 300+ games afterwards, one of only eight such players in the modern era. Who was the first player with such a career? Terry Turner
12. John Thomson made his post-season debut at age 31 as Atlanta’s game 3 starter in the 2004 NLDS, but was forced to leave the game with an injury after retiring only one batter. Who is the only older pitcher with as short a start in his post-season debut? Ray Caldwell
13. Chris Stynes is the only expansion era player with two 200 PA seasons batting .330, but only one more batting .280 or better. Stynes’ 8 GIDP in 2003 are the fewest by a Colorado third baseman in a qualified season. Which two Rockie third sackers led the NL in GIDP? Charlie Hayes, Garrett Atkins
I’ll swoop in and take an easier one. #13 is Charlie Hayes and Garrett Atkins.
#1 – I believe it was Lloyd Waner and Johnny Pesky, who each had three such seasons to start their careers. (Pesky’s seasons were 1942, 1946, and 1947, as WWII made his first three years non-consecutive).
Ichiro’s ten seasons also better Wade Boggs’ run of seven straight 200 hit seasons at any point of a career.
#6 – I had to look up to see whether it was Frank Robinson or Vada Pinson, as I figured it must be one or the other. Pinson it was, with 47 doubles as a 20-year-old in 1959.
#12: Ray Caldwell of the Indians on 10-7-1920.
#10 – Jon Garland is the other retired pitcher. However, CC Sabathia and Felix Hernandez have done it. Matt Cain finished 10 IP short of 1000. Clayton Kershaw, Madison Bumgarner, and Rick Porcello may yet do it. The biggest dropoff is Dontrelle Willis, who pitched over 200 innings like clockwork through his age-25 season, then pitched less than 200 TOTAL innings after age 25.
#12 – I have no idea who the answer is, but at least he got more time than this guy.
This guy was Robin Yount’s older brother Larry. This is the sum total of Larry’s major league career.

Appears he hurt himself making his warm-up tosses.
Appears Larry is the only player whose career got him into the box score but not into the game. No other pitchers with a single game career and no batters faced, and no batters with a single game career as a pinch-hitter and no PA (i.e. a pinch-hitter who was pinch hit for).
#3: Joe Mauer. The other 3 players are Victor Martinez, Mike Stanley and Carlos Santana.
#11 – I’m not sure of the answer, but I figured out two of the guys, in addition to Relaford. One of them is Alex Rodriguez, who’s definitely not the first to meet Doug’s qualifications.
The answer to the question COULD be Robin Yount, though I’m suspecting there’s someone earlier. He did it, for sure, played 13 of 1240 games away from short through age-26, and only 259 of 1616 at short thereafter. Can anyone go earlier? I was surprised to find that Ernie Banks played nearly 10% of his games through age-26 at third (all in one season). I had no idea.
#11: My PI search turned up only 7 of the 8 guys: Relaford, A-Rod, Yount, Jose Offerman, Julio Franco, Harvey Kuenn and Rico Petrocelli. Of those 7 Kuenn was the first.
You missed the earliest one. This guy played over 95% of his career games with the same club, though he neither began nor ended his career with them.
Is it Terry Turner? For my first PI search I just searched the modern era. Turner holds the record for most games played for the Indians.
Terry Turner is correct and, since he player for the Indians, his career was in the modern era since 1901.
Re Banks in 1957: it looks like the Cubs traded Gene Baker early on and had no one to play 3rd, so Ernie moved over for a while. A non-big leaguer named Jack Littrell came up to fill the SS spot, but was pathetic at the plate and almost as bad in the field. The whole thing looks crackpot, the more you go into it. Baker was a second baseman in prior years: the Cubs gave the 2B spot to a rookie, Casey Wise, who was terrible, so they brought over Bobby Morgan from Philly to play second, and he was almost as bad at the plate, but better in the field. From a different perspective it was a typical Cubs team of that era, insofar as it was a mix of decent to very good players and really terrible ones, the terrible ones dominating overall. My recollection is that owner Bill Wrigley, Jr., made a lot of the personnel decisions, most of them bad.
Gene Baker is the last second baseman to play every inning of every game of a season, doing so in 1955. Nine other players have also done this, including Charlie Gehringer, the only one to do it twice, and Kid Gleason, the first and oldest at age 38 in 1905.
#5: Schmidt had a differential of .210. Jesse Barnes had a W-L% of .656 for the Giants and a W-L% of .395 for the Dodgers and Braves, a differential of .261. Doug: This was really an interesting question to solve.
Barnes posted a winning record in each of his 6+ seasons with the Giants. He posted a losing record in 6 of his other 7 seasons, the exception being his debut campaign in which he won each of his 3 starts.
For #9, the only player I can think of who played for the Cubs and Twins is George Mitterwald. (I’m sure I’ll think of others after posting this…)
Mitterwald is the one. He played his entire career with just those two franchises, moving from the Twins to the Cubs in a straight trade for Randy Hundley (who later returned to Chicago to play a handful of games as Mitterwald’s backup).
Mitterwald is also noteworthy as one of only 11 players to catch 100+ games in his final season.
There may be something I don’t understand about question 8 but I found 2 players, Art Reinhart and Harry McIntire.
My mistake. I’ve altered the question slightly to distinguish the two, but you have the right answer.
Interest in the quiz seems to have died out so here are my answers to the unsolved questions.
#2: Brad Clonz in 19996
#4: Carlos Silva in 2004
#7: Terry Mulhollland
Here are the statistics I generally post for candidates, comparing WAR (total, peak, rate), ERA+/OPS+, and career length. The only 1973 birthdate player I’ve added to the holdovers is Ichiro.
Primary Ballot Candidates
Pitchers
P(Tot)WAR…Peak5..Top5…WAR/9IP…WAR/Yr….ERA+…Career length
68.5 (68.3)……37.0…37.0……0.189……4.0 (17)……127……1.0………K. Brown
66.1 (66.7)……28.7…34.7……0.171……3.9 (17)……114……1.2………Tiant
68.7 (67.4)……22.5…27.3……0.117……3.0 (23)……108……1.6………Sutton
Position Players
WAR……Pk5……Top5……WAR/G…WAR/Yr……OPS+…Career length
58.7………31.5……36.7……0.034……4.2 (14)……156………1.0………Allen
63.6………31.6……32.7……0.029……4.2 (15)……111………1.3………Ashburn
75.2………22.6……29.8……0.031……4.0 (19)……110………1.4………Dahlen
66.9………23.7……28.3……0.026……3.5 (19)……127………1.4………Evans
68.0………28.7……32.2……0.025……3.4 (20)……110………1.4………Nettles
69.2………28.7……29.9……0.030……4.1 (17)……154………1.3………Ramirez
50.1………23.3……26.4……0.024……2.6 (19)……118………1.4………Simmons
59.6………29.8….. 33.5…..0.023…….3.5 (17)…..107……….1.5……..Suzuki
70.2………28.6……31.3……0.029……4.2 (17)……105………1.3………Wallace*
* Wallace’s total WAR (incl. pitching) is 76.3.
WAR/Yr. includes only those seasons with 10 GS or 100 IP for starters, 20G for relievers, and 50G for position players.
Career length: 1.0 = K. Brown 3256.1 IP / Allen 7315 PA.
Secondary Ballot Candidates
Pitchers
P(Tot)WAR…Peak5..Top5…WAR/9IP…WAR/Yr….ERA+…Career length
67.2 (71.6)……24.2…29.0……0.145……3.6 (19)……118……1.6……….Lyons
60.9 (60.8)……20.3…28.4……0.166……3.4 (18)……117……1.0……….Pettitte
68.2 (70.1)……31.0…32.8……0.173……4.0 (17)……114……1.4……….Reuschel
Position Players
WAR……….Pk5……Top5……WAR/G…WAR/Yr……OPS+…Career length
62.8………33.0……34.0……0.031……4.5 (14)……116………1.2………..Boyer
64.4………32.4……33.7……0.025……3.4 (19)……119………1.5………..Dawson
61.4………37.4……37.4……0.027……3.8 (16)……133………1.3………..Helton
65.5………27.2……29.5……0.030……3.7 (18)……104………1.3………..Randolph
In terms of the figures I just posted, Ichiro’s career has an unusual profile, as I’m sure everyone is aware. All normal careers tail off, and the tail years swell the counting numbers and diminish the rate numbers. But in Ichiro’s case, the transition from body to tail after his age 36 season was abrupt (lowest WAR prior: 3.5; highest after: 1.6), and the tail is very, very long, perhaps destined to get longer still. That has been Ichiro’s choice — his rate numbers have taken a huge hit, but he’s grossed over $50m to ease the pain — but it’s also true that his career profile is unique not only for the seven year-long tail, but also for a dynamic seven year-long head that we do not consider: his years in Japan.
For those reasons, I thought I’d add this comparison as a supplement to my usual list of stats:
WAR…………Pk5…….Top5…….WAR/G…WAR/Yr……..OPS+…Career length
59.6………..29.8…….33.5…….0.023…….3.5 (17)……..107……….1.5………Suzuki, 2001-17
54.6………..29.8…….33.5…….0.034…….5.5 (10)……..117……….1.0………Suzuki, 2001-10
Mike Sweeney had 144 RBI in 2000, and WAR was not impressed.
Lowest WAR with 140 ribbies:
0.6 … 141 … Dante Bichette
1.8 … 146 … Ryan Howard
2.6 … 144 … Walt Dropo (1950)
2.6 … 141 … Preton Wilson
3.7 … 144 … Vern Stephens (1950)
3.8 … 144 … Juan Gone
3.8 … 141 … Howard
3.9 … 144 … SWEENEY
4.1 … 142 … Matt Willams
I’m going to expose myself as being the statistical dolt I am and asking someone to explain Vern Stephens’ numbers for me. How does one end up with a cumulative O-WAR of 45.6, a cumulative D-WAR of 9.1, but a career WAR of 45.5?
I think it’s because all of that 9.1 is all value from positional adjustment, shortstop being special.
His Rfield is -1, so for the Big number, his D is a wash.
I think Voomo’s right. If I understand it — I mean, IF I understand it — B-R double counts the positional adjustment: it is a component of both oWAR and dWAR, which are meant to give an idea of the player’s value independently (how got a hitter was he for a SS?; how good a fielder was he for a SS?). So when the two are combined to calculate WAR, Rpos has to be subtracted once. If Stephens’ Rfield was negative, then his Rpos was probably of greater value than his net dWAR (which is derived from Rfield), and so his WAR (oWAR + dWAR – Rpos) would be less than oWAR alone.
I stand in full readiness to be corrected.
Evans, Dahlen, Brown
My ballot is an easy one this time ’round:
1. Ichiro Suzuki
2. Kevin Brown
3. Luis Tiant
My usual two at the bottom, but my top spot this time goes to a player who, if we give ANY credit for pre-MLB play, Ichiro zips right to the top. I’ve got to put him there.
Ichiro in Japan:
.353 / .421 / .522 / .943
In his last year there, the league had a slash line similar to what happens here:
.264 / .343 / .406 / .749
_________________________
Between the two leagues, he now has:
4358 H
2073 R
708 SB
14,779 PA
.323 / .374 / .435 / .809
Add Pete Rose’s minor league numbers and he tallys to:
4683 H
2466 R
805 Doubles
17,453 PA
.304 / .378 / .414 / .793
Ichiro has yet to be hired as a manager in order to insert himself into the lineup whenever he feels like it. 🙂
60% of Rose’s minor league games were in Class D, the rest in Class A. So, none at all in the “high” minors.
Lots of walks in Japan, with a league-wide .343 OBP, probably on account of the cultural importance of “not losing face”, which translates on the ball diamond to walking hitters instead of giving up the big hit in a high leverage situation. The majors have had that high an OBP only twice since 1951.
Doug, this, and your point below about Ichiro’s defensive value are really interesting. I’ve read a bit about Japanese baseball, and I must have either missed the point about walks or forgotten it. .343 OPB is a pretty amazing average for a whole league.
Not to be a spoilsport, but a .343 OBP in Japan in 2000 is actually LOWER than the AL OBP was in 2000 (it was .349). So Ichiro was actually playing in a league that was WORSE at getting on base, rather than better. (Yes, 2000 was one of the most offense-oriented seasons in history; still, it puts this in perspective a little, I think.)
Yes, 2000 and 1999 were the two seasons since 1951 that the MLB OBP was higher than .343.
The AL BA that year was .276 compared to .262 in Japan, so walk rates were higher in Japan at ~10.1% of PAs compared to 9.5% in the AL. In Ichiro’s case, his walk rate in 7 seasons as a regular in Japan was 9.6% compared to just 6.2% for his first 10 seasons in MLB. Did he suddenly change his approach in the majors to become a lot less selective, or were pitchers in Japan just giving him a wider berth? My money’s on the latter.
I’m going to go ahead and vote for my usual two, plus the obvious:
Ichiro, Wallace, Dahlen
I don’t give any credit to Ichiro for his time in Japan — I don’t think that’s a can of worms I want to open, and he could have come to the US earlier — but his ten-year peak was wonderful and I don’t feel he needs more to be an easy CoG choice. He became a unique baseball institution: I tracked his hit counts every day, and I’m sure other fans did too . . . especially numbers-obsessed pre-teens, like the inner me.
About Wallace and Dahlen: I went back to last year’s CoG Round 124 discussions, and re-read a long conversation that a number of us had about evaluating old-time players, one that was initiated (of course) by Doom. Rereading that and thinking about the just-ended, rather contentious back-and-forth about Mordecai Brown leads me to propose again something I suggested last year. I think HHS needs to devote some time to 19th century ball, both so that it is better understood on its own merits, and so that the early 20th century dead-ball era isn’t regarded as the dawn of baseball civilization after its prehistoric Stone Age, but is seen in the context of the ever-evolving standards of a mature game.
Last year when this idea was raised — either as a project in its own right or as a prelude to opening a small 19th century wing to the CoG — I think there was some support for it, but we realized that some of us would have to take the lead by learning more about pre-1901 baseball and designing initial posts that would be engaging and factually sound. There was never a follow up on that, but I’d certainly volunteer — I found it really interesting to try and place Dahlen and Wallace in the context of other 1890s-1900s shortstops in a Round 125 post, and I’d enjoy devoting time to gaining more background and doing a better job in that sort of thing, so long as other HHS posters would find items built on that sort of data worth reading. Last round, Doom took the time to write an advocacy piece for Wallace over Dahlen (although he advocated neither for the CoG), and I thought it was great. (It’s in deference to Doom that I listed Wallace first in my vote this round.)
Apart from just CoG relevance, I was dismayed to read this paragraph in a recent piece by Rob Neyer, a really good baseball writer:
. . . few people care much about 19th century baseball. Who won the National League pennant in 1896? I know a lot of people who are crazy about baseball history. But while nearly all of them know the Chicago Cubs won the pennant in 1906, I’ll bet only two or three of [them] know the NL’s original Baltimore Orioles took the flag in ’96.
How can so many of the people a guy like Neyer deals with not know about the 1896 Orioles – Wee Willie Keeler, John J. McGraw, Hughie Jennings, Wilbert Robinson . . .? The mid-‘90s Orioles had an enormous impact on baseball’s development. And they played only a decade before those famous Cubs teams. For some perspective, a decade ago was 2008 . . . it’s the blink of an eye. MLB and sportswriters sold America on the idea that real baseball began in 1901, as if it sprang fully formed out of Ban Johnson’s head. But there’s no sharp dividing line in the game itself at that point.
I think it would be fun for HHS to do more exploration of that time frame — long ago for us: baseball’s present for people then. So I’m repeating here my suggestion from last year.
I’ll try to do a few posts on the 19th century, and see what sort of participation we get.
BTW, it’s not the 19th century, but P-I has recently added 5 additional years of game log data, now going back to 1908.
Thanks, Doug. I’ll keep my eye out and try not to squelch all interest with overlong posts. (Actually, that’s a lie. What I’ll really do is tell myself not to write too much and then ignore the advice.)
My secondary ballot this time is relatively easy
Lyons, Dawson, Boyer
I’ll spare everyone my usual arguments on behalf of Lyons.
Primary is another matter entirely.
Ichiro is my sticking point. It’s clear that from when he first set foot on a major league field he was already a great player. It’s also clear that for half of his career he was at best an average major leaguer. What do we do about the years he was blocked from playing in the majors by playing in Japan?
I think, based on PA, it’s more like 2/3 as very good or great (2001-10) and 1/3 below average (2011-17).
Part of the reason Ichiro has had such a long tail to his career is that he still provides value defensively, an almost unique achievement for an outfielder at his age. These are the top 10 outfielders in WAR Fielding aged 39+, bearing in mind that these numbers are calculated differently since 2002.
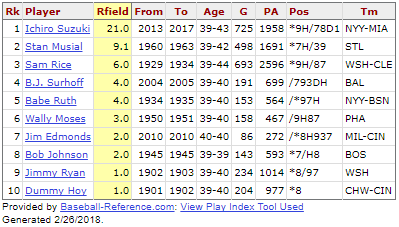
Ruth and Musial on the list should serve to remind us all that these guys were perhaps the most complete players of their times, not just batsmen.
Ted Williams’ Rfield age 39-41: -44.
Haven’t said it for a while here, but I’ll still take Musial over Williams.
I can’t let that stand without a response, aside from saying how can any baseball fan not like Stan Musial? I might need to think about it, even if it’s safe to say which I would go with.
nsb, When we were kids, and each of us had to declare for Williams or Musial, as a National League fan I always opted for Musial — and I didn’t even understand then what an SOB Williams was (nor could I know he’d only get worse as he aged). But I’m afraid I think this Rfield comparison is very unfair. If Musial’s “old-age” Rfield were calculated from age 38 instead of 39, he’d have only 2, not 9.1. And through age 38, despite their very opposite reputations (though Musial was known for his weak arm), Williams has positive Rfield and leads Musial in dWAR. Musial’s a better fielder, ages 39-42, than Williams was, ages 39-41, but their OPS+ numbers are 121 vs. 165 (for both 39-41, it’s 126 to 165). You’d need an awful lot of Rfield to overcome that gap.
I think Musial was absolutely terrific and a good guy to boot. But I’m afraid that for many years now I have felt that Williams was the better ballplayer, and the poor fielding rates for his final three seasons don’t make a dent in that. These are some comparative figures (and, of course, Williams’ shorter career was due to the loss of 5 prime seasons to the military, as opposed to one for Musial):
WAR……..,.Pk5……Top5……WAR/G…WAR/Yr……OPS+…Career length
128.1………44.7…….49.9…….0.042…….6.1 (21)……..159……….1.7………..Musial
123.1………50.4…….51.6…….0.054…….7.2 (17)……..190……….1.3………..Williams
epm:
You’re overlooking something: Musial played more than a third of his games at first base, where his Rfield suffered greatly, as in 1959, when he made 90 starts there, only six in the OF.
Arguing the fielding merits of the two is fruitless, I think, but no one ever accused Stan the Man of not going all out all the time. As a batter Williams was superior, but his statistical superiority dims somewhat in my eyes because he was so willing to take a pass, and once on base he was no speedster, not likely to go for the extra base, not likely to break up the double play, less likely to score, especially from age 30 on. Musial was far more durable and gained the respect of everyone for his devotion to the game. He had no need to announce his retirement in his mid thirties in order to wangle a lesser settlement in divorce court before reinstating himself once the suit was decided, never was fined $5000—not by the league, by the way, but by his team’s owner— for spitting at fans in the stands.
When all the stats are totaled you get a kind of line drawing of a player. When you flesh that player out with other information, reports of the time, recollections, interpretations of what the raw stats mean, etc., you get a fuller impression. Mine still puts Musial on top.
Not that I don’t feel the way you do about the relative personal merits of the two men, nsb, but I don’t think you can mix two things so unlike.
On fielding, Musial was at first because his weak arm made him an indifferent outfielder. His Rfield was low at first in 1959, but was perfectly in line with his Postwar outfield Rfield in 1955-58, when he was primarily at first. So I agree with you that arguing about fielding here is fruitless: neither man was outstanding in the field: they were both, on the whole, average.
As for batting, I think it’s odd to count Williams’ BB totals against him. You are knocking the fact that he excelled in getting on base (his OBP is number one all-time) at cost to the possibility of producing more bases through getting hits. Perhaps Musial came closer to realizing his full TB potential, but Williams exceeds him by plenty nevertheless. Williams is comfortably ahead of Musial in BA and far ahead in slugging (.634 vs. ,559). You seem to be saying you prefer Musial because Williams should have exceeded him by more.
What your argument boils down to, I think, is character, and I doubt there is a fan who would disagree with you, certainly not me. By that measure, perhaps Dave Winfield is a better player than Williams — how much character divergence equals how much disparity in quality on the field? I just don’t see this as a productive line of thinking.
In any case, my original objection was to your using old-age Rfield to claim that Musial was the more complete player. Why not just say that Williams was the better player, but that all things considered, you’d choose Musial over Williams for your team? I might too.
n s b,
I was curious about Williams and the base running comment. For the period 1901-2017, ages 31 till retirement, 3000+ plate appearances, it looks like only 19 other guys scored as frequently (Runs/PA’s) as Williams and 7 of those guys were part of the steroid era (1993 – 2006). No ax to grind either way here, no dog in the fight, but I imagine there were also a lot of times where Williams may have been lifted for a pinch hitter and never scored those runs.
I’m only 60 years old, never saw either Musial or Williams play, so I defer to people like you on this site….but, it sure sounds like Williams was a true horse’s rear end
Did you mean “lifted for a pinch runner” rather than a pinch hitter. As far as I know Williams was pinch hit for only once, by Carroll Hardy. Just for fun I checked to see how often Williams was pinch run for in 1960, his final year. If I have done my work correctly he was pinch run for 23 times, 16 as a starting player and 7 as a pinch hitter.
In 1949 he was pinch run for once, by Al Zarilla.
1949 would be age 30 – the last year prior to the effective age of the PI search. Maybe those Korean War battles eventually took something out of his legs?
If we took all the troubled ball players with questionable attitudes and/or crappy dispositions, we’d probably win 110 games every year:
Ted Williams
Rogers Hornsby
Ty Cobb
Dick Allen
Hal Chase
Jim Tabor
Billy Martin, mgr
I better stop before their relatives decide to file defamation suits
Actually, Williams was seated during those battles: he was a fighter pilot.
I think your team would win a lot of games, but not 110. As soon as the odds of their winning were well established, Chase would find a way to make sure marginal wins were converted into pocket cash.
E p m,
Hey, those cockpits are wee bit tight…just ask Tom Harmon
yes, the “pinch runner” — “famously” pinch hit for by Carroll Hardy.
Can I just make the point that Ted Williams wasn’t a total jackass? At the very least he raised a bunch of money for charity, fought for his country in two wars, and spoke up for Negro Leaguers in the Hall of Fame. I’ll go with EPM’s point, they were two different kinds of men. I would say one was a gentleman, and the other a proud, stubborn son-of-a-gun. I would still take Williams despite thinking that Musial was pretty flipping amazing, too.
Ted Williams is probably the best all-time-great who can be thought as a one-sided player. Who else is that good yet isn’t very well rounded? Gehrig, maybe?
Hub Kid,
Maybe Hornsby?
Kid, after Williams went to such lengths to persuade the world he was a jackass, year after year, I think you defame him by citing exceptions. (And there’s nothing inconsistent about being a jackass and performing kickass military service, which Williams certainly did in Korea.)
Williams is probably the best all-time-great at many things, since he is so high up on the all-time-great list that almost anyone you compare him with is not going to be “the best,” rather than Williams. But there are, I think, plenty of players we revere who have been as “one-sided”: Gehrig will work, so will Mel Ott or Jimmie Foxx. (On a less great level, compare Williams and Manny Ramirez.) Williams hit, hit for power, took walks like no one else, and had about as many doubles per PA as Musial. He played average defense at the Major League level, slipping only after age 39, and led the league in assists at his position four times over a period of a decade. Although he stole few bases, he was in the top-ten for triples four times when he was young, so he was no Ernie Lombardi. It is true, however, that he was exceptionally weak in successful sacrifice bunts.
Since the comparative greatness of Williams and Musial is so close, I guess the point I was thinking about is that at the top of the list of all time greats, the position players are all pretty well rounded players, until you get to Williams (or maybe Hornsby since there are varying accounts of his defense, although DRS etc. aren’t especially down on Hornsby); then Gehrig, Ott, Foxx, Frank Robinson and more start turning up who were more one-sided. It’s hard for a player to be one of the best all time without being pretty well-rounded, except for pitchers.
Is there something about Hit Kings that makes them want to hang on way too long?
I’m on the side that Ichiro’s Japanese career pushes him over the borderline – it doesn’t count for MLB stats, but it is pretty clear to me that if he had played in MLB instead of NPB he would have had at least a few more great years on top of 2001-2010.
Hartvig,
I’ve always tried to follow the Bill James rule of giving people credit for seasons in which they were major-league quality, but were not in MLB for reasons beyond their control (military service, segregation, etc.). i think, given the posting system and the way japan fiercely guards its players, as well as the way the US relies on Nippon baseball to serve as a minor league (to reduce the amount of scouting US teams have to do), I would argue that we should treat his last couple seasons in Japan as something akin to ML quality. You have to estimate, of course, but let’s say that he had three ML-worthy seasons, worth (respectively) 1, 3, and 5 WAR. That’s not outrageous, I think. Add 9 WAR to Ichiro’s career, and he’s a no-doubter, top of the class. That’s all the math it requires for me. Given that we let in Satchel Paige, I would say that we, as a body, collectively count performance outside MLB when a player is clearly beyond the standard of an MLB player. Ichiro’s MLB career proves that he belongs in that category, I think.
Hartvig,
Should we judge Joe Louis based on a beating at the hands of Marciano? Willie Mays with the ’73 Mets? Right or wrong, I think peak years are more indicative of the talents we are trying to compare. I believe as baseball gets closer to total elimination of steroids, there will be fewer and fewer everyday players having impressive seasons beyond age 33, regardless of training regimens. Of course, there will be the Aaron and Mays (all-time greats) types who perform well into their late 30’s, but they will be few and far between (perhaps Trout and Harper).
So I’m willing to give Suzuki a break on his last 5-6 years
Allen, Nettles, Ichiro & Pettitte, Dawson, Randolph
Secondary Vote:
Todd Helton
Andy Pettitte
Willie Randolph
Disclaimer: This is a purely strategic vote. I want Randolph, so I’m giving my other 2 votes to guys with no shot.
Primary ballot:
Ichiro
Wallace
Dahlen
Ichiro was a star player in Japan for 7 years prior to his first hit in the majors – at age 27! Despite such a late start, he reached 2600 hits at age 38 – 12 years averaging 216 hits/yr. The climb to 3000 hits in the majors took 4 more years, and last year at age 43 it looked obvious the batting was falling off. Even so, 4300+ hits in the 2 leagues is a lot of production. Is there anyone besides Rose that hit more at a high level? .312 career BA, 509 SB. Such numbers put Suzuki at COG level for me.
Wallace and Dahlen are no surprise, stumped for them before. Certainly feel that their numbers are being discounted by some because of doubts about early defensive stats – they would benefit from further examination of their era and contemporaries.
Secondary ballot:
Dawson
Helton
Pettitte
I like Hawk to move up, others are lukewarm (Helton & Pettitte in right place/right time). Boyer had solid peak, but dropped off steeply after age 33 – needed a couple more good years. Randolph and Reuschel valuable, but to me seem Hall of Very Good. Lyons likely would be closer to 300 wins if he was on better teams, probably Jim Kaat/Tommy John numbers if not for WWII. Most similar to Grimes/Faber/Rixey – does not scream COG to me either.
Guys I’d Love To See Redeemed:
1. Joe “Iron Man” McGinnity (246-142, 57.7 WAR, 10 yrs 1899-1908, 2.66 ERA, 120 ERA+, 3441 IP, often pitched both games of doubleheaders, won 240 MORE games in the minors, pitched to age 54, dominant pitcher in his time – read his SABR bio!)
2. Eckersley (197-171, 63.0 WAR, 390 SV, 3.50 ERA, 116 ERA+, revolutionized relief role in his era just as much as Wilhelm did)
3. Palmeiro (3020 H, 71.6 WAR, 569 HR, 132 OPS+, ironic we almost put Manny in the COG last week with 2 PED suspensions)
4. Fred Clarke (2678 H, 67.8 WAR, 21 yrs 1894-1915, .312 BA, 509 SB, funny last 2 stats exactly match Ichiro – Fred averaged 193 H/yr but was born in 1872 and dropped from ballot quickly, highly successful player/manager – read his SABR bio!)
Appreciate the Redeemer section, Dave. McGinnity and Clarke are players who, I think, dropped off the ballot at a time when the competition was a bit tougher. As we broaden the Circle, guys who may have justifiably fallen short when the company was more exclusive certainly deserve a second look. I don’t recall and may not have been participating when Eck dropped off the ballot, but I agree that he has serious credentials, especially since his relief role is complemented by a solid (though not in itself CoGworthy) starter’s profile.
I hope we continue to have redemption rounds before the annual CoG votes. In fact, I think a warm-up discussion to identify redemption candidates and assess them against ballot holdovers could put us in a good position to start CoG voting with the issues fresh in our minds.
Fred Clarke’s 1902 Pirates.
This team, hardly ever cited now, was probably the most dominant team in baseball history. In a 140 game season it finished 27.5 games in front of the second place Brooklyns, outscoring its opponents by 334 runs. It’s win % in AWAY games was .691. It scored an average of 1.0 runs per game more than its nearest competitor and allowed 0.4 runs less. In WAR by position, the Pirates nearly ran the table, finishing first in seven positions and tied for first in one. Catching was its only weak spot.
It’s nominal starting outfield of Clarke, Ginger Beaumont, and Honus Wagner—a utility player until the 1903 season when he settled into the SS role—had these OPS+ numbers: 159, 151, 162. They finished 1-2-3 in runs scored, even though Clarke played in just 113 games, and Pirate 3rd baseman Tommy Leach finished 4th. Beaumont led the league in hits and BA. Wagner led in runs, doubles, RBIs, SBs, SLG, OPS, and OPS+. Leach led in triples and HRs.
The Pirate pitching staff, while not as dominant as individuals, nevertheless placed its top three starters—Jack Chesbro, Deacon Phillippe, and Jesse Tannehill—in the league’s top ten in most categories. The other starters, Sam Leever and Ed Doheny, also fared well. The five started 134 of the team’s contests and accumulated 125 complete games. As an interesting aside, Chesbro is the only one of them who made the HOF, thanks to his great 1904 season with the Highlanders, but career-wise?
Chesbro: 198-132, 41.4 WAR
Phillippe: 189-109, 34.2 WAR
Tannehill: 197-117, 48.7 WAR
Leever: 194-100, 41.3 WAR
Chesbro had the misfortune to end his career on bad teams, while the other three played on mainly good ones.
Another interesting aside: Honus Wagner pitched 5.1 innings of relief in one pitching appearance, allowing 2 unearned runs and striking out 5.
The period 1901-2 was one of total upheaval for most of the NL. The league had contracted from 12 teams to 8 in 1900, and part of that involved the consolidation of rosters on multiple teams that shared overlapping ownership consortia. The most successful of these was the Louisville Colonel / Pittsburgh Pirate consolidation, manipulated by Barney Dreyfuss. Dreyfuss transferred Wager, Clarke, Leach, and Phillippe, among others, to Pittsburgh, which was strong in pitching, with Leever, Tannehill, and Chesbro.
Then, as a relatively generous “players’ owner,” Dreyfuss was in a strong position to weather the new AL raids on the established NL, preserving his roster relatively intact, while other teams who were raided had to dilute their rosters with new recruits, since the expansion to 16 teams lowered the standard for replacement level talent. Hence the 1902 season (which was bracketed by Pirate pennants on either side).
The only personnel loss in this transition was Rube Waddell, who came over from Louisville, but whom Clarke, as manager, couldn’t handle. The Pirates unloaded Waddell in 1901 — imagine what 1902 would have looked like if Rube had been part of that staff, instead of helping Connie Mack win the AL pennant by going 24-7 with a 178 ERA+!
Dreyfuss was a key to ending the inter-league war in 1903 and setting up the new peace symbol: the World Series. When the Pirates won the pennant that year, Dreyfuss took the entire Pittsburgh share of the gate and gave it to his players. (The other owners would have none of that, and when the Series resumed in ’05, after the Giants’ boycott in ’04, new rules, demanded by the tighter-fisted Giants owner, John T. Brush, set limits to player shares.)
Primary ballot: Suzuki, Tiant, Wallace
Secondary ballot: Dawson, Boyer, Lyons
Primary:
Ichiro Suzuki
Kevin Brown
Graig Nettles
Secondary:
Andre Dawson
Ken Boyer
Todd Helton
For the secondary ballot, my vote is:
Lyons, Boyer, Reuschel
I’ve never voted for Reuschel and feel his WAR is, somehow, an illusion, weighting ancillary factors to a degree that seems in conflict with the reality I remember. But I actually don’t trust that feeling: it’s basically irrational. Every time I look at Reuschel’s straight record I see less-than-CoGworthiness, but I need to go back and rethink. Seeing that Reuschel has zero support in the early voting while everyone else has at least two votes, I want to make sure he stays on the ballot while I revisit his case over the coming year, hence my vote for him over my actual third choice, Dawson.
Last round I did a detailed comparison of Dawson and Evans, who seemed like statistical fraternal twins — there are clear differences, but taken overall they’re really hard to tell apart — and I came down slightly preferring Dawson. I still do, but I’m not sure it would be productive to have both Dawson and Evans on the same CoG ballot, as they seem likely to perpetually split the same vote. I’d rather give Evans a shot alone for a few rounds first, even though I don’t expect to vote for him any time soon. All of which opens the door to Reuschel for me.
Secondary:
Rick Reuschel
Todd Helton
Ken Boyer
Primary: Manny, Ichiro, Brown
Secondary: Boyer, Randolph, Dawson
Main Ballot vote:
Manny
Evans
Sutton
Main vote: Ichiro Suzuki, Luis Tiant, Dwight Evans
Secondary: Ted Lyons, Ken Boyer, Andy Pettitte
Main vote: Allen, Ichiro, Ramirez
Secondary vote: Dawson, Lyons, Helton
This does little to clarify the situation, but I did the math, so….
Plate Appearances per Win Above Average (PaWaa):
222.3 … Allen
262.8 … Dahlen
274.6 … Manny
277.8 … Wallace
311.8 … Nettles
322.2 … Evans
342.8 … Ashburn
439.5 … Ichiro
515.2 … Simmons
____
PaWaa through the first 8000 PA of career:
222.3 … Allen (7315)
229.7 … Wallace
236.8 … Dahlen
239.5 … Manny
245.4 … Nettles
264.8 … Evans
280.8 … Ichiro
294.7 … Ashburn
307.8 … Simmons
For context, here are the all-time leaders in the stat:
84.4 … (10622) Babe Ruth
97.2 … (9480) Rogers Hornsby
97.7 … (4065) Mike Trout*
102.1 … (12606) Barry Bonds
104.0 … (9788) Ted Williams
113.5 … (12496) Willie Mays
123.1 … (9663) Lou Gehrig
125.7 … (9907) Mickey Mantle
127.7 … (11748) Honus Wagner
128.5 … (13084) Ty Cobb
….
PaWaa 8000
79.1 … Babe Ruth
93.7 … Rogers Hornsby
96.1 … Ted Wiliams
101.5 … Willie Mays
103.9 … Ty Cobb
108.6 … Mickey Mantle
109.2 … Barry Bonds
109.2 … Honus Wagner
115.4 … Lou Gehrig
121.0 … Stan Musial
We have 11 votes for both ballots so far (though the voters are a little different), so here’s an initial 128th Round update:
Primary Ballot
9 – Ichiro Suzuki*
=================50% (6)
4 – Kevin Brown
3 – Bill Dahlen, Dwight Evans*, Manny Ramirez, Luis Tiant, Bobby Wallace
=================25% (3)
2 – Dick Allen, Graig Nettles
=================10% (2)
1 – Don Sutton*,
Richie Ashburn and Ted Simmons have not recorded votes yet.
Voters: Jeff Harris, Doom, epm, dr. remulak, Dave Humbert, Scary Tuna, Andy, JEV, Chris C, Hub Kid, Richard Chester
Secondary Ballot
7 – Andre Dawson, Ken Boyer
5 – Todd Helton, Ted Lyons
4 – Andy Pettitte
3 –Willie Randolph
2 – Rick Reuschel
====================10% (2)
Voters: Hartvig, dr. remulak, Voomo, Dave Humbert, Scary Tuna, Andy, epm, Doom, JEV, Hub Kid, Richard Chester
As always, please let me know if you spot an error.
OK, I’ve been sold on Ichiro.
I’m leaving Tiant off my ballot for the moment because he looks safe but not in a position to earn induction.
Ichiro, Nettles, Ashburn.
Primary ballot:
Ichiro
Dahlen
Tiant
Secondary
Wallace
Evans
Dawson
Hi robbs — good to have you back! On your ballot, the primary ballot is fine, but there’s a problem with the secondary ballot because Wallace and Evans are only on the primary ballot, and not eligible to receive secondary ballot votes. As it stands, your secondary ballot isn’t valid for tabulating — did you want to re-cast it for three of the seven candidates listed on the secondary ballot?
(The secondary ballot is a new addition to CoG voting — the rules are a little complicated but Doug lays everything out in his cover post.)
Haven’t posted in a while. Great to be back with the High Heat Gang.
Ichiro, Wallace, Ashburn for primary. Once again, not voting secondary.
Ichiro is the oddest candidate–at this point he has 17 years in, so you can’t say he had a short career, and that does call into question his cumulative totals. That said, I’m going to say Ichiro was “feared” and call it a day.
Primary: Ramirez, Wallace, Evans
Secondary: Randolph, Reuschel, Helton
Allen, Dahlen, Tiant
Boyer, Lyons, Reuschel
Not a lot of ISO in that Ichiro slash line; didn’t really take a walk much, either. Some similarity to George Sisler?
Looking purely at BA and OBP, the guys in Ichiro’s ballpark are:
Freddie Lindstrom
Bing Miller
Kirby Puckett
Lloyd Waner
Roberto Clemente
Baby Doll Jacobsen
Johnny Hodapp
Lew Fonseca
Irish Meusel
Waner, Hodapp, and Fonseca all had a similar SLG
Little Poison, with his string of 200 hit seasons, longer career, and position, is probably a closer comp than the other two. Though he did not steal bases and is not statistically credited with great D.
I can’t find any close comp to Suzuki’s skills and stats.
Yes, it’s not George Sisler – a 155 OPS+ through age 29 when his eyes went bad due to a sinus infection (or something like that).
Ichiro is definitely a unique case. Great defender, great arm, great base stealer, certainly hit for average. That running out of the batter’s box as you’re swinging thing kind of puts the kibosh on power hitting. It’s a shame he didn’t get here as a teenager and we might have seen him as a CF from age 21 or 22 in the majors
1st 10 years in the league, maybe most similar is Cecil Travis?
Suzuki 117 OPS+ .331/.376/.430
Travis 113 OPS+ .326/.380/.435
Beyond that, Sam Rice is very similar from age 30 – 39 or 40 to Ichiro’s age 27-36 seasons. For a career, he’s also the most similar overall, per baseball-reference
The Travis/Suzuki comparison is close for rate stats, but in terms of value: Travis: 4675 PA; Suzuki: 7339 PA. That’s 57% more PA for Suzuki, and he generates 80% more WAR. That does not seem to me very much of a similarity overall.
(Travis, of course, was on track for the Hall before his extensive combat service in World War II left him with injuries that he could not overcome.)
Rice, in the HoF via the Veterans Committee, has a similar slash line to Ichiro for the seasons you indicate, but Suzuki generated 50% more WAR in his ten-year peak. (As I see it, B-R lists Rice as tenth most similar to Ichiro, and Ichiro isn’t on Rice’s list. Ichiro’s closest comparitor on similarity score is Rod Carew.)
Travis is a similar hitter-very little power and didn’t walk frequently. I believe OPS+ to be an excellent measure of a hitter’s strength. Seems like there are an awful lot of RFers who “tagged” the ball with more authority than Suzuki. He is a first ballot HOFer on the basis of all those singles and the automatic free pass of 3000 hits. But, is he as good as Reggie Smith?
Paul, what do you mean by “as good as?” Smith produced slightly more WAR over a 17-year career, but did not have a ten-year stretch like Ichiro. Smith’s a different kind of hitter with a much higher OPS+, so if by “as good as” you mean OPS+, Smith’s a better player. But Smith didn’t have Ichiro’s speed to add bases on the basepaths, and his fielding numbers are less impressive.
Compare Smith and Suzuki from age 27 on: Smith has an even bigger OPS+ advantage, but he’s not in Suzuki’s league when it comes to WAR (39.4 / 56.4): his oWAR is 20% lower, largely because he only has two-thirds the PA Ichiro has, and his dWAR is in negative territory. If “as good as” still just means OPS+, Ichiro is still not as good as Smith — but, obviously, in this comparison, using Suzuki’s career as the governing framework, it’s hard to argue that he’s not, in fact, much better than Smith.
Smith age 21-26 was a fine player: his OPS+ is 125 and he generates (excluding his cup-of-coffee year) about 5 WAR/yr. — the last two of those years are the best part of his 5-year peak. Any CoG case for Smith would absolutely need those seasons. Meanwhile, Suzuki’s AWOL — he’s just not there for comparison (at least for me, since I don’t count his play in Japan), and that time is not a part of his CoG case. When he does arrive, he produces 5+ WAR/yr. over the course of a decade. How remarkable is it that a singles hitter could produce for so long at a rate that was about peak value for a guy like Smith, who hit for average while popping HRs at almost four times the rate of Suzuki?
It’s no knock on Smith that he compiled a very fine record over a normal MLB career curve, and if OPS+ is the only dimension that matters — or total WAR, for that matter — we should put Smith in the Circle before Ichiro. But I think we’d be wearing blinders if we narrowed our comparison to those dimensions and didn’t recognize that Ichiro’s career is, in fact, not particularly comparable to anyone else’s, and will always suffer if it reduced to a framework that fits other players but does not fit him.
“What do I mean as good as”?
How about a better hitter (more power and a better batting eye) and just as much career WAR in 650 less games and 2,500 fewer plate appearances?
Years ago the Phillies had a 3-tool player, Jerry Martin, who could run, throw, and field. His teammate, Greg Luzinski,could merely hit for average and hit for power. Luzinski could not:
1) run
2) field
3) throw
That did not make Jerry Martin a better ball player than Luzinski.
Paul, “More power and a better batting eye” seems to me to be another way of saying “higher OPS+.”
Compare Suzuki’s ten-year prime to Smith’s at the same ages. Not only is Suzuki far ahead in total WAR, in part because he played every day while Smith had some trouble staying in the line-up, but over that decade, Suzuki’s WAR/100G rate was 3.44 to Smith’s 3.29. (If you add in age 37, Smith’s last year and Ichiro’s first poor one, Smith will edge out Suzuki on rate, but that total WAR disparity is still huge in Suzuki’s favor.)
If Jerry Martin had generated significantly more WAR than Luzinski, both in total value and in rate terms, over a ten-year stretch, would you still consider Luzinski a better player because his OPS+ was higher?
I consider Reggie Smith a better ballplayer than Suzuki because the damage he did at the plate was greater than all of Suzuki’s contributions. Smith was a more feared opponent, cannon arm, adequate fielder. No, he didn’t steal bases like Juan Pierre, but then he ran more than adequately. In their peaks, their respective peaks, Smith was a better ballplayer. Perhaps that’s by the eye test – you know, you’re watching on television and the batter’s at the plate, the television camera isn’t focused on the RFer doing cartwheels, it’s focused on the batter.
6.46 RC/27 1,588 Gs 7,339 PAs Suzuki’s peak 10 season AIR adjusted
6.72 RC/27 1,987 Gs 8.051 PAs Smith’s entire career adjusted for AIR
7.16 RC/27 Smith ages 24 – 33 adjusted for AIR
While Ichiro was feasting on 5’11” RH’ers throwing 88 MPH fastballs, Reggie was playing with the big boys in America. The above numbers also include Smith’s decline and represent Suzuki’s best accomplishments here. As far as the Japanese Pacific and Nippon leagues, didn’t Tuffy Rhodes hit 50 homers over there? I digress….
Suzuki is a first ballot Hall of Famer with the magical 3,000 hits. That’s the way it works. Smith won’t ever sniff the Hall of Fame since he didn’t come close to any of the magical numbers – 500 HRs
3,000 H , no batting average titles…..he’ll need a ticket to get into Cooperstown – just like me and you.
I would say, and maybe you would disagree, that the most critical thing, the primary thing a corner outfielder should do is hit. Every game, you catch 2 balls (if you’re real good), but you get 4 PA’s to inflict the greater damage on your opponent and do more to help your teammates.
Re “”””If Jerry Martin had generated significantly more WAR than Luzinski, both in total value and in rate terms, over a ten-year stretch, would you still consider Luzinski a better player because his OPS+ was higher?””””
You have selected both Suzuki and Smith’s age 27-36 seasons. But, Smith was an everyday major leaguer at 22. Not many ML’ers were significant contributors in their 34-retirement seasons in the 1960’s and 1970’s. Training was limited, medical procedures were ‘primitive’, players often had off-season jobs…. During HIS peak, Smith was the better ballplayer.
You bet: Smith was a far better MLB player at ages 22-26 than Suzuki — Suzuki might as well have been working in Starbucks (I don’t know why you invoked the Japanese leagues, since I specifically excluded them from Suzuki’s case). Suzuki also has better medical options than Smith post-age 33, and perhaps that made a difference (though if conditions were “primative” in 1979-82, I wonder what they were through most of baseball history).
Your comparisons, whether OPS+ or RC/27/AIR, elevate a major part of play to the whole of play. I don’t see a ten-year WAR peak for Smith that comes up to Suzuki’s — I can’t find an eleven-year peak that does — but I understand you don’t see some things WAR counts as essential to the issue. If the measure of player quality is going to be hitting and hitting alone, and we’re going to assume that there’s no disparity introduced by the fact that Smith’s record begins at 22 and Suzuki’s at 27, you and I have no disagreement: Smith wins.
I see things in a different light, as I’ve described, but there’s no point arguing over apples and oranges; it’s a matter of taste.
?? “primative”? — how come spell check never helps me out?
e p m
They’re corner OF’ers. I think the “major part of play” is far more significant in weighing contributions. But, I understand your support of Suzuki. Probably a bad example but, Keith Hernandez could field and throw like no other 1B in my lifetime. He also ran better than Frank Thomas. I’ll take Frank Thomas.
So, maybe it’s something as oversimplified in my thinking as that.
FWIW, perhaps these two guys might provide some insight into what if Ichiro had been born in America and played MLB after a couple of years at Stanford or USC:
.295/.351/.413 110 OPS+ Rose age 22-26
.309/.357/.404 117 OPS+ Carew age 21-26
630ab 91r 190h 29 2B 8 3B 8 HR’s 50 BB 258 Total Bases (The 11 seasons blended into 162 games)
Of course I agree that the major part of play is more significant, Paul. I just don’t agree that fielding and base running are insignificant.
Hernandez doesn’t match Thomas because the offensive disparity on the “major part” is too great to be overcome by disparities in the other direction in the “minor part,” just like Jerry Martin and Greg Luzinski. WAR indicates that is not the case when you consider peak-Smith and peak-Suzuki, which is why those comparisons seem to me irrelevant to this case.
However, if you cash out Suzuki’s non-hitting strengths as zero value, you reduce Suzuki more than you reduce Smith and he loses his edge. If those are your ground rules, I have to agree you reach the appropriate conclusion. We have no disagreement on that.
I don’t think we should be speculating about Ichiro 22-26, as an American or otherwise. He was not in MLB when he could have been, and in my view that’s all there is to it as far as his statistical case is concerned.
E p m,
Sorry for the whole back and forth on this. I have lost my faith, mea culpa, in dWAR and how it is, I believe, an overstatement of defensive skills and those skills influence on winning. We’re taking WAR as gospel, and if we were to use Win Shares on these two guys it’s a different picture:
8,050 PAs 326.7 WS Smith career
8,483 PAs 271.9 WS Ichiro Seattle
I dunno. I don’t buy Larry Walker due to Colorado effect, I question the Ichiro worship due to the calculation (and overestimation IMO) of the dWAR and defensive contribution in general.
Well, Paul, there’s a lot to be said for Win Shares. But it does have the problem of limiting players according to the actual W-L record of their teams, since players can only share in a team’s actual wins each season (or actual wins x 3).
In the comparison you make, there’s a sharp disparity in the wins available for Smith and Ichiro to share, During Suzuki’s years in Seattle, the team went 916-963 (.487), while Smith’s teams, excepting his cup-of-coffee 6 games in ’66, went 1373-1154 (.543). Ichiro played in 98% of Seattle’s games and Smith in only 79% of his teams’ games. That comes out to Ichiro having a share in 899 wins and Smith in 1080 — Smith has 20% more wins to share in. (I can’t say I remember how James handles this in terms of PA — I do know that the calculation I’m making does not follow what James does, endlessly, in Win Shares, but I don’t have time to relearn the system . . . Ok, I have the time, but in my mature years I have become far more proficient at forgetting than re-learning, and I believe each of us should treasure and nurture his or her own unique strengths.)
Suzuki was remarkably consistent in the first ten years of his 11+ year stint with the M’s, yet the team varied between .716 and .389. It’s hard to see the justification in tying the quality of Suzuki’s play to the fortunes of the team as Win Shares does. (in Ichiro’s top season, 2004, which earns 9.1 WAR under the B-R system, the M’s won all of 63 games for Ichiro to have a “share” of — James’ philosophy may make sense in the grand scheme, but it does fail to do justice to seasons like that.) Smith was a lot more fortunate in his teams, which were far more consistent and successful overall: he spent only 1.5 of 16 seasons on teams that finished under .500(!).
So in terms of this kind of comparison, Win Shares places Suzuki at a considerable disadvantage, and the result we see may reflect no more than the bias of the system. Of course, your point is that this is true, in reverse, for WAR, but I’m not sure why you think so. Is there a specific error you see in the values dWAR gives to defense (all positions, or just some), or just a feeling that fielding isn’t that important?
By the way, where did you get the Win Share figures for Suzuki and Smith? I’m not a member of Bill James Online, so I can’t get into the stats section to see whether that’s where you found them . . .
“Baseball Gauge” still provides Win Shares. I also check out Baseball Prospectus for other “stats” of interest.
I think if a team is “putrid”, your best player will probably takes the lions share (NPI) of the Win Shares…..but I’m not certain. A good example might be Dick Allen who played on some pretty good teams from 64-67, some bad teams from 68-70, and pretty good teams from 71-74 as probably the best player on each team. For those years he averaged +/- 33 WS/162 games.
But, yeah, I have a tough time with the evaluation of defensive play, its weighting, and its numerical interpretation by dWAR and that interpretation’s ultimate impact on WAR
Thanks for the reference, Paul. I haven’t used Baseball Gauge in a long time and it dropped off my “favorites” bar — looking it over, I think I should use it more, and now I can track down what you’re referring to.
Presumably, the team’s best player always takes the lion’s share of Win Shares; it’s just that with a very bad team there are few shares for the lion. Look at Ichiro in 2001, when the M’s won 116 games, and 2004, when the M’s won 63. His ’04 season is judged to be 18% better by WAR, which ignores team wins, and 19% worse by Win Shares. That part of the Win Shares system seems to me to limit its usefulness (although it still provides an important conceptual stat). Ichiro’s OPS+ and dWAR are both higher in 2004 — I just don’t see how you can say he was about 20% less productive: it is simply untrue. (Of course, James wasn’t trying to say that about Win Shares: he would have said Ichiro was 20% less productive in helping to generate actual team wins, and that other kinds of productivity are not the issue.)
In terms of Ichiro’s career with the M’s, this effect will be a small negative one, because overall the M’s fell just slightly short of .500. But when you compare him with a player like Smith, who shares in great riches of wins . . . well, I think Win Shares simply isn’t the place to go for such comparisons because the playing field can become so tilted: 20% in this case. In my view, that’s just not what Win Shares should be used for now that we have sabermetric frameworks that allow us to evaluate what the individual player has done, independent of what his teammates have done.
(I suppose I should add a disclaimer, of sorts, since in the case of Mordecai Brown just a couple of weeks ago I attacked the adequacy of WAR assessments of defense: specifically, the way WAR sorted defense between pitchers and fielders. However, the primary issue there was precisely that B-R sorted defense based on the team’s season performance, rather than on data reflecting the individual player’s case, resembling Win Shares in that one respect more than dWAR.)
I think everyone has a tough time with the interpretation of defensive play, but I’m not sure why the dWAR system would be inferior on defense to, say, Win Shares, nor why there should be any assumption that it overstates defensive value.
I guess I’d like to add one more point that I’ve kind of shelved while we had this back-and-forth, but which is on my mind. It concerns Ichiro’s role as an outfielder, and particularly as a right fielder.
Ichiro has a strong arm. Good outfield arms are measured by assists, and Ichiro has a high number of those. But I think the largest component of value of a good outfield arm isn’t really baserunner kills, which are pretty rare, it’s that base runners don’t run on good arms. How many times a game this makes a difference isn’t something stats track, since it is a non-event, but I would guess that an outfielder known for his arm probably saves the defense an average of 2-3 bases a game by inhibiting runners from taking a base they would gain without incident if the outfielder was known to have an average arm. And it is generally the right fielder whose arm is most valuable in this regard, since runners going from first on routine singles will be much more likely to go for third on balls hit to right than on balls hit elsewhere, unless they know an exceptional arm in right can overcome the added distance on the throw.
This is all invisible, of course: these are the cases where the outfielder does not throw out the runner; he simply throws the ball back in and, if there is no putout or assist, leaves no statistical record whatever. In fact, this effect acts to diminish the statistical accomplishments of outfielders with good arms, since they wind up having fewer opportunities for assists, and thus likely fewer assists than otherwise. But bases saved in this way, simply by prior demonstrations of skill, should be as valuable to defense as stolen bases would be on offense.
This is not an argument about Suzuki vs. Smith — Smith also had a terrific arm — nor does it concern which system best measures defensive value, since no system tracks this effect statistically. But it does relate to the value that a good right fielder can add through defense and hence to the issue of how we balance the value of offense and defense in assessing player performance.
Your estimate of 2-3 bases per game is so far off, it isn’t funny. RF’s average about 2 catches per game, and field about 2 hits per game. On most of those the fielder is not relevant to the number of bases taken. Most hits come with no one on base. And the arm potential of the RF doesn’t affect the majority of plays with a baserunner on. 2-3 bases a week maybe, but not close to that per game.
I agree with you, kds. I reflected on it afterwards and realized what an overstatement it was, but figured I’d let Paul point it out. You got there first (although I disagree with you: I thought the overestimate was kind of funny). I’m happy to go with 2 cases a week, or perhaps about 50 bases saved a season, which is more than enough to be significant.
EPM,
You wrote, “His ’04 season is judged to be 18% better by WAR, which ignores team wins, and 19% worse by Win Shares. That part of the Win Shares system seems to me to limit its usefulness ”
However, the part of Suzuki’s play that is responsible for the higher WAR in 2004 (9.1 – 7.7) is his dWAR (2.4 – 0.9) since oWAR is equal at 6.1 in both years. Perhaps someone can explain how he has equal oWAR for 2001 and 2004 when he created more runs in ’04 (137 – 127) and took more PA’s in ’04 (762-738) while he had a higher OPS+ (130 – 126)? Suzuki even created more runs per 27 outs in 2004 (7.38 – 7.06).
Don’t you find it strange that the top 3 seasons of all time in dWAR for RF’ers have occurred in the last 4 seasons? dWAR (IMO) is just too subjective….whoever is doing the calculating is throwing around brass name tags (“greatest since Ozzie”, “greatest since Clemente”) like they’re attending some corporate Fortune 50 love fest for a bunch of fast-trackers.
Paul, All I see in your analysis of Suzuki’s 2001/2004 comparison is a critique of oWAR, suggesting that Suzuki’s WAR rating should be higher in that respect. I agree that with his OPS+ bumped up four points, I’d expect at least an increment of 0.1 in oWAR. I have no idea why it didn’t. But what has that to do with the appropriateness of his sharp decline under the Win Shares system, and what does it have to do with his 1.5 rise in dWAR, which you criticize by questioning dWAR in general ways? Why have you brought fielding stats into this at all, when your analysis is that Ichiro was not credited for incrementally improved offense — and why do you assume that if oWAR is understating Suzuki’s accomplishments, dWAR must be overstating them?
Looking at Suzuki’s fielding stats in 2001/2004, the sole negative change is that Suzuki had 3 errors in 2004 as opposed to 1 in 2001, but about everything else is up — more innings, more chances (by about 13%), his range factor is way up, he had 12 assists. Look at Rtot and Rdrs: those are two different outfits using two very different methodologies, and although there’s no Rdrs for 2001 to compare with 2004, the +30 rating in 2004 was 8 points higher than the Rdrs rating of any other outfielder, regardless of outfield position. In the first edition of The Fielding Bible, which assessed players through 2005, John Dewan (the person who oversees the Rdrs rating process) said, “Ichiro is probably the finest defensive player in the game,” even while noting that his play had fallen off from 2004. If you read the methodology used by Baseball Info Solutions to arrive at Rdrs (which data they make their company’s profit off of by selling it to MLB teams, who think it’s worth more than brass name tags), I think you may alter your view of at least that component of dWAR. And I wonder whether you think it’s the people at Retrosheet or Sean Smith, who relies on their data to calculate Rtot, who is tossing around the brass.
Look, everyone is skeptical about defensive stats: that’s why there is so much new work being done on them. But just to write off contemporary defensive stats as subjective doesn’t seem to me to be well informed. What does seem subjective to me is to make a blanket assumption that the value of defense is overstated, and to claim that defensive ratings of individual players are being arbitrarily determined.
As for the rise in peak dWAR among right fielders in recent years, I don’t know the reason — I’m guessing you’re talking about Mookie Betts and Jason Heyward’s 2014 season (I don’t know where you found a listing of RF dWAR season rankings, so I can’t be sure). But, again, I’m seeing similar high numbers from both Rtot and Rdrs, so multiple data sets are in agreement, and I see no reason to assume that there is a subjective cause. There may be a systemic change in the game that led to these results, the way that the rise in infield shifts skewed defensive stats till the cause was recognized and, if I recall, adjustments made. But it may also be that Heyward just had a great defensive season and Betts is just that good.
So here’s the thing: Win Shares says the quality of Suzuki’s productivity declined 19% in 2004 compared to 2001. You’ve argued that his offense improved but wasn’t adequately reflected in oWAR, and that you’re skeptical that his defense improved as much as dWAR indicates — although a glance at his raw defensive stats should make it obvious that the net change had to be positive to some degree. But you still seem to be holding to the position that an assessment of 19% decline is the statistic we should rely on. I can’t see the argument.
epm,
“But what has that to do with the appropriateness of his sharp decline under the Win Shares system, and what does it have to do with his 1.5 rise in dWAR, which you criticize by questioning dWAR in general ways?”
Obviously, oWAR is flawed, dWAR is subjective, yet we quote WAR as if it’s gospel. So, why not Win Shares? Or, for that matter, per Baseball Prospectus:
VORP 522.4 WARP 68.8 FRAA 103.3 Smith, Reginald career 8050 PA’s
VORP 410.5 WARP 49.3 FRAA 81.6 Ichiro Suzuki 2001 – 2011 peak Seattle years
So, basically, Win Shares and Baseball Prospectus prefer Smith over Suzuki. Per Baseball Prospectus, True Average for Smith’s entire career is .306 . Ichiro has two SEASONS (2001, 2004) at .303 (which may explain the coincidental oWARs of 6.1) and no other seasons above .300 . I didn’t do the math, but Ichiro is probably at around .290 for those peak 10 seasons. So, why should we believe WAR to be the be-all and end-all statistic of reference when we have two systems contradicting WAR’s findings
Paul, I don’t know what constitutes “gospel” for you, but for me, citing an advanced stat does not constitute quoting it as gospel. As I’m sure you’re aware, many of the people who contribute to HHS, including me, have pointed to shortcomings in WAR, both bWAR and fWAR (for example, I’ve certainly explained at too great a length why I don’t see FanGraphs’ pitching WAR a valid approach). For offense I regularly cite OPS+ as a balance to oWAR, and have begun using your suggestion of looking at RC/27/AIR as well.
There is, however, a clear reason why WAR is preferable to Win Shares in the case of CoG assessments: Win Shares is not assessing player performance — it’s not designed to do that — it addresses a narrowly framed question: “How did the player’s performance contribute to the actual wins that his teams earned?” Performance in losses doesn’t count (or, more accurately, performance is credited so that, on average, performance in losses doesn’t count). If you want to apply that question to CoG assessments, it’s your privilege; I don’t think that’s what others are doing — naturally your viewpoint would be different in that case and it would be clear why. But I think that simply to say that because WAR isn’t perfect it’s equally valid to use Win Shares is not a logical claim.
Win Shares shows Ichiro as 19% less productive in 2004 than 2001, and I don’t think you have explained why you think this is reasonable. What you’ve said instead is that oWAR is flawed because it shows no rise in Ichiro’s number, and that dWAR is subjective. I agreed that I’d expect to see a small rise in oWAR, on the order of 0.1, given a 4 point difference in OPS+; however, that level of difference is small enough that the issue may simply be that rounding to one decimal eliminated a slightly smaller difference. The much more significant disparity in defense that dWAR shows is consistent with two other, mutually independent sources: Rtot and Rfield. You dismiss dWAR as subjective. There will always be some subjectivity in any useful defensive stat — that does not mean that all defensive stats are equally subjective, or that they are random or invalid. All these systems offer transparent forms of data and interpretive formulas: when there’s no time or ability to assess them, the default is generally to go with the consensus choice, which is what most of us do in using dWAR. I think choosing a different system can certainly be justified on the basis of an argument about its superiority, but I also think there does needs to be some supporting argument.
Which leads us to WARP. In the case of WARP, it looks to me as though you have an interesting challenge. I’m not familiar with the system — I just reviewed its components and methodology and would be interested in comparing it to WAR, but it’s not something I can scope out at first glance. You made no argument for why you think WARP is more valid than bWAR, only that using WARP and Win Shares, Smith beats out Suzuki 2-1. Since I do not see Smith does prevailing in Win Shares once the influence of team wins is accounted for, that’s not persuasive to me. But if you can argue for why WARP is superior, or if I discover that I think it is as I learn the system, then I’d be won over. (Although I should point out that the comparison you show, which gives Smith a huge 30% edge, uses the leveling device you chose for the Win Shares comparison — initial +/- 8000 PA — rather than the one I suggested: ages 27-37, which I think is critical for answering the “as good a player as” question, since in Suzuki we are able to see only his performance from normal peak year down.)
I do appreciate your putting me on to WARP, just as you led me to the Baseball Gauge earlier in this exchange and to RC/27/AIR before. I think I’ve benefited more from what you’ve offered in the course of this argument than you can have through anything I’ve written. But this string is winding down and I think we’ve probably established the grounds of our disagreement pretty clearly. I’m sure you’ll find errors or things you disagree with in this post, and if you want to point them out, I’ll let that be the last word.
epm,
I only used Smith’s 8050 PAs because it includes his decline (in fairness to Suzuki) and those 8050 are all he has. Ichiro’s peak was his 1st ten years in Seattle and, in order to get him to 8,000 PA’s , I used his entire Seattle years. That’s it, plain and simple.
As far as a “comparison” formula, in the BJHBA, James used:
1) Best 3 seasons
2) Best 5 consecutive
3) WS / 162 games
The 5 consecutive seasons probably works well for players 30-100 at a given position but probably not as well as for the 1-30 slots where players have longer peaks…by the same token, it’s his book, so he can do what he pleases.
Comparing players from different eras is kind of like marriage – difficult at best. But if you’ll peruse the Baseball Prospectus website with the same fine-tooth combing you’ve done here, I think one thing will stand out: In the individual seasons, the rankings of the players make a lot of sense to anyone familiar with those years or with any reasonable power of recollection (i.e – I’m sure you remember those great Toledo Rocket football teams of the early ’70s….). I think you’ll find it a useful tool….
Thanks again for your insight
e p m,
One other source: Retrosheet. If you hover over “Games, People, Parks”, choose, “Games”. That will take you to a choice of seasons. Click any year and, once on that season’s page, scroll down to ML Leaders (should be just below standings). Click on that “ML Leaders” and you’ll see, within all the stats, a section called “BFW”.
BFW is the old system of linear weights and coefficients developed by stat pioneer Peter Palmer. His ‘seminal” work, “THe Hidden Game of Baseball”, was pushed along/published/co-authored by John Thorn. It should give the top 4 or 5 for the season among batters and pitchers. Each player’s Retrosheet page also gives annual BFW numbers and career totals
Thanks for the added tip, Paul.
He almost looks like a Dead Ball Era player.
A couple things, some Ichiro and then some tangential thoughts.
Part of the problem with ISO is that it only looks at power hitting, when that’s not all a player does. Bill James liked (years ago) to talk about Secondary Average: (TB-H+BB+SB)/AB
It looks like a batting average, but it measures a lot more. Anyway, Secondary Bases, in the course of a normal ML season, end up being roughly equal to the total number of hits. Just check any season, you’ll see that they’re basically always within 3% of one another (though, yes, there are exceptions). Anyway, another thing James noted is that R+RBI tends to be roughly equal to H. George Brett has perhaps the most “balanced” stats of all-time on this level. If H tend to be equal to Secondary Bases, and H TEND to be equal to R+RBI, batting average is a pretty good indicator of value.
However, as we all know, just because something is true at the LEAGUE level, that doesn’t mean it’s true at the individual level. So I think it’s kind of fun to look at the players “real” impact as a hitter by average his Batting Average, Secondary Average, and Run Average (aka (R+RBI)/AB). It gives you a more complete picture of the player.
Back to Ichiro. In his first ten MLB seasons, he had a .331 average. That’s excellent in a single season, and will often win you (or at least allow you to compete for) a batting title; over a ten year span, it’s remarkable. Anyway, during that time, Ichiro had a .222 Secondary Average, and a .236 Run Average. So if we take as a principle that a normal .331 hitter would have a .331 Secondary Average and a .331 Run Average, we can average the three numbers, and we’ll get a better idea of what Ichiro’s batting average “should have” been to give an accurate evaluation of his skills as a hitter. We get a number of .263, which is substantially lower. Now, if we were doing our due diligence, we’d adjust for the fact that he played in a pitchers’ park, but even then you’re looking at, in the sum of it, a league average hitter during his ten-year peak. In other words, the batting average overstates it, the ISO, the walks, and the RBI drastically understate it. (By the way, the Run Average idea is pretty broken for a leadoff hitter; Ichiro had 162 plate appearance per year in which he was guaranteed to have no runners on; this is a problem with this evaluation. If you want to use that to tick him up even further, be my guest; that plus the park adjustment would probably get Ichiro more in the .280-.290 range, which is probably more in keeping with his OPS+ of 117 for the period.)
Anyway, if he hadn’t also been A.) playing absolutely every day (over 159 g/year over his first 12 seasons) and he hadn’t been a fabulous outfielder, he wouldn’t even be in the discussion. Fortunately for him, he was an everyday player who excelled in the field. The fact that he missed several (three? four? five?) productive MLB seasons, which most of us give him some credit for, puts him even higher. Again, my silly numbers are overly simplistic, but it’s a fun little tool. 2001 Barry Bonds, according to the record, batted .328; given his other stats, though, he performed more like someone who batted .607 (not a typo)! Here are some other notable seasons (presented as Player, Season – ActualBattingAverage/CompositeAverage):
Ty Cobb, 1911 – .420/.433 (not often you get a .400+ batting average UNDERSELLING someone’s value, I think)
Babe Ruth, 1921 – .378/.595
Lou Gehrig, 1931 – .341/.480
Ted Williams, 1949 – .343/.495
It’s a fun & silly little tool, and your thoughts about Ichiro made me think about it again.
Doom,
How about runs created, 51% G @ RF, 1st thru 10th years
1 Hank Aaron……… 1249
2 Paul Waner… 1247
3 Chuck Klein… 1220
4 Ichiro Suzuki. 1154
5 Manny Ramirez 1106
6 Babe Herman 1083
7 Vladimir Guerrero 1072
8 Bobby Abreu.. 1068
9 Mel Ott……….. 1035
10 Bobby Bonds 995
There is no adjustment for era so this is about as good as Ichiro can look (IMO). Also, Ichiro had the benefit of arriving here in his prime and, for that matter, I can’t say I would take him over any of the guys on this list with the exception of Babe Herman and Klein
Well, it might be fair to say that Ichiro arrived in his prime. The classic Bill James age is 27 for a prime season. However, lots of hitters peak earlier. It’s possible that Ichiro’s best days were already behind him when he arrived. What if he was, for example, Eddie Mathews, who was still a fine hitter into his 30s, but whose best seasons had been as a younger 20-something? It’s certainly possible, and part of what makes assigning value to Ichiro a tricky proposition. To me, if you give him ANY credit for a good season or two prior to coming to the US, he’s right up there with any of our top competitors; add in some of the social factors, the “fun to watch” factor, and the way he was a true cultural phenomenon on both sides of the Pacific, and I easily find a spot for him on my ballot – though I can understand how one would not.
After Doom’s terrific post playing with all sorts of interesting numbers, I’m going to add an impressionistic one.
I’m not sure why it’s necessary to give Ichiro any credit at all for his play in Japan. His experience in Japan explains how he could show up in MLB and be such a force from the outset. But what if Ichiro had never set foot on a ball field until his MLB debut, and then, at age 27, had run off a streak of ten seasons with 2244 hits — more than 200 hits beyond any other player in his first ten seasons? I think we’d regard him as more, not less phenomenal. Same thing if he’d somehow gotten an MLB contract after seven indifferent seasons in Japan. In my view, Ichiro’s CoG (and Hall) case has to rest on those ten seasons, a very extended exceptional peak, generating 54.6 WAR.
Looking at Voomo’s comparison with Lloyd Waner, I think he’s got the wrong brother — Paul’s ten-season peak (beginning with season 2) yielded 54.5 WAR: more ISO (not that much more) and less D and speed than Ichiro, but generating comparable net value. Lloyd’s peak yielded 19.3 WAR. Both Waners are in the Hall, but only one belongs, and he’s solid for the CoG. Of course, Paul has more total WAR than Ichiro, but that’s because he burst onto the scene from out of the cornfields as a 23 year-old rookie, while Ichiro burst onto the scene out of the ricefields as a 27 year-old rookie. In either case, ten straight years averaging 5+ WAR/yr. is certainly an adequate basis for a CoG case (Lloyd never exceeded 3.6 in any year).
Doom,
Eddie Mathews is probably not the guy we want to use as a potential young superstar comp for what could have been for Suzuki as a 22-26 year old. Mathews was a power hitter and took a walk- some things Suzuki couldn’t dream about.
How about a 175 pound Pete Rose or Rod Carew?
The only thing Mathews and Ichiro had in common as 20-26 year olds is that they wore pajamas for a living
Plenty of hitters with different profiles had similar career shapes, even if their skills were different. Vada Pinson or Cesar Cedeno, if it makes you feel better. 🙂
Too much power from both those guys….they even walked more. Somewhere in response to e p m, I threw in Rose and Carew stats for ages 21-26. Those numbers, from a hypothetical standpoint, actually might fit for a light-in-the-ass young athlete who never really hit with power from age 27 on
I’m trying to get a handle on defensive stats, and will admit my ignorance. Can anyone here enlighten me as to the difference between Rtot and Rdrs on Baseball Reference? The concept appears to be the same, yet one can get wildly variant totals. For example, Sammy Sosa has 104 career Rtot (which as best I can tell is pretty good), but a -16 Rdrs. Perhaps I’m totally missing the point.
This perhaps seems out of place in this thread, but I’m not sure where else to put it, and it is partly an attempt to apply defensive metrics to our candidates.
Josh, I’m going to venture beyond what I understand, but this site is a good place to display ignorance and learn from your mistakes, as I have reason to know, so I’m going to answer as best I can and look forward to correction.
I think there are two different issues here. One concerns timing: Rdrs is a figure generated by data compiled by a company called Baseball Info Solutions (BIS), founded by a guy named John Dewan. BIS’s data kicks in only in 2003. In Sosa’s case you can see that the Rdrs column is blank before that date, so the actual disparity is not +104 to -16, but +2 to -16. That’s still a difference, but it’s not overly dramatic.
Rtot is based on a method called Total Zone Runs devised by Sean Smith, who founded a data info site called BaseballProjection.com. While Smith’s site may be the source of the data B-R uses, his own data source is simply the box score information recorded by Retrosheet for games played from 1957 on. Rtot, therefore, has the advantage of being compilable for 61 seasons worth of data versus Rdrs range of 15 seasons.
The second issue concerns differences in methodology. The methods Smith uses for Rtot are, as I understand it, ones that you or I could apply, since he is basically sorting the events recorded in Retrosheet data according to formulas he’s devised and published that divide responsibility for play outcomes among relevant fielders. (B-R reproduces Smith’s own description.)
The BIS method is not one you or I could replicate because it relies on many people viewing videos of every play of every game from 2003 on, and making judgments according to a rubric that incorporates about one-quarter-zillion factors bearing on each ball in play. Although BIS claims its judgments are objective because the criteria for assessing each play are very narrowly defined, I believe they are clearly subjective — which does not mean they aren’t impressively fine-grained and as reliable as it gets (at least until MLB begins to crunch and publish StatCast fielding data). At intervals, Dewan and his crew publish big books crunching their data in charts, tables, and diagrams, so BIS is transparent, even if its methods are open to criticism (criticism that BIS has been willing to publish and accept . . . the books, by the way, are titled, The Fielding Bible, Vols. 1-4; Bill James is a contributor, the early volumes can be bought used online for next to nothing, and the ones I’ve read are entertaining and impressive).
I think B-R uses both systems because it wants to use Rtot’s pre-2003 data, but it probably views BIS’s methodology as superior (which it clearly is: Rtot is based on reading box score-type descriptions of fielding events — though Retrosheet data gets increasingly detailed in later years; Rdrs is based on viewing the events). Perhaps somewhere B-R explains this in a straightforward way, but I’m not sure where to find it (although, to complicate matters, I can note that B-R does go into some detail about a completely different issue of conflicting fielding data).
Thanks, that is helpful. It still seems like there can be quite a difference between the two scores, which I suppose reflects on your point about Rdrs’s superiority. Sosa’s Rtot is nearly as high as Kenny Lofton’s which I find difficult to believe. Perhaps that is my poor recollection, or a flaw in the methodology.
Just looking at Sosa again….Rtot has him at +7/yr and Rdrs at -6/yr. That is a pretty drastic difference, no? Maybe I still need to familiarize myself with the scales better…
Rtot/yr has Sosa at +7/yr for 1989-2007.
Rdrs/yr has Sosa at -6/yr, but only covers 2003-7.
If you consider Rtot for 2003-7 only, Sosa’s per 162-game-season average is -1/yr.
The figures that represent the disparity are thus -1/yr vs. -6/yr.
Over 60% of the disparity is removed by that adjustment, but the remaining 40% is still significant.
I believe the disparity does not concern scales; it concerns data. Sean Smith and John Dewan are relying on fundamentally different databases, one derived from Retrosheet written descriptions of play, the other from a small army of video observers recording what they observe using specialized software that measures ball speeds, as well as a completely innovative interpretive scoring rubric for interpreting observations in quantifiable descriptive categories.
I believe there is no way for you or me to assess which interpretation is more valid without ourselves observing videos of the game events and assessing whether the Retrosheet descriptions or the recorded video observations more closely match what we see.
There is a discussion on DRS in the glossary section of Fangraphs.com.
Thanks, Richard. It’s a good discussion, maybe a little wonky for some tastes, but FanGraphs is that way.
The initial screen has a link to the Fielding Bible website, but it’s actually a blind link to Bill James’s site (BIS publishes both the Fielding Bible and the annual Bill James Handbook). The actual site has interesting articles and it includes the FAQ page that FanGraphs does successfully link to, which is a really detailed but (I think) clear description of Rdrs (which BIS bases on what it calls the Plus/Minus System).
Off topic but of general interest: Two months ago, Doug posted a great piece of research on the home run upsurge of 2017. (Hopefully, Doug will be repackaging that and other research pieces he’s done so that it will be easier for us to make continuous use of them.) I just read an interesting report concerning the 2017 HR binge on the website fivethirtyeight.com.
The 538 report seems to me to say that about half of the binge can be attributed to physical/chemical changes in the ball that a series of lab tests have revealed, changes that could add over 8 feet to the trajectory of a long fly ball. The other half may have been due to the growing swing-for-the-fences strategy teams and players are adopting, a strategy that may be growing because the changes in the ball are rewarding it.
I’m just flagging the article for interested HHS participants. I’d wait for a post-CoG opportunity if I had any faith in my ability to keep the idea in mind over time, but I have more faith in the warmth of Kim Jong-un’s loving-kindness.
Well, looks like Randolph isn’t gonna win.
I’ll change my vote
Helton
Pettitte
Randolph
to
Boyer
Lyons
Randolph
Vote:
Richie Ashburn
Dwight Evans
Don Sutton
We have reached the deadline for changed votes for CoG Round 128, so I thought I’d post an update on the count, as I have it.
Primary Ballot
With 17 ballots in:
12 – Ichiro Suzuki*
=================50% (9)
5 – Bill Dahlen, Dwight Evans*, Luis Tiant, Bobby Wallace
=================25% (5)
4 – Kevin Brown, Manny Ramirez
3 – Dick Allen, Richie Ashburn, Graig Nettles
2 – Don Sutton*
=================10% (2)
Ted Simmons has not yet recorded a vote.
Voters: Jeff Harris, Doom, epm, dr. remulak, Dave Humbert, Scary Tuna, Andy, JEV, Chris C, Hub Kid, Richard Chester, Hartvig, robs, Mike L, Doug, Paul E, Voomo
Secondary Ballot
So far there are only 13 votes for this ballot:
9 – Ken Boyer
7 – Andre Dawson, Ted Lyons
5 – Todd Helton
4 – Willie Randolph, Rick Reuschel
3 – Andy Pettitte
====================10% (2)
Voters: Hartvig, dr. remulak, Voomo [with change], Dave Humbert, Scary Tuna, Andy, epm, Doom, JEV, Hub Kid, Richard Chester, Doug, Paul E
Please let me know if you spot an error.
My main ballot vote:
Ichiro
Dahlen
Evans
Ichicro belongs for me, no question. He is definitely borderline on advanced metrics, but so singular that it doesn’t matter at all for me. You can forecast some pre-27 seasons, you can make a narrative around anything to do with his career, and I’m an open ear to it. He electrified basesball and was a counterweight to the heavy burden of the steroid era. His story and value go so much farther beyond career and peak advanced stats that I’m happy to use my stats-first model as a jumping off point for him instead of a boundary. The vote is definitely a bit personal – Ichiro and his otherworldly hit totals are very much what brought me to discover baseball-reference and the advanced stats that came with it, and eventually this community. That is something that I hold dearly, for sure. But also, on the scale of things, he contributed less than the gaudy counting stats suggest, but wow was he ever something. That feeling is what brought me to baseball, and I’m happy to honor it.
Would like to second epm’s suggestion that each February we have a redemption round prior to new elections. This will allow everyone to re-assess passed-over candidates to help ensure the holdover number and quality stay consistent to the COG size at that point.
The secondary ballot gaining 3 new faces each year will add fresh life to the discussions, improve secondary ballot voting participation, and minimize strategic “throw away” votes. I believe the secondary ballot is getting stale with voters really interested in 1 or 2 of the 7-8 we will have (after this round we will only have 6 plus likely Simmons and possibly Sutton). The primary ballot is not so crowded (it will have from 9-11 remaining) and voting is split up enough that few will drop off. This causes the secondary ballot to remain small and gradually deter voting on it unless new blood is added.
The primary ballot gaining new birth years will add some high level talent: 1974 (Jeter/Abreu), 1975 (A-Rod/Ortiz/Vlad/Rolen), 1976 (none) but not too fast to outpace HOF selections, and next year is likely to add 2-3 slots to fill (Rivera/E. Martinez/Mussina). This will not serve to push anyone down to the secondary ballot unless voters collectively shun some candidates, shuttling some between the 2 lists while never considering others again. Once again, the same players get re-hashed without new infusions.
The list of redemption candidates we passed over previously that are now more viable in an expanded COG should not be overlooked. I can come up with 10 that are competitive vs. our current holdovers: Palmeiro, Clarke, B. Bell, R. Smith, Bi. Williams. Coveleski, Eckersley, Drysdale, Newhouser, and McGinnity. There are certainly others I may have missed – and I’m sure other voters have their favorites too. Sparking lively debate is always good for COG voting and discussion.
As epm mentioned, if the 3 are considered not COG worthy by a majority they will remain on the secondary ballot or drop off, but the occasional gem has a shot via redemption (we honored Paige and 3 Finger Brown recently). It will be a while before the secondary ballot gets too big, and the selection process should ensure the most deserving stay on it. The real challenge is too keep the pool from being too small/repetitive, and yearly redemption rounds should fix that.
Doug set up a great mechanism to keep our “near misses” in the conversation/debate through a secondary ballot. This tweak would permit us to restock it in a timey fashion (as once/10 rounds may take 3+ yrs, and waiting until only 3 candidates remain may take just as long and/or put in less worthy options).
Sorry for the long post, but I think redemption opportunities are critical for success in expanding the COG.
Secondary ballot:
Reuschel
Lyons
Randolph
I’d be happy to take another look at Boyer on the main ballot too, so if the lead stays as is, I’ll be fine with it. I do like this ‘secondary ballot’ addition in that it brings back players one at a time so we can (theoretically) consider their cases more incrementally and carefully.
Another advantage of the secondary ballot is as a “holding basket” for plausible candidates – we can keep players there for future consideration (say the “next tier” guys at each position) without clogging the primary ballot or burning redemption votes “bringing back” the most popular guys that just dropped off. It is a place where multiple comparisons can be made and momentum built prior to primary ballot efforts. Lastly, it can function as a safety valve should a new birth year flood the primary ballot with good options (such as 1975 coming up).
I fully agree. Thanks to Doug — it’s a great idea!
I goofed on my Secondary Ballot (voted for primary ballot members).
If still time to recast my secondary ballot is:
Dawson
Boyer
Randolph
Don’t feel bad, robbs: you’re not the first.
I don’t know whether your revision should be considered a ballot change, for which the deadline has expired (and so this change would not count), or an initial ballot, since your first ballot was invalid (in which case it would count). Doug is the arbiter of all such matters, and I’ll leave it up to him. But if we haven’t heard from him before the final tabulation tomorrow, the tabulation I post will indicate both possible outcomes.
I’m OK either way.
How many slots to the original COG are we adding?
Each round adds only one, as before (although this year there have been four rounds, since the BBWAA added four players to the Hall — we’re now on the fourth).
The secondary ballot is designed to make sure that in years where we multiple slots to fill and not too much CoG talent in the birth year we’re considering, like this one: 1973, we cast a bit broader net than just the holdovers from last year’s rounds. Some players who dropped off the ballot in past years may now seem more eligible, since as the Circle expands, the range of talent it includes may expand to include players not deemed particularly CoGworthy in the past.
The “corrected” ballot is the first valid vote, so it will count.
Thanks for the clarification, Doug.
For the 1973 Part 3 election, I’m voting for:
-Ichiro Suzuki
-Manny Ramirez
-Don Sutton
Other top candidates I considered highly (and/or will consider in future rounds):
-Tiant
-Evans
-Brown
-Ashburn
-Nettles
-Allen
-Wallace
-Dahlen
Thanks!
(Sorry, I meant Part 4.)
For the Secondary Ballot, I’m voting for:
-Andre Dawson
-Todd Helton
-Willie Randolph
Thanks!
Primary:
ManRam
Brown
Nettles
Secondary:
Boyer
Dawson
Randolph
I’ll admit to not being quite sure what to do with Ichiro. It’s clear he could outplay his deadball comps like Lloyd Waner in his sleep (it takes Waner’s three best seasons to eclipse just Ichiro’s 2004), but I think he’s also not quite as good as some other guys in his value range.
CoG Round 128 may not be remembered as a nail-biter: Ichiro Suzuki was a first-ballot shoo-in and the first (technically) active player to be elected to the Circle of Greats. These are the tabulations I have, pending Doug’s official record:
Primary Ballot
There were 20 ballots submitted, with these results:
14 – Ichiro Suzuki*
=================50% (10)
6 – Bill Dahlen, Dwight Evans*, Manny Ramirez
5 – Kevin Brown, Luis Tiant, Bobby Wallace
=================25% (5)
4 – Graig Nettles
3 – Dick Allen, Richie Ashburn, Don Sutton*
=================10% (2)
Ted Simmons did not receive any votes and will return to the secondary ballot.
Voters: Jeff Harris, Doom, epm, dr. remulak, Dave Humbert, Scary Tuna, Andy, JEV, Chris C, Hub Kid, Richard Chester, Hartvig, robbs, Mike L, Doug, Paul E, Voomo, bells, opal611, Cursed Clevelander
Secondary Ballot
There were 17 ballots submitted in what, unlike the primary ballot, turned out to be a close race:
11 – Ken Boyer
10 – Andre Dawson
8 – Ted Lyons, Willie Randolph
6 – Todd Helton
5 – Rick Reuschel
3 – Andy Pettitte
====================10% (2)
Voters: Hartvig, dr. remulak, Voomo [with change], Dave Humbert, Scary Tuna, Andy, epm, Doom, JEV, Hub Kid, Richard Chester, Doug, Paul E, bells, opal611, robbs, Cursed Clevelander
Please let me know if you spot any errors.
Simmons actually had two guaranteed rounds of eligibility, so he will remain on the primary ballot for at least one more round of balloting.
Could someone repost the link to the current COG member roster page please?
Hartvig, there’s a tab for it on the top of this page. It takes you to two further links: one to the roster itself, the other to a list of all past election debates.
Got it. Thanks.