
With his first stolen base of this young season, Twins outfielder Byron Buxton joined elite company with his 30th consecutive theft without being caught. After the jump, more on base stealers who have been toughest to throw out.
The table below shows the players with 30 consecutive successful steals. While I believe the list is complete, it was more an art than a science to find these, so I welcome any additional streaks you may be aware of.
| Consecutive Steals | Players |
| 50 | Vince Coleman (1988-89) |
| 45 | Ichiro Suzuki (2006-07) |
| 40 | Tim Raines (1993-95) |
| 39 | Jimmy Rollins (2007-08) |
| 38 | Davey Lopes (1975) |
| 37 | Tim Raines (1983-84), Stan Javier (1996-97) |
| 36 | Max Carey (1922-23), Paul Molitor (1993-95), Brady Anderson (1994-95), Coco Crisp (2011-12) |
| 35 | Davey Lopes (1983-85), Jimmy Rollins (2001) |
| 34 | Eric Davis (1992-93), Eric Young Sr. (2000-01) |
| 33 | Kevin McReynolds (1987-89), Eric Davis (1988), Carlos Beltran (1999-2001), Byron Buxton (2017-19) |
| 32 | Willie Wilson (1980), Julio Cruz (1980-81), Tony Womack (1997), Carl Crawford (2008-09) |
| 31 | Rickey Henderson (1986-87), Carlos Beltran (2004), Nate McLouth (2008-09) |
| 30 | Eric Byrnes (2007), Jimmy Rollins (2009-10), Mike Trout (2012), Alcides Escobar (2012-14) |
An extended streak of consecutive stolen bases requires a lot of things to go right, the right pitcher and catcher, the right pitch, a good jump, good speed (though that may be the least important requirement), perhaps an evasive slide, and just plain good luck.
Max Carey is the pioneer of consecutive steals streaks, with his record total of 36 the standard for more than 50 years and never really challenged in that period. Indeed, only Lou Brock (28 steals in 1974), Frankie Frisch (27 in 1927-28) and Luis Aparicio (26 in 1957-58) threatened even the 30 consecutive steal plateau before Davey Lopes broke Carey’s record in 1975.
The list above includes some notable base stealers in their primes (Coleman, Lopes, Raines, Davis, McReynolds, Beltran, Wilson, Cruz, Womack, Crawford, Henderson, Rollins, Trout). But, there are almost as many who accomplished this feat in their thirties (Ichiro, Lopes, Raines, Carey, Molitor, Rollins, Javier, Crisp, Davis, Young, Byrnes), with Lopes and Molitor doing so late into their fourth decade. So, experience, and the guile and cunning that comes with it, can help “turn back the clock” and compensate for a lost step or two, enabling an older player to continue to steal bases successfully.
While Vince Coleman tops this list with his 50 consecutive steals, that is something of an aberration for Coleman who, despite a stellar 81% career success rate, still led his league in caught stealing three times, including in the season in which his streak began. Contrast that with Ichiro in second place who was thrown out just twice in 47 attempts in the season his streak began. McReynolds, Molitor and Alcides Escobar all have streaks spanning three seasons, including a middle year with 20+ steals and, of course, zero CS.
Mike Trout is the youngest player at age 21 to record 30 consecutive steals, and the earliest to do so in his career with his milestone steal coming in only his 138th career game. Davey Lopes is the oldest, maintaining his second 30 game streak to age 40, while Paul Molitor ran his streak until age 39, over 2200 games into his career. The longest streak to begin a career is 26 consecutive steals by Mitchell Page in 1977, while the longest to close out a career is 29 consecutive steals by Jack Perconte in 1985-86.
No doubt you will have noticed that most of these streaks have occurred in the past 30 years or so, testament to the influence of analytics in helping baserunners choose the most opportune time to attempt a steal. That trend is depicted in the chart below.
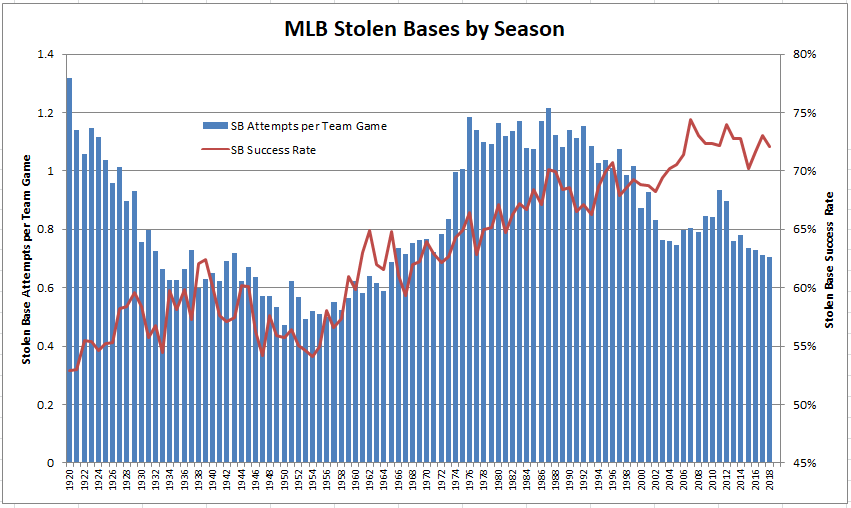
Up until the 1950s, stealing bases was barely a break-even proposition, making it a poor strategy generally with a benefit of only one base, but with the potential cost of a baserunner and an out. From the 1950s to the early 1990s, base stealing success improved steadily in tandem with the number of steal attempts. But, since then, while base stealing success has continued its rise, base stealing attempts have moved steadily lower to levels today not been seen for 50 years. This change in the correlation between base stealing success and attempts is one of the big influences of analytics, dictating that you better be as certain of success as possible before attempting to steal, more especially given the predominance of scoring via the home run.
Looking at the leading base stealers provides a bit different picture as shown below.
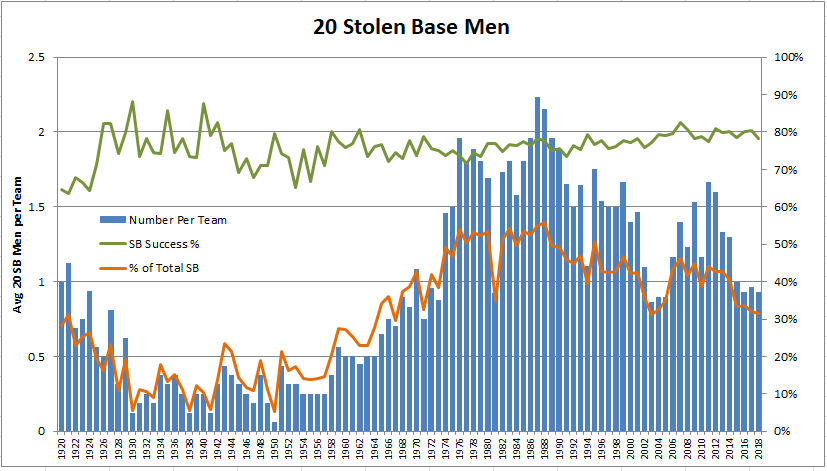
The chart above is showing the average number of players per team with 20 stolen bases which, like stolen base attempts, rose steadily from the 1950s to early 1990s, but has declined since then. While overall stolen base success has steadily improved since the 1920s, the improvement for these leading base stealers has been much smaller, staying mainly in the 70%-80% range since the 1930s. However, while these leading base stealers accounted for 20% or less of total stolen bases prior to the 1950s, that proportion has risen to the 30%-50% range since then. In sum, teams have gotten smarter about the players they allow to steal, concentrating base thefts among those who are best equipped to succeed in that role.
The long term trend and its interpretation are laid out here with great clarity, Doug. We can see the new, technocratic era of baseball highlighted by this stat. But I wonder about the trade-off. From the mid-’80s through the ’90s we see the success rates in the range of 67-70%, while today’s seem to be 73-74%. That’s a significant improvement, but is it enough to justify the loss of what appears to be up to about 80 attempts per team per year? It seems to me almost a wash, and the high-SB game certainly was interesting to watch.
Looking at your list of consecutive SBs, I was reminded of how terrific a player Eric Davis was, and how sadly he failed to build a great career. As interesting as the Hall of Fame may be, I think I’d find a walk through the Hall of Burnt-Out Pheenoms more intriguing.
While the speed game of the 70s and 80s was fun to watch, with so many runs today scoring via the home run, there is an understandable premium placed on avoiding outs on base. So, it shouldn’t be too big a surprise that stolen bases are down despite stolen base success continuing to rise.
I can understand that thinking, but I’m not sure it’s valid — you might equally note how many runners fail to advance to scoring position because of the high number of strikeouts. How the run scores seems to me a tangential issue; the question would be how many runs are scoring vs. runners left on base. Teams still hit about a thousand more singles than home runs each season.
(Should be, “about a thousand more base hits than home runs . . .”)
It’s not just home runs. The general league wide OBP is the highest determining factor in the relative success rate of stealing bases. If we had a league wide .500 OBP on average lets say, stealing base would be dumb in nearly every circumstance. Similarly, if the OBP gets low enough, you need to score on pretty much any hit because they’re so unlikely so stealing becomes paramount. The value of an out is dependent on the run scoring environment. Basically runs/27 outs is baseball.
I’m just saying it is easy for people to blame the death of stolen bases on home runs but the two largest factors are an offensive resurgence (compared to the 70s) and better math on the relative outcomes impacts on the scoreboard/game, not dingers.
Bob,
Here’s something related to your disappointing phenoms list from Bill James. Failed careers of promising rookies:
https://www.billjamesonline.com/disappointments_and_surprises_ii_/
Ah ha! This is the source of that Dick Allen comment we were discussing last string, Paul. I knew I’d read it — your comments on Vada Pinson during the CoG Redemption Round sent me to this Jamesian source.
James’s list isn’t really what I was thinking of — for example, Tony Conigliaro, Ken Hubbs, Bill DeLancey had their careers brought to a halt by massive forces beyond their control; Hal Trosky was similar in some ways. (And how could Pete Reiser be off the list?) Pinson is closer to what I was thinking of; Carlos May another — not just a rookie pheenom, but a guy who established a trajectory early and then simply stalled, like Davis.
The difference is really that James’s list, although steeped in narrative drama and detail, was generated by a very narrowly configured statistical formula: negative discrepancy between career Win Shares and projected WS after the rookie year. I really don’t think that’s the most revealing question to use in searching out career disappointments (and, in fairness, James wasn’t asking about career disappointments, only about “rookie disappointments,” which is how Reiser, who springs to mind, escapes his list — his break out first season was preceded by a less spectacular half-season that took away his rookie status).
Still, it’s impressive you thought of such an appropriate response to my comment!
Eric Davis. Actually, Davis’s career was so injury plagued that he reminds one of Pete Reiser, not Vada Pinson.
nsb,
re Eric Davis, I don’t believe, with his body type, he was ever going to play 155+ games per year. But, yeah, he was producing very well playing 135 games/year. He damaged a kidney and it was downhill for a while. Then colon cancer? and recovered nicely with the Orioles. IIRC, I believe he was a wee bit bitter about the kidney injury in the World Series and taking a coach flight home after being released from the hospital? He had a boatload of talent, for sure.
Reiser had 34.4 Win Shares as a 22 year old…and possibly a projected total of 490 (in lieu of 128). But, I don’t know if I’m calculating the projected career total correctly ( I believe James just took their rookie totals and multiplied by seasons played through age 35 ? ). But, no doubt, right up their with Tony C as far as a disappointing career.
Great charts. I wonder about Doug’s causality though–he says “No doubt you will have noticed that most of these streaks have occurred in the past 30 years or so, testament to the influence of analytics in helping baserunners choose the most opportune time to attempt a steal. ”
So, why is that necessarily true as a decisive factor? We know, by looking at track and field results, that the modern athlete is faster than his counterpart sixty years ago. The 100 meter dash record is six tenths of a second lower than it was in 1956. That could explain some of the differential. There may also be other factors such as harder throwers, more pitches per at bat, far less use of the hit and run play.
I think that’s a good question, Mike. When Doug notes that good speed may be the least important requirement, I recognize that as conventional wisdom stretching back at least to my childhood, and conventional wisdom is often pretty shaky stuff. And even if it were true in this case, the question isn’t how important speed is (since older players sometimes improve in SB%, clearly it’s not decisive); it’s how well increases in speed correlate to increases in SB%. Perhaps Statcast is collecting data that would be relevant to determining that.
Still, thinking about it, perhaps conventional wisdom in this case may be right. We do have the historical example of Herb Washington, who was the fastest sprinter in the world and a 65% base stealer. But the greater question is whether the increases in speed you note for specialists in the sprint would be reflected in increases for athletes in general. After all, baseball players don’t train in sprinting, and while I think there’s no doubt they are better trained for the skills they do focus on, I don’t think we should assume that would be reflected in the times most players require for the quick dash to second base. It may be that better nutrition and general workout improvements have raised the speed of all athletes — perhaps the speed of the general population — but I don’t think you can infer that from 100-meter times, which probably have mostly to do with better training and geographical expansion of the talent pool. (After all, when half the best male sprinters in history come from a place the size of Chicago, how far can we generalize from them?)
Moreover, given that short distance, there is most likely much more speed to be gained from elements other than leg speed: “getting the jump” (which is a matter of reading the pitcher), the dynamics of the standing-turning start, and the well-timed, tag-evasive slide. The true sprint distance is probably only about 60-65 feet, and matching that to 100-meter time improvements would only mean a gain of perhaps a tenth of a second at the outside, and that only among the elite speedsters. Meanwhile, pitchers are being better trained to hold runners, catchers to throw them out, and pitching speed is up (surely the least important factor, as the average pitch only takes half a second to begin with).
Thanks for the well-thought-out response. I’m going to disagree just a bit on the speed thing. We have clearcut demographic evidence that people are taller and otherwise larger than they were 60 years ago, and we see the fruits of that in all sports (not everyone, of course, I freely admit that while I still run, my times are more appropriate for a 15th Century monk wearing robes and sandals). People are faster and stronger, a consequence, in part, as you note, of better public health. As to the 100 meter, it was just a metric. In 1896, the first Olympic Marathon was won by a Greek in about 2 hours and 58 minutes. Today, that would barely qualify you for the Boston if you were under 44.
I think it’s a full package; a more scientific approach to base-stealing, changes in strategy, and faster runners.
In 1901 25% of all players were at least 6 feet tall. In 1918 that number had risen to 85%.
In 1918?
i think he means 2018….
in 1918, if I did the search correctly:
179/309 over under 72″ (every day 8) or 36.68 %
122/80 over under 72″ (pitchers) or 60.396 %
43.62 % overall are at least72″ tall
forget it….I think I’ve doubled the count for 1918 since all pitchers batted and there was no need to “re-search” them (“player pitching”) separately after doing the PI search thing for “player batting”
2018 it is. That’s what happens when you’re typing and watching TV at the same time.
No worries, thought that might have been it. As for distractions, it’s been a Twilight Zone day
The size increase was general for Americans and for other developed countries. Improved nutrition and medicine allows more people to reach their genetic potential in both height and muscle mass. However, the correlation between height/size and sprint-speed is not a simple one.
Look at the top base stealers from the postwar era on: Henderson, 5’10”, Brock, 5’11”, Raines, 5’8″, Coleman, 6’0″, Morgan, 5’7″. (Ben Johnson is 5’9″ without the PEDs.) There certainly are good thieves who are tall, like Eric Davis (and Usain Bolt is 6’5″), but the combination of sprint-speed and agility necessary for success on the basepaths does not seem to give height or muscle mass much of an advantage, if any. Muscle mass seems more likely to affect the strength of a catcher’s arm than a runner’s speed.
Mike,
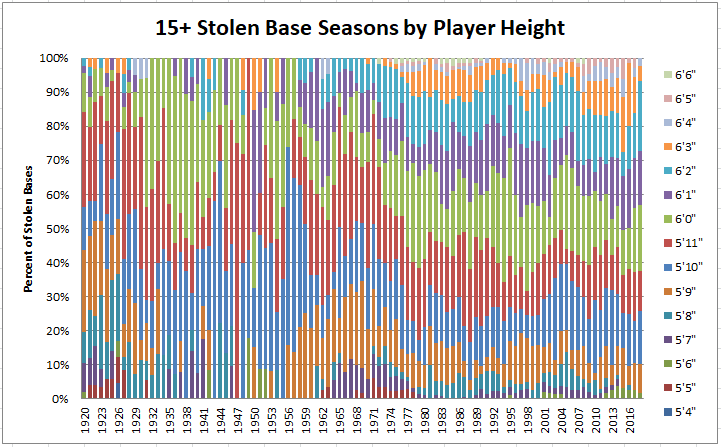
To perhaps shed some light on your conjecture that player size may influence stolen base success, I’ve compiled the chart below. My reading would be that any correlation is slight and probably only evident since the 1990s.
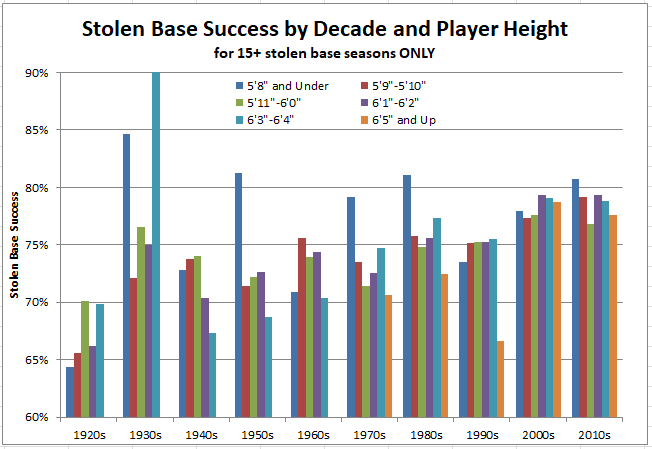
But, the trend to bigger players, generally and among frequent base stealers, is clear from this chart.
Wish I’d scrolled down to Doug’s elegant reply before offering my own, cherry-picked data. . . .
That’s a serious chart. Thanks, Doug.
Actually, “elegant” doesn’t really capture it. I woke up this morning with the thought: How in the world did Doug compile those stats and build those charts in the course of the day?
You have to normalize this for the general shift in player sizes through the time period. For example if the percentage of players who are 5’6″ changes, the percentage of 15 steal players that height represents would change (no height related correlation).
Streakers:
Paul Molitor (39 games), Jimmy Rollins (38 games), and Eric Davis (30 games) also have hit streaks of 30+. That’s a VERY cool 30/30 club to be a part of! Rollins and Davis also had 30 HR seasons in their career. Trout probably walks too much to ever join them, so I think it’ll be a while before we see another player pull off that career 30/30/30.
Which player has the highest SB% whose career ended before 1970?
CS data are available from 1920 and mostly complete for the AL. But, CS data for the NL from 1926-40 are being populated from game logs and thus are fragmentary, as CS data were not officially recorded.
So, leaving out players with significant NL playing time during the missing seasons, the SB% leaders with 150+ SB are:
1. Mickey Mantle, 80.1%
2. Lyn Lary*, 76.8%
3. George Case, 76.2%
4. Jackie Robinson, 72.2%
5. Pee Wee Reese**, 71.8%
6. Gee Walker, 71.7%
7. Bill Bruton, 69.9%
8. Jim Rivera, 69.6%
9. Wally Moses, 68.2%
10. Ben Chapman, 68.0%
* part of one season missing, but fewer than 150 PA, so unlikely to affect placement
** one missing season, so it may be Walker ahead of Reese
Actually, I just wanted to bring up Mantle as an early practitioner of intelligent stealing, although he was regarded as the fastest player in his era as well.
Actually, Mantle’s really better than he looks. He had a poor SB/CS record during his partial rookie season, and he was a little subpar (for him) in his final years, when he attempted very few steals. During the long heart of his career, 1952-64, his rate was 84%.
However, the flip side of Mantle’s approach is that he made relatively few attempts and thus stole relatively few bases, stealing more than 10 in only six seasons, more than 20 only once (21). So while his rate of value added per attempt is very high, his rate per season/career doesn’t compare well with some others leading that list. Look at Mantle compared to Lyn Lary and George Case, two players with lower success rates but more steals in much shorter careers (each about 55% of Mantle’s career length).
Success Rate………..Tot. SB………..SB/PA…………Value rate (SB-(CS*2.333))/PA
……80.1%……………….153……………. .015 ………………………….. .0065 ………………Mantle
……76.8%……………….162……………. .030 ………………………….. .0088 ………………Lary
……76.2%……………….349……………. .063 ………………………….. .0172 ………………Case
That last figure reflects the rate increment in value beyond a 70% success rate per PA (e.g., Mantle added .0065 bases per PA through stolen bases). In Case’s case (couldn’t resist), despite a career only a little over half as long a Mantle’s, he contributes more value in base stealing on an absolute basis as well, adding 95 net bases (SB beyond 2 1/3 x CS) over Mantle’s 64.
Mantle was, indeed, considered the fastest player of his era — really astounding when you consider in how many other categories he contended for best of the era — and he clearly minimized costly CS outs. But with his speed and diamond smarts he probably could have contributed more if he’d been allowed to be more daring. . . . Though why bother? His team rarely needed any more value, and Mantle generally batted third, with sluggers coming up behind him.
But, just to put things in perspective, post-1970, here’s Rickey Henderson:
Success Rate………..Tot. SB………..SB/PA…………Value rate (SB-(CS*2.333))/PA
……80.8%……………….1406…………. .105 ………………………….. .1053 ………………Henderson
Just sayin’ ………
Thursday, July 26, 1956, Comiskey Park, Chicago, Illinois. Yankees 8, White Sox 5. I was there with a group of other kids from the Danville, Illinois YMCA. It was Mantle’s first monster year, the triple crown, 52 HRs. We were all disappointed because he only went 3-for-3, all singles, plus two walks in 5 PAs. Stole two bases. Somehow, despite the fact that the next three guys in the order all had a pair of hits, he only scored once. All the Yankee hits, in fact, were singles.
Perusing the box score I noticed the name Dixie Howell relieving for Chicago, and since I remembered the name I looked him up. Have there been many careers, I wonder, like his?
He began as a professional in 1937 at age 17, going 13-11 in D ball. in 1940 had a cup of coffee with the Clevelands then back to Wilkes-Barre and Syracuse through ’43, two years in the military, back to Syracuse and triple-A for four years with another cup of coffee in the other Ohio city, followed by journeyman work in Minneapolis and Baltimore when they were still minor league towns, then on to Memphis where he was converted to relief. At age 35 in 1955 the White Sox brought him up mid-season, and he spent the next three years relieving for Chicago. Two final years for the other Indians, the ones in Indianapolis. Could have been more but he died in spring training of a heart attack at age 40.
While Dixie Howell was on the Reds there was also a catcher with the same name. They formed a battery on 2 occasions, 5/1/1949 and 5/8/1949.
nsb, So many great names in that box score! I remember Howell’s name. I was going to write that I must have had his card in ’57/’58, but now that I’ve seen Richard’s comment I wonder whether the name I know actually belonged to the Brooklyn catcher in ’55/’56. Great catch finding pitcher Howell’s story — it’s dramatic and sad.
Richard, How do you do this? I know you’ve got resource books with odd facts, but how do you recognize things you can pursue and then find them in minutes?
I posted about the Howells several years ago. I have a Word document with most of my HHS comments. I’ve forgotten most of them but I remembered the Howells. It turns out that they were a starting battery in the May 1st game and I was unable to find another such battery.
Well, Richard, your near-supernatural levels of organization certainly provide the rest of us with items of enjoyment and interest. But when you write, “I’ve forgotten most of them,” I become a skeptic.
Buxton today extended his streak to 33 steals.
And, that’s where his streak ends. Thrown out by the Astros’ Robinson Chirinos with Chris Devenski on the hill.
The Twins had a good day on Saturday at the expense of the Orioles.
– 8 home runs in the 2nd game ties a franchise record, as does 3 players with multiple homers
– 11 home runs in a double-header is one off the franchise record set in 1963
But, no stolen bases or attempts for Buxton, who was 3 for 8 for the twinbill.
A side note: Our previous string is more or less closed, but Artie Z has added to the Voomo-inspired sub-string on HBPless players by identifying the longest HBP-free streak ever.
Thairo Estrada made his MLB debut today, with a sacrifice bunt.
Anybody know how to search for when that was last done?
I assume you mean he got the bunt without having yet played the field. Use the BR PI Player Game Finder and set it for All matching games, Player’s first game, SH> = 1 and sort by date. Clicking on Sub also shortens the search. There are 514 players on the list. You would then have to examine the box score of each game, starting with the most recent, to see if the player had not yet played the field. Chris Nelson of the Rockies debuted on 6/19/2010 with a PH sacrifice bunt. I haven’t done a complete search so I don’t know if he was the last player to do so.
Excluding Pitchers, limiting it to players whose only PA in their debut at the plate was a Sacrifice bunt, and searching for after 1919 (the system says there is missing info before 1920), that gets us to 19 players.
Chris Nelson, yes, was the last one before Estrada. Nelson is the only one of the 19 to both reach base on his sacrifice and score a run.
Two notable names on the list, but only notable for their names.
Joe Morgan and Brian Giles.
But the not-good Morgan and Giles.
10 games on Sunday decided by one run. I’m guessing it’s been a while since that’s happened.
Not that much of a while. It last occurred on 8/5/2018. Altogether there have been 18 days in which there were 10 1-run games and 4 days with 11 1-run games (from 1901-2018).
Richard,
…which begs the question: “Have there ever been a day(s) in the major leagues when the full slate was decided by one run”? Like, 8 games on a weekday between 1901-1960……(not so much on double-header Sundays – certainly unlikely) or 10 games 1962-1968, etc….
I’m not 100% certain but the most games when the full slate were 1-run games was 5 on three occasions: 4/14/1906, 8/3/1919 and 9/10/1987. (Not sure of my English here.)
Richard:
re “(Not sure of my English here.)” – Nor am I (was/were; were/was; was/was; were/were ???), but at least you’re sure of the data – Thanks !!