
HHS contributor “no statistician but” continues his look at Hall of Famers who maybe shouldn’t be. Specifically, he’s examining those HOFers with a Hall of Stats rating under 100. Earlier posts looked at position players. This post concludes the series with a look at pitchers. More after the jump.
To me, pitchers present a special problem of interpretation with reference to both the Hall of Fame and the Hall of Stats. The HOF includes 83 pitchers out of its 261 Major and Negro League player inductees, 32% of the total, a huge body of talent to assess.
And the HOS, to me, shows its weakest side in the rankings it gives pitchers, since it favors accumulators to a tremendous degree. By the HOS ranking Early Wynn (108) is ‘better’ than Billy Pierce (101), a premise that to my insane mind no sane person would subscribe to. Further, anyone who ranks Bret Saberhagen (121) over Juan Marichal or Don Drysdale (both 115) will like the HOS approach, but I wonder if many such people exist.
Thus, to me the following listing of pitchers in the HOF but not the HOS cuts both ways in terms of its arguability. For starting pitchers, in any event, I have included the HOS rating, innings pitched, ERA+, pitching WAR (From Baseball-Reference), and Win Shares (WS) and Career Assessment Win Shares (CAWS), both from Baseball-Gauge (note that CAWS+ is based on 100 = 220 CAWS for starters and 160 CAWS for relievers). For relievers, it’s those stats plus game appearances and saves. Previously, I’ve used the 7th ranked player by JAWS as a reference, but I’ll depart from that approach here to instead select reference pitchers with workloads more like the pitchers under discussion.
LH Starters
Rube Marquard 65—3306.2 IP; 104 ERA+; 36.6 pWAR; 210 WS; 188 CAWS; 86 CAWS+
Herb Pennock 82—3571.2 IP; 106 ERA+; 43.9 pWAR; 239 WS; 201 CAWS; 91 CAWS+ (WW I: 1 year)
Lefty Gomez 77—2503.0 IP; 125 ERA+; 43.1 pWAR; 191 WS; 188 CAWS; 85 CAWS+
Reference: Carl Hubbell 136—3590.1 IP; 130ERA+; 68.6 pWAR; 305 WS; 262 CAWS; 119 CAWS+
Last man in HOS: Jerry Koosman 100—3839.1 IP; 110ERA+; 57.0 pWAR; 246 WS; 200 CAWS; 91 CAWS+
RH Starters
Jack Chesbro 76—2896.2 IP; 111 ERA+; 41.9 pWAR; 210 WS; 210 CAWS; 95 CAWS+
Chief Bender 91—3017.0 IP; 112 ERA+; 42.9 pWAR; 228 WS; 195 CAWS; 89 CAWS+
Waite Hoyt 95—3752.1 IP; 112 ERA+; 53.3 pWAR; 267 WS; 209 CAWS; 95 CAWS+
Burleigh Grimes 98—4180.0 IP; 108 ERA+; 46.9 pWAR; 279 WS; 238 CAWS; 108 CAWS+
Bob Lemon 76—2850.0 IP; 119 ERA+; 37.8 p WAR (10.8 oWAR); 230 WS; 223 CAWS; 101 CAWS+ (WW II: 3 years)
Catfish Hunter 65—3449.1 IP; 104 ERA+; 36.6 pWAR; 202 WS; 186 CAWS; 84 CAWS+
Jack Morris 77—3824.0 IP; 105 ERA+; 44.0 pWAR; 222 WS; 185 CAWS; 84 CAWS+
Reference: Jim Palmer 126—3948.1 IP; 125 ERA+; 67.5 pWAR; 307 WS; 264 CAWS; 120 CAWS+
Last man in HOS: Orel Hershiser 101—3130.1 IP; 112 ERA+; 51.3 pWAR; 206 WS; 175 CAWS; 80 CAWS+
Relievers
Rollie Fingers 53—944 G; 1701.1 IP; 341 SV: 120 ERA+; 25.1 pWAR; 187 WS; 157 CAWS; 98 CAWS+
Rich Gossage 90—1002 G; 1809.1 IP; 310 SV; 126 ERA+; 41.9 pWAR; 219 WS; 182 CAWS; 114 CAWS+
Bruce Sutter 55—661 G; 1042 IP; 300 SV; 136 ERA+; 24.6 pWAR; 161 WS; 157 CAWS; 98 CAWS+
Lee Smith 62—1022 G; 1289 IP; 478 SV; 132 ERA+; 29.4 pWAR; 193 WS; 159 CAWS; 99 CAWS+
Trevor Hoffman 63—1035 G; 1089.1 IP; 601 SV; 141 ERA+; 28.1 pWAR; 185 WS; 148 CAWS; 92 CAWS+
Reference: Hoyt Wilhelm 108—1070 G; 2254.1 IP; 228 SV; 147 ERA+; 49.8 pWAR; 253 WS; 188 CAWS; 117 CAWS+
Last man in HOS: Hoyt Wilhelm
For the final time: The challenge here is to argue for (or against) the presence in the Hall of Fame of any or all of the fifteen HOFers listed with a HOS rating of below 100. One argument is disqualified: Saying that Richard Roe doesn’t belong because John Doe, who was better, has been passed over for inclusion fails on every count to meet the terms of the challenge. The merits or demerits of the listed players, comparisons to other HOFers, the use of more detailed statistics, historical and biographical information — these and similar bases for argumentation are all welcome. Later on I’ll weigh in with some observations about what I think might be at issue regarding some of these pitchers.
To contradict my boilerplate remark above, I’m going to weigh in now. I think the long shadow of Mike H’s series on win shares and his CAWS system of evaluation, plus the discussion thereof, might have the effect of obscuring the different nature of what the NJFOF series has been about. The players here aren’t discussable as HOF heavyweights. Mike is fishing in a different pond.
Further, the almost universally negative evaluation of position players in the comments on the earlier parts of this series makes me wonder if there isn’t a generally held notion that to say anything at all positive about the goats in the Hall of Stats reckoning is to admit to a weakness of character, intellect, and sexual prowess. I’d hoped for more deliberative and balanced remarks, and now that the pitchers—the weakest group of the bunch—are the subject, I almost despair. I hope Bob Lemon’s hitting doesn’t inspire the only praise.
While CAWS and NJFOF may be fishing in different waters, Win Shares and CAWS may be useful for discussion and making a case for or against any of the pitchers under study here. I’ve added those stats to the stat lines for each pitcher.
Amazing how with all the Yankees offensive juggernauts, their starting pitching staffs were just-good-not-great.
The Yanx career leader in WAR for pitchers is a reliever.
I see Gossage as HOFer.
3rd all-time in WAR for relievers.
The two ahead of him are on another planet, but 4th place is a galaxy away from Goose:
56.3 … Rivera
49.8 … Wilhelm
41.7 … Gossage
31.1 … Hiller
29.3 … Lee Smith
…..
In an era of great Closers with great facial hair, Gossage was at his peak arguably the most intimidating and most effective, and his moustache rivaled that of Lyle, Fingers, and Quisenberry (which would be a great name for a mortuary).
Highest single season WAR, relievers:
8.2 … Gossage
7.9 … Hiller ………. sometimes a great moustache
7.3 … Eichhorn …. terrible moustache
6.6 … Sutter ……… terrible beard
6.2 … Abernathy .. clean shaven, earlier fashion era
6.1 … Radatz …….. see abernathy
6.1 … Kern ………… a beard so bad I say it was good.
6.0 … Gossage
Highest WAR in a season of fewer than 50 IP
(Gossage makes this list because it was 1981):
2.7 … Victor Cruz
2.6 … Mike Myers (126.9 park factor! Denver in 2000)
2.5 … Sean Doolittle
2.4 … Ray Searage
2.3 … Gossage
2.3 … Jay Howell
2.3 … Josh Hader (active…)
Victor Cruz was a rookie.
I cannot find any info about why his career was so short.
https://www.baseball-reference.com/players/c/cruzvi01.shtml
Voomo, Your point about Victor Cruz’s premature disappearance is interesting. He did have an impressive MLB record. His ERA+ was fine in ’81, but his WHIP of 1.412 may have been the reason he was demoted. Although his brief stint with Texas in ’83 was successful, he was playing the role of set-up man for only the latter portion of the season, so it’s not too surprising he didn’t make the roster the next spring (though the Rangers could have used a good reliever). If you look at his Minor League record in ’84-’85 I think the reason his career ended is clear. In ’84, back in the Rangers’ system, his WHIP ballooned to 1.529, and then, in the Tiger system in ’85, to 1.768 — not promising at the Triple-A level.
I want to comment on relievers first because while I had a list of relevant stats ready to discuss starters a month or two ago, the discussions of Mike’s CAWS system have changed a lot of what I was thinking of saying about them. I’ll have to rework that. But relievers — firemen, swingmen, and closers — seem to me really outside the bounds of CAWS. Mike sets up an entirely different metric to deal with them and I’ve already discussed that in an earlier post.
Because relievers seem to me to be best judged on statistics other than WS or WAR, here is a group of stats with a different focus, although I have included pWAR, its rate equivalent, and Best10 as well:
pWAR…pWAR/162..Best10..WHIP-Rel..WPA-R/1K…ERA+…..FIP…..IP…….IP-Relief
41.7………..3.7………38.1…….1.197………..21.9…………126…..3.18…1803….1551…….Gossage
29.3………..3.7………24.3…….1.253………..17.6…………132…..2.93…1289….1252…….Smith
24.5………..3.8………25.0…….1.140………..17.5…………136…..2.94…1042….1042…….Sutter
28.1………..2.4………23.9…….1.156………..12.5…………120…..2.96…1701….1506…….Fingers
25.0………..4.2………23.9…….1.058………..31.4…………141…..3.08…1089….1089…….Hoffman
The category WHIP-Rel isolates that rate in relief roles only; WPA-R/1K means WPA in relief roles only, per 1000 IP. Because B-R makes it simple to isolate WHIP in a relief role, I’ve included that stat, and it seems quite relevant to what we expect of a reliever. I think the WPA rate stat (which is not simple to isolate) may also be a good index, but I’m not at ease with the strengths and weaknesses of WPA, so I don’t know what distortions it may introduce. I’ve added FIP because it too seems particularly relevant to closers, but since we have a mix of closers and firemen/closers, I’m not sure how well that reflects their quality.
Smith, Sutter, and Hoffman were pure closers (or in Smith’s case, slightly impure). Gossage and Fingers have significantly more innings as starters than the others. Gossage and Fingers also benefit from having pitched as firemen in the pre-closer era, which provided more IP. Gossage made particularly good use of these IP in his remarkable 1975 and 1977 seasons: those 275 IP provide over a third of Gossage’s career pWAR. I think they clearly establish Gossage as superior to Fingers, but it’s unclear how they bear on comparisons with the other three, who pitched as closers.
In this group of five, Hoffman, whom CAWS places at the bottom of the pack, is superior in WHIP and ERA+ (not to mention in pWAR rate), and — by far — in WPA. That seems to me a lot of superiority. Part of this is surely his closer role, which we can expect to boost WHIP, WPA, and ERA+ (but also FIP, which Hoffman is less outstanding in). But a question behind all this makes these comparisons problematic: Do we know what constitutes excellent stats in a closer, given the short history of the role? Hoffman’s stats may put Sutter and Smith in the shade, but consider Billy Wagner: WHIP-Rel: 0.998; WPA-R/1K: 29.1; ERA+: 187 (!); FIP: 2.72 — most of those stats re far better than Hoffman, much less Smith and Sutter.
And then, of course, there’s Rivera:
pWAR…pWAR/162..Best10..WHIP-Rel..WPA-R/1K..ERA+…..FIP…….IP…..IP-Relief
56.3………..7.1………….39.0…….0.973………46.4……….205…..2.76…1284….1234…….Rivera
With Kimbrel and others still active in a class with Wagner and even Rivera, the likelihood seems high that the five players on nsb’s list will all in time appear to have been premature inductees to the Hall, admitted before the role of relief pitcher had matured to the point where truly excellent pitchers occupied it.
Here’s a sobering thought (at least it as to me when I had it after three martinis): If you look at the 260.1 IP in relief by John Smoltz during his career as a closer, 2001-4, his WHIP was 0.968 – better than Rivera’s, much less nsb’s five.
pWAR…pWAR/162..Best10..WHIP-Rel..WPA-R/1K…..ERA+…..FIP……..IP…..IP-Relief
7.4…………4.6………………–……..0.968……….58.6……….>162…..2.47>…285…..260…..Smoltz 2001-4
Some of Smoltz’s rate stats are significantly skewed by one brief and disastrous outing early in 2002, where for some reason he was left in as he allowed eight runs, all earned, in 0.2 IP – about 10% of all the runs he allowed over four seasons! Some of the figures are also affected by several poor starts he had in early 2001, after returning from Tommy John surgery, allowing 16 earned runs in 25 IP, which led Bobby Cox to shift him to the bullpen. If we could eliminate those 16 runs as a starter from Smoltz’s four-season ERA+ and forgive him that one bad outing of 0.2 IP in ’02 (out of 241 appearances in relief), we would drop his cumulative ERA from 2.65 to 2.08, and his ERA+ would rise to Rivera’s range (I estimate 197). (He also had an excellent post-season record as a reliever, appearing in 11 games with an ERA just under 2.00.) In other words, in about one-sixth the IP, Smoltz pitched at Rivera’s level during his career as a closer.
Smoltz was a Hall of Fame starter, but not Inner Circle like his rotation mate Maddux. If Rivera was, in fact, a Smoltz-quality pitcher in closer’s garb, then who would be the comparators for the five on nsb’s list he so vastly outdistances? I suspect as the game shifts increasingly to prizing power relief staffs over inning-eating starters, the history of relief pitchers will come to look like the history of third basemen: a neglected position staffed by lower-tier players until a few truly outstanding examples (Brooks, Schmidt) changed expectations and put the celebrated Pie Traynors and George Kells on nsb’s list.
I really see Lemon as a HOFer. Kind of reminds me of Halladay with a shorter career, but one in which he was consistently excellent, save for brief periods at the ends of his career. Lemon’s ERA+ is not quite as good as Halladay’s, but 119 ERA+ is certainly Hall-worthy, ranking 32nd of 161 retired live ball era pitchers with 2500+ IP.
So, I’m quite dumbfounded as to Lemon’s poor showings in WAR and HOS rating. Since it is WAR, I first look at what a player did against different opponents. Here are Cleveland’s “Fab 4” starters during the six seasons (1949-54) when they were taking the lion’s share of the Indians workload.
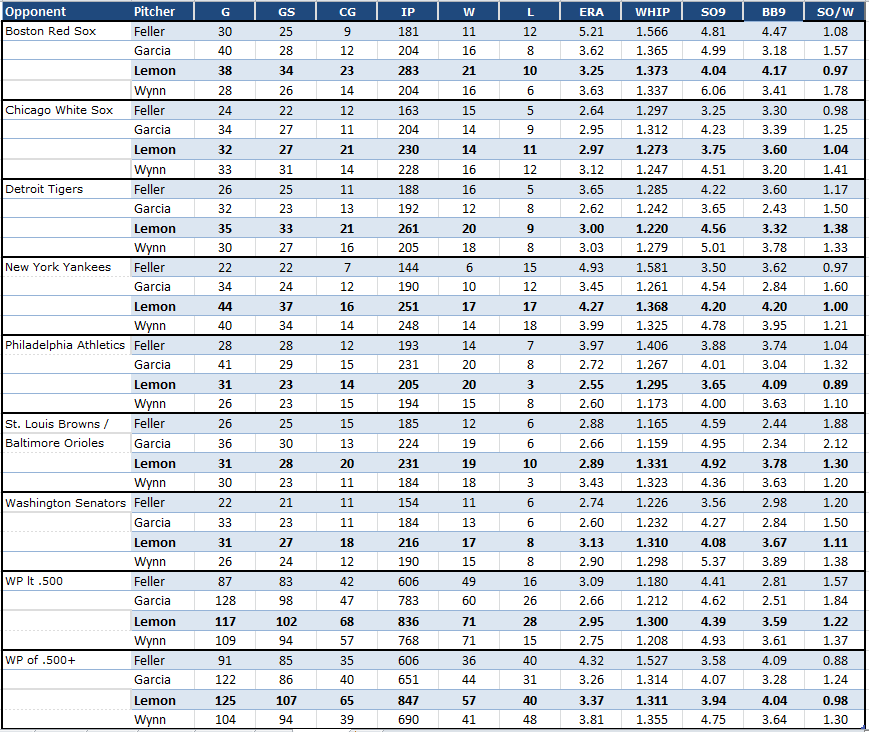
Lemon was clearly the go to starter for an excellent Cleveland club, and especially against the better teams in New York and Boston. And his performance was much more consistent against winning and losing clubs, with easily the smallest drop-off of the four against the better clubs. But, that may be the heart of his WAR conundrum, losing points because he wasn’t much better against the very bad clubs (given the innings workload he was shouldering, it’s understandable that he might pitch to the level of the competition, and save his best efforts for the better clubs).
Lemon’s one thorn is a less than stellar walk rate, and resulting low SO/BB ratio, both likely hurting his WAR. But, bottom line was a very creditable 119 ERA+ and a .600+ winning percentage, so he was generally able to work around whatever troubles his walks may have caused him. I see him as a worthy Hall of Famer, notwithstanding his WAR and HOS numbers.
Great work, Doug, and presented very clearly.
The case for Lemon seems strong. I suspect that he’s being undermined in WAR by several factors:
— Pitching in front of a very strong defense during most of his high-IP seasons (RA9def averaged 0.24 in the period 1947-54);
— a generally favorable park factor (96);
— facing weak overall opposition because Cleveland was frequently one of a minority of strong teams.
The last two combined limit his RA9avg – RA9 to 0.47 (I randomly chose Justin Verlander for comparison: 1.21 in comparable IP). That is, the way B-R calculates, Lemon is not seen as adding great value by limiting opposition runs beyond average.
I was thinking about your point about the imbalance in the AL in those days, with only 2 or 3 strong teams most seasons. So, it’s surprising how little difference there was in the games and IP for these four pitchers against winning or losing teams. That must mean that these four did most of the pitching against the better teams, and the other spot starters were used mostly against the more numerous weak sisters.
Doug:
Lemon’s BB rate was consistent with the era, I’m thinking. He never led the AL in walks, and although he finished in the top ten every year, he generally was first or second in innings pitched. Nowadays pitchers don’t mind giving up homers. Back in the 1946-1955 decade, when the Eddies and others were working the walk, pitchers didn’t mind THAT. One of the (several) things that modern statistical evaluations do badly is failing to to adjust enough for trends. Walks were high, strikeouts were low in Lemon’s era. Double plays, as a result, were high. That players reflect their times to a degree shouldn’t count too much against them.
Over nine years Bob Lemon won 186 games. Has that been matched since? How many times did it happen in the live-ball era prior to Lemon’s arrival? Robin Roberts was a similar workhorse of the era, 199 wins in 10 years, and of course, Warren Spahn churned out twenty-win seasons like clockwork, but Spahn was as unique in his way as Nolan Ryan, only far better.
nsb, This theme seems to me such an overriding issue in Hall decisions that it really deserves at least an outline study. How do the parameters of excellence change over time, and exactly how should it affect the way we view stats from different eras differently?
When the BBWAA has voted on recently retired players, we can be pretty sure that there has been at least rough comparability between the standards the voters had in mind and those that governed play during a candidate’s career. The logic of the Old Timers Committee was that you need “scholars” of baseball during remote eras in order to make similar judgments. It didn’t work all that well, but the idea had merit.
When we use one-size-fits-all metrics for all eras, we bypass those issues. This can be repaired either by developing formulas that adapt base stats to different eras, or by learning about issues such as changing expectations about walks, caught stealing, SO, etc., and addressing them after a simpler one-number rating is generated (which is what your message here is doing). I don’t think these changing standards can ever be reliably quantified, so I think the best approach is to treat a 100-base cutoff metric as, basically, a 90-110 threshold region, and have final binary assessments concerning Hallworthiness focus on the narrative arguments that accompany candidates within that range.
Best 9 Consecutive Win Seasons, selected live ball era pitchers.
200 – Grove (1927-35)
189 – Feller (1938-50)*
187 – Spahn (1953-61)
186 – Lemon (1948-56)
185 – Marichal (1961-69)
184 – Roberts (1950-58)
183 – Jenkins (1967-75)
182 – Hubbell (1929-37)
178 – Feller (1938-49)
176 – Palmer (1970-78)
175 – Ferrell (1929-37)
174 – Perry (1966-74)
173 – Grimes (1920-28), Gibson (1964-72)
172 – Carlton (1972-80)
171 – Hunter (1968-76), Seaver (1969-77)
170 – Wynn (1951-59)
*omitting Feller’s partial 1945 season after returning from military service
Doug, Here are the guys on your list, adding the percentage of team wins that they owned. I omitted Feller ’38-’49 because of the partial ’45 season, and I fudged on some mid-season trade situation by just averaging the wins of the two teams.
200 – Grove (1927-35) 24.1%
189 – Feller (1938-50)* 24.8%
187 – Spahn (1953-61) 23.3%
186 – Lemon (1948-56) 21.9%
185 – Marichal (1961-69) 22.5%
184 – Roberts (1950-58) 26.2%
183 – Jenkins (1967-75) 24.2%
182 – Hubbell (1929-37) 23.0%
176 – Palmer (1970-78) 20.9%
175 – Ferrell (1929-37) 24.6%
174 – Perry (1966-74) 23.0%
173 – Grimes (1920-28) 23.7%
173 – Gibson (1964-72) 22.1%
172 – Carlton (1972-80) 22.5%
171 – Hunter (1968-76) 20.9%
171 – Seaver (1969-77) 22.9%
170 – Wynn (1951-59) 20.7%
This gives some idea of how challenging the game environments may have been over time, though it’s also true that the strength of the pitching staff makes a difference. A top pitcher on a top staff will have less impact in this calculation than a top pitcher on a lousy staff, without the two top pitchers being any less “top.” That said, Roberts really stands out.
When it comes to starting pitchers, one of the key questions to ask is to what degree we want to measure their success solely on pitching and to what degree batting counts. So far as I can tell from the Hall of Stats site, although Adam Darowski doesn’t appear to specify, it seems that the ratings are based on pitching only. WS does consider pitcher batting, but since WS has no negatives that means most pitchers rack up 0.0 offensive WS each season, and batting only counts for good hitters, and only for years when those good hitters hit good. This is why, in the case of Lemon, CAWS has him finishing just above the border (Baseball Gauge gives him 20 batting WS — without them he’s be well under water in CAWS), while the HoS has him in Siberia.
Here are some WAR-based stats for all these pitchers, indicating where they stand in terms of bWAR and pWAR (pitching only):
pWAR (bWAR)…WAR/162IP…..Best10(p)……CbWAR+…….CpWAR+
54.2 (52.6)…………2.3 (2.3)………43.7……………….94……………..92…………Hoyt
43.1 (38.4)…………2.8 (2.5)………44.5……………….81……………..88…………Gomez
46.7 (52.7)…………1.8 (2.0)………45.2……………..102……………..91…………Grimes
44.6 (45.5)…………2.0 (2.1)………44.0..……………..91……………..88…………Pennock
42.3 (42.5)…………2.4 (2.4)………44.3……………….89……………..87…………Chesbro
42.3 (47.3)…………2.3 (2.5)………40.5……………….91……………..82…………Bender
43.5 (43.4)…………1.8 (1.8)………40.8……………….84……………..83…………Morris
37.6 (47.6)…………2.1 (2.7)………36.9.………………97……………..74…………Lemon
36.3 (40.9)…………1.7 (1.9)………35.7……………….81……………..71…………Hunter
34.9 (32.6)…………1.7 (1.6)………37.0……………….87……………..73…………Marquard
68.3 (66.7)…………2.1 (2.0)……..44.2……………..100……………100………..Don Sutton*
*I’ve included Sutton because CAWS+ assigns him a value of 100, so he makes a convenient reference point: I’ve made Sutton represent the Hall threshold here too.
There are two CWAR figures in this table — CWAR being the parallel system to CAWS, that substitutes WAR based numbers for WS-based numbers in calculating the formula: CV~Best10 + (0.25*(CWS~WAR – CV~Best10). The column labelled CbWAR+ uses the total bWAR value for each player; CpWAR+ expresses the formula restricting the WAR calculations to pWAR. Both are (+) figures, meaning they are normalized so the Hall boundary is represented by 100, with Don Sutton’s record as the benchmark, as noted above. (This is very much an ersatz method; Sutton’s such an atypical pitcher I’m not sure he’s the best choice.) Just to be clear: it is CbWAR+ that is the closest parallel to CAWS.
According to CAWS/CWAR, none of these starters was nearly as successful as Sutton as a pitcher, but Grimes exceeds Sutton when hitting is included (Grimes was pretty good for a pitcher; Sutton was poor), and Lemon reaches borderline territory.
Looking at my own favorite pitching stat, WAR/162IP (calculated for pitching-only and then for total bWAR in parentheses), some interesting features emerge. As a pure pitcher, Lefty Gomez really laps the field in terms of the average quality of his seasons, but his career was short (2503 IP, well under half of Sutton’s) and he was an awful hitter (like Sutton). It’s the WAR rate stat that explains why he’s in the Hall despite having fewer than 200 wins (sometimes people think he was voted in because he was such an entertaining guy). There’s a case to be made for Gomez despite his low HoS and CAWS figures, but, truth be told, a 2.8 pWAR rate is not spectacular; it just looks that way in this group. Wes Ferrell, who’s outside the Hall, has a rate of 3.0, as does Luis Tiant (not mention David Cone, at 3.4).
CAWS likes Grimes because he’s in threshold range (90-110) as a pitcher and he was good as a hitter, but I wouldn’t support him: his pWAR rate (1.8) is very low and he’s skating low along the edge as a pitcher.
Lemon is, of course, the stand-out case. His hitting beings him up to the threshold in terms of CbWAR+, and CAWS puts him just across it, but his pWAR is very low, both absolutely and in terms of rate. Yet, as Doug has shown, his traditional stats are really impressive. WAR seems to undervalue him because of strong defense, a pitcher’s park, and weak opposition (Lemon faced only 1-3 teams with strong records each season, and 4-6 teams with weak ones). But all those factors may indeed have contributed to his success, beyond his pitching talent. It’s not that WAR mistreats Lemon so much as that it refracts his record in a form that seems unrecognizable — how does a .600 Pct. 200-game winner wind up with only 37.6 pWAR anyway?
Lemon isn’t like Ferrell, whose CpWAR+ is 100, just like Sutton. Ferrell’s hitting takes him so far above the Hall threshold (CbWAR = 125) that he’s in the CoG. Perhaps we could install Lemon simply by adding his three lost War years. The problem there is that before the War, Lemon was a fledgling third baseman, not a pitcher, and he seemed to be headed precisely nowhere. He was put to work on the mound after the War because he’d shown he could do that job on teams in the Navy. In other words, it was the War that turned his career around. (In any case, his WAR in his pre- and post-War years, 1942 and ’46, average 0.5, and adding 1.5 bWAR for his three War years isn’t going to change the picture much.)
So I don’t think advanced stats are going to put Lemon in the Hall. In fact, they didn’t: traditional stats put him in the Hall, and I’m glad they did. He’s a highly unusual success, and I think he’s close enough by some advanced measures that we should just let the traditional narrative tilt the case in his favor.
Re Lefty Gomez: In two seasons he was the best pitcher in the AL, 1934 and 1937, Grove’s higher WAR in ’37 notwithstanding. His career was short, ten qualifying seasons, but with an ERA+ of 123 or better in 7 of them. His 6-0 record in World Series play is unmatched. Ruffing, with whom he is often associated, wasn’t nearly as good, just effective longer. The latter’s 2.067 WAR/162 pales compared to Gomez’s 2.8.
His subsequent career as a self-deprecating raconteur, like Dizzy Dean’s long stint on the Game of the Week as a professional hick, should have nothing to do with his status as a top flight pitcher over a short span, I’m thinking.
The only pure relievers I think are worthy are Rivera and Gossage. I’d take Eckersley, Smoltz, and Wilhelm for their total work as well. Other than that, I don’t think any of these guys are particularly close.
Herb Pennock and Waite Hoyt are linked in much the way Gomez and Ruffing were a decade later. Pennock, the lefty, was the better pitcher most seasons, but Hoyt, the righty, six years younger, timed his career better, escaped the dark hole that the Red Sox were becoming two years sooner, and had his career year in ’27.
Pennock debuted prematurely for Connie Mack and after a decent season in 1914 floundered for the next three and spent the fourth (1918) in the Navy. He resumed in 1919 for the Red Sox a mature pitcher and led the staff in WAR three of the four years prior to his following Ruth, Hoyt, Schang, Mays, Jones, and Bush to New York. He led Yankee hurlers in WAR four of the next six seasons, trailing Shocker in 1926 and Hoyt and Schocker in 1927. In contrast, except for ’27, Hoyt at the peak of his career was generally the third best pitcher on his team behind some combination of Shawkey, Mays, Bush, Jones, Shocker, and Pennock. Like the Cleveland teams discussed above re Bob Lemon, the Yankees of the Twenties, while noted for their offense, were deep in good pitching, but it was a shifting cast of characters, not the steady big four except for Hoyt from ’21, and then Pennock. Pennock’s long apprenticeship and year in the military cost him in modern statistical terms, but his peak was, I’d say, worthy of borderline HOF consideration. Hoyt?
nsb, Perhaps it’s frailty of character, weakness of intellect, or the fading memory of sexual prowess, but I really don’t think any of these candidates, other than Lemon, warranted election to the Hall. Every one of them had outstanding careers or they wouldn’t be in this discussion, and several are attractive for the way they handled themselves and their careers, especially, for me, Bender, Gomez, Hunter, and Morris. But I see the essence of this discussion to be about how we set consistent criteria for the Hall beyond what numbers can capture, and to make that discussion meaningful, I think it has to be predicated on numbers and benchmarks that we apply consistently and then go beyond, as called for. And I don’t see Pennock or Hoyt as having the numbers, or as having compelling narratives that counter their Hall-caliber statistical shortfalls.
For example, in your comment on Gomez, above, you dismiss his teammate Ruffing by noting that his WAR/162IP was only 2.067. Pennock’s is 2.023, and Hoyt’s not much better, at 2.334. What very strong positive accomplishments, well above what we’d expect for a Hall threshold, are going to balance that discouraging negative? (Ruffing, at least was one of the best hitting pitchers ever.)
Pennock’s career can be divided pretty clearly in three parts:
— 1912-22 (~1300 IP), the pre-Yankee period: ERA+ 92
— 1923-28 (~1500 IP), prime years with NY: ERA+ 132
— 1929-34 (~800 IP), decline: ERA+ 92
His career ERA+ was 106: not hat we’d usually expect to find in the Hall. So Pennock was a below average pitcher (and, indeed, with a negative WAA) over most of his career. His brief prime was good enough to pull his career stats into positive territory, but he averaged only 5.4 pWAR over that peak, and I don’t see that balancing the low career-long WAR rate. Pennock became a popular baseball executive, and it was his sudden death that triggered his election to the Hall, although he was on a trajectory that made it likely he’d get in sooner or later. I don’t know that the HoS figure for him is perfect, but I do think that if we were to repopulate the Hall with the best 232 players as we can view them now, Pennock would not be among them. (If you’re proposing loosening the criteria for the Hall, that would be another matter.)
If I repeated this process for Hoyt, I’d rate him higher — his stats are better than Pennock’s in most categories, but slightly lower in terms of prime years. Overall, I see his statistics as significantly below the Hall threshold, but with the range where special narrative points might make a difference. I just don’t see anything in his narrative of a scale that can counter-balance a stat like a 2.3 WAR/162IP rate. For me, Lemon has that kind of narrative. I don’t think we could compose a chart of Yankee starters that would provide a dramatic case such as Doug’s chart of Indians starters provided for Lemon.
Pennock probably benefited from the advocacy of the Babe in getting his Hall selection. Call it Friends of the Babe, if you will. Several other second-tier players from those Yankee teams made it to Hall, but Pennock did so 20+ years before the others and while Ruth was still alive.
I want to comment on part of nsb’s initial post that caught my eye:
By the HOS ranking Early Wynn (108) is ‘better’ than Billy Pierce (101), a premise that to my insane mind no sane person would subscribe to. Further, anyone who ranks Bret Saberhagen (121) over Juan Marichal or Don Drysdale (both 115) will like the HOS approach, but I wonder if many such people exist.
I had the same reaction that nsb does, but after looking into this more closely, I think that the story is complicated. Let’s look at Saberhagen and the ‘60s stars first:
bWAR…..pWAR…..bWAR/162..pWAR/162..CAWS+…CbWAR+..CpWAR+…ERA+
58.8……….58.9………3.7…………….3.7…………….78……….109………..107………126……Saberhagen
67.1……….61.3………3.2…………….2.9…………..105……….123………..111………121……Drysdale
62.9……….61.8………2.9…………….2.9…………..108……….121………..116………123……Marichal
Saberhagen’s career was shorter than the other two: 2563 IP, as opposed to 3432 and 3507 for Drysdale and Marichal, respectively. But if we look at WAR, Saberhagen managed to accumulate virtually as much pWAR as the ‘60s stars because his rate of 3.7 pWAR/162IP was far superior. Even Drysdale’s hitting can’t bring him within range on that score—and since the HoS seems to calculate pitcher ranks on pWAR (and pWAA), Drysdale’s hitting won’t do him any good there (I think it should). We see Saberhagen prevailing, although not by a lot, in ERA+ as well, a stat that is independent of both WS and WAR.
CAWS is certainly in full agreement with nsb – in fact, it’s really hard to unpack the exceptionally weak rating it gives Saberhagen. But this must be entirely an artifact of the WS/WAR metrics, as the CWAR scores – precisely comparable in formula to CAWS, but WAR-based – see Saberhagen as easily Hallworthy. (It’s good to remember that the two CWAR formulas, for bWAR and pWAR, are both normalized to Don Sutton’s record, which was stronger for pWAR than for bWAR; this is why a poor, and rarely hitting Saberhagen manages to gain on its bWAR-based metric.)
I don’t know why the Hall of Stats ranks Saberhagen above the others, but I believe that if I calculated my own favored metric, which includes a rate stat component, I would too. It seemed to me, after a recent discussion, that Marichal’s record was strongly enhanced by the pitcher’s era in which he played and the fact that he was on a dominant hitting team, whose sluggers he never had to face, and the first aspect would apply to Drysdale as well. If our intuitions tell us that Saberhagen was not in their class, we probably should remember that our intuitions were shaped without a full understanding of the 1963-68 era of pitching and speed.
In any event, this is certainly not a case where the HoS is favoring compilers; if anything, it’s the opposite (although neither Drysdale nor Marichal could be called compilers).
Speaking of compilers, let’s take a look at Early Wynn and how he stacks up against Billy Pierce:
bWAR…..pWAR…..bWAR/162..pWAR/162..CAWS+…CbWAR+..CpWAR+…ERA+
53.4………53.2……….2.6…………2.6………..94……….99………….96……..119…..Pierce
60.7………51.6……….2.2…………1.8………109……..106………….90……..107…..Wynn
Here I think nsb’s point is entirely valid, but CAWS strongly disagrees, and gives the palm to Wynn by an even greater margin than the HoS. Likely, the difference is hitting. The WAR-based CbWAR+ stat nods towards Wynn, but when we remove hitting and look at the two only as pitchers, Pierce comes out ahead. Remember, CWAR is the same formula as CAWS, just with WAR numbers – it looks like CAWS when hitting is included, because CAWS includes it, but our impressions of these two pitchers weren’t formed on the basis of their hitting.
Wynn pitched almost 40% more innings than Pierce, but can’t match Billy in pWAR; his rate stats are awful – and this despite his pitching his age 23-24 seasons in a War-depleted MLB! Wynn’s career wound down with a flourish: the press ate up his 1959 comeback with the Go-Go Sox, pictured him as all that stood between the Yankees and a decade-long sweep of the AL pennants, and then relished his final return to pick up win number 300. He was a cinch for the Hall, while Pierce, the better pitcher — who had an off-year as Wynn’s teammate in ’59 — never cracked two percent.
The point about Saberhagen vs the others is not that his career stats are deficient but that he disappeared from view, at first roughly every other year, then for years at a time. In fact, he had only seven qualifying seasons, and in two of those he pitched under 180 innings. I’m not a fan of either Drysdale or Marichal, but they were there making a positive difference that could be depended upon from season’s end to season’s end year after year. Saberhagen to me is just a statistical outlier whose record has limited substance, exaggerated by the foibles of sabermetrics.
Well, nsb, you’re making sort of the reverse of a Hall narrative argument: the stats are there for Saberhagen, but the narrative reduces their significance. I think it’s a good point. Saberhagen did win to CYAs, and his scattered high points were very high. But his career lacked the predictable shape that adds extra values for contending teams (a point Doom has made several times), while Drysdale and Marichal’s careers had classic shapes. I really don’t see any problem with advanced stats here, but stats, whether advanced or traditional, only get us part of the way, and on reflection I think you’ve found a good example where they are not a reliable guide to overall quality, just as in the case of Lemon.
Hmmm: “. . . to CYAs . . .” I’m helpless against armies of typos, but that one’s more illiterate than most.
I’m going to make a case for Rollie Fingers. We tend to forget or minimize how different and how much more difficult (in my view) it was to be a primary reliever in Fingers’ time. It’s worth remembering that there used to be an award for the best reliever called the “Fireman of the Year” award, as in the pitcher who was most adept at putting out fires, coming into games in difficult situations and getting out of those jambs. And, oh, by the way, since you’ve done that, why not stick around and pitch another inning or two and finish the game. Try doing that 40 or 50 times a season, plus do the “closer” thing another 30 or 40 times. That was the life of the primary reliever in the ’70s; today, we’d probably call it pitcher abuse.
Some numbers.
Of 907 relief appearances,
– 509 were four outs or longer, incl. 404 GF and 200 SV, with a 77-51 record, 1.79 ERA and 0.98 WHIP
– 373 were six outs or longer, incl. 294 GF and 135 SV, with a 66-39 record, 1.73 ERA and 0.98 WHIP
7 straight years (1972-78) and 9 total with 60 appearances and 100 IP
12 straight years (1971-82) with 45 appearances and 70 IP
Of 33 post-season games for Oakland for 1972-74, Fingers appeared in 24 with a 1.55 ERA and 1.08 WHIP
Of 21 post-season wins for Oakiand for 1972-74, only 5 were complete games and none of those were in the World Series. Fingers appeared in 15 of the other 16 wins.
Doesn’t have the career length of Gossage, but long enough, I think, to warrant a borderline Hall selection.
Here we come to the same type of problem I raised concerning Bob Lemon’s walks. As I’ve tried to argue several times over the past few years, retrospective statistical formulas like WAR, whether intentionally or not, end up promulgating a one-size-fits-all solution to evaluation. Fingers’ pathetic HOS score of 53, given your penetrating breakdown of his outings, appears almost a slight approaching libel of character. I’ve haven’t written this for a while, but here it is, taken out of mothballs: the devil is in the details. Obscuring differences leads to unintended results that obscure rather than illuminate. And the solution to the problem isn’t adjusting the formula through some mathematical correction based on whatever mathematical correlations the mathematician decides is correct. All you get is another one-size-fits-all solution.
Seems like I’m talking in circles here. Let’s try “Failing to account for pertinent differences leads to unintended results that obscure rather than illuminate.” Also, how about “whatever mathematical correlations the mathematician decides are correct.”
Bob Eno: I’m up on you two to one.
Sorry, nsb, I’ve been tracking your slips and corrections for years. When it comes to blockheaded typos and grammatical solecisms, you’re simply not in my calss.
nsb’s right: Fingers is much undervalued by advanced stats because the context in which he pitched was ephemeral, and the distortions were never understood or corrected. (At least the distortions that pertain to closers are now being recognized, though no mathematical solutions have been found — Adam Darowski has a great reply to nsb’s complaint about Fingers’ rating, “I’m also not happy yet with how the Hall of Stats handles relief pitchers.”)
But I don’t think Doug’s description of Fingers’ performance changes the equation. I think he has given us a narrative about Fingers that is less impressive when contextualized, not more. For example, if we look at IP per Relief Game:
Rollie Fingers: 1.66 (907 G) WHIP 1.132
Goose Gossage: 1.61 (965 G) WHIP 1.197
Sparky Lyle: 1.55 (899 G) WHIP 1.275
Mike Marshall: 1.80 (700 G) WHIP 1.274
John Hiller: 1.92 (502 G) WHIP 1.207
Bill Campbell: 1.70 (691 G) WHIP 1.316
Tug McGraw: 1.66 (785 G) WHIP 1.228
Ron Perranoski: 1.59 (736 G) WHIP 1.331
Fingers certainly plays a leading role among this group of pitchers, who were used more or less in similar ways. His IP/G rate was fourth among this group of eight, but he was called on more than all but Gossage, and his WHIP rate was best. But Fingers, or Fingers and Gossage, are very much members of a peer group of Firemen, not outliers, although each had spectacular seasons (Gossage in ’75 is most amazing, but Hiller in ’73 is close behind — I don’t know what to do about post-season records, where opportunities are unequally distributed. . . . They count in the narrative, but in a selective way).
Fingers’ seven-year stretch in 1972-78 is indeed terrific — 493 G-Relief (70.4/yr.); 858 IP; ERA+ 132 — but in its own way, Marshall’s five-year run in 1971-75 is almost equivalent: 387 G-Relief (77.4/yr.); 724 IP; ERA+ 127. (As a reliever, Fingers never pitched more than 134 innings in a season, Gossage 141; Marshall had seasons of 208 and 179 IP.)
I think of this group I’d rate Gossage as best and Fingers second. But consider this six-year stretch:
223 G; 1633 IP; 7.32 IP/G; WHIP 0.970
Obviously a starting pitcher, not a reliever, with many fewer games, but eating as many IP in six seasons as all the relievers on the list above did in their career relief roles, generally of twice as many seasons or more. And Koufax just barely makes the Hall according to advanced stats (virtually none of the voters saw him as a borderline case, however). That’s pitcher abuse.
To me, the question is not whether Gossage or Fingers was the best reliever of the Fireman era: they probably rank 1, 2. For me, the question is whether they were Hall quality pitchers, and it’s very difficult to read that out of the roles that they played in the short history of the Fireman. Neither was to Firemen what Rivera was to Closers. And as I pointed out in an earlier comment, Rivera was Smolzian in his quality as a Closer, and we know that Smoltz was a fine, but not an inner circle Hall pitcher (HoS: 136).
Now, if the idea is to regard relief pitchers as a separate position with lower quality expectations, that changes the story: then, sure, the guys in the Hall now belong there (as does Wagner). But in most cases, until very recently, they were assigned to the relief roles because they were judged to be of lower quality, and a certain number found that the demands of that role precisely fit what their arms could do (Eck being the clearest example). That’s the “era context” in which I think we have to view the Firemen — not that they were abused because they were worked more than contemporary closers, but because they were able to succeed because less was demanded of them than starters. (Mike Marshall at his peak is an exception; his demand was that he bear the same burden as a starter on a season basis. However, it was Marshall who made the demand: if you remember his story, he had some theories about it all. That was really a case of pitcher self-abuse, but something seems not quite kosher about saying it that way.)
Meanwhile, pitchers capable of going the distance, but falling short of Hall standards as starters — say, Billy Pierce or Bret Saberhagen, for the purposes of this string — clearly were denied that their shots at the Hall, undermined by the fact that their superior talent kept them in the starting rotation, when they could have been leading outliers among Firemen. Put either Pierce or Saberhagen in a Fireman role and I think the most credible speculation is that they would have far outperformed the pitchers on the list here, at least on the basis of talent. So, in the end, I think the issue is less about stats than it is about what criteria we want to conceive for the Hall. My problem with the Firemen inductees is that the voters who brought them in did not have sufficient historical perspective to assess what their role was all about. I think today’s best closers, and relievers in general, are simply more talented. If we were in the 1990s, we’d know less and I think Doug’s narrative would be more convincing. Of course, we can also decide to think about our Hall selections using that point of view, the one that makes Pie Traynor a shoo-in.
Wonderfully reasoned, as always, Bob.
I might part company with you when you conclude, I think, that relievers probably shouldn’t really be celebrated (be it HOF, COG or whatever) since they are relievers because they weren’t good enough to be starters. They probably also weren’t good enough to be outfielders or third basemen, either, but I don’t think that’s what’s germane. Rather, these pitchers are on a ball club because they fill a role that the club values. And, the best relievers are entrusted with arguably one of the most important roles – preserving wins.
How that role is fulfilled has changed over time. In the fireman era, it was usually one trusted reliever who would finish a game for a tiring starter, whether that be for one, two, or three innings. Now it’s two or three such pitchers, with defined sub-roles, that share that task, a necessity in a time when the complete game has virtually disappeared.
So, should we celebrate the best of such pitchers? Ultimately, that will be a judgment call for each person, as to whether one believes preserving wins to be a value and important role for a pitcher. In the case of Rivera, he separates himself so clearly and so substantially from all other relievers, like the Ruth or Bonds of relievers, his recognition can’t be denied. But, we don’t just celebrate Ruth or Bonds, do we.
It is, admittedly, difficult to quantify the performance of the best relief pitchers, those entrusted with preserving wins, not least because of how that role has morphed from a single, primary reliever to a team approach that has separated a difficult task in easier sub-tasks. In recent times, the focus has been on the particular sub-task of closing rather than putting out fires, so it seems you almost have to separate relievers into two classes, before and after 1985, perhaps, just to pick a dividing line. That said, it doesn’t seem to me unwarranted to identify the two or three best of each era, about one per decade or so, that would be worthy of recognition.
Well, Doug, I’ve probably fired all the ammo I’ve got, and your position is still standing. I guess I’ll just have to dig some works and camp the troops in place, awaiting a future call to battle on somewhat different ground.
Apart from the DH, which has its own problems, relievers are probably the toughest cases for assessment. As you say, they play a valuable role. But what does “role” mean? Every position player plays a unique role in the game and we judge them differently according to role. But those differences are peripheral, because the unique role pertains only to fielding, and for most players, the greater part of their value comes from contributions in the common role of hitter. Pinch hitters are, in some ways, the equivalents of relief pitchers, but it is too ephemeral a contribution to regard as a role in the sense of regular fielding-hitters. (Defensive replacements are another role, but few players occupy it on a regular basis over many seasons.) Only when you have the DH, who “pinch hits” four or five times a game does pinch hitter rise to the level of a role, and it’s very hard to now what to make of it, because it’s a role without the distinctive feature of position player roles, a position. It’s a role defined by what it isn’t.
Relievers are a role in the sense of traditional pinch hitters, but with more sustained contributions (although not always). But what is their unique distinction from other pitchers? They play the same fielding position; they bat if their turn in the order comes up, unless a pinch hitter or DH displaces them, just like other pitchers; they pitch, just like other pitchers. What’s different is not captured by the fact that they field, hit, and pitch. So the nature of what “role” means in the case of relief pitchers is fundamentally different from what we mean when we speak about all the other roles in the line-up,
So what our disagreement boils down to may be that you see relief pitching as a role and I see it as a “role.”
Set off the fireworks!
I’d like to celebrate Independence Day by returning to an issue discussed on the last thread: the third in Mike Hoban’s CAWS series. The issue concerns the design of an ideal one-number metric for a Hall monitor. (It has just struck me for the first time how silly it sounds to talk about “Hall monitors” — after high school, anyway.) A couple of days ago, mosc left a very (a href=”http://www.highheatstats.com/2019/06/caws-career-gauge-part-3/#comment-142724″>interesting comment on that issue in response to one of mine, and lying as it is in the middle of a string that effectively closed last month, I think his points will be missed. I want to note two, agreeing with one and not the other.
mosc recalls that he and Doom at one time devised a system that, if I understand it in essential concept, involved counting a player’s poorest solid (WAA-positive and substantive) season once, the next poorest twice, and so on, so that best season is counted as many times as the number of WAA-positive seasons. I had thought of doing that using WAR when I experimented with a design last string, but the labor involved in typing all that data for each player into Excel simply seemed too daunting. I think it’s the right idea, though, because it eliminates the arbitrariness introduced by metrics like Peak-5, Best-7 or CV (Best-10). That’s the point I agree with.
The second point is that mosc (and Doom) advocate using WAA+, rather than WAA: that is, all below-average seasons are simply eliminated from the overall assessment. Here’s mosc’s explanation: “I personally cannot stand to see so many players penalized for wanting to hold on to baseball as long as possible. A replacement level 40-year old future hall of famer struggling to hold onto a roster spot should in no way diminish his previous accomplishments. That drive that was so necessary to eclipse the field during their prime does not magically go away as their bodies age.” This is the point I disagree with, although I think I fully understand the feeling mosc is expressing.
I’ve argued this point quite often with Doom. I can’t say who prevailed. Obviously, we all agree that when considering successful players, we should weight their best seasons more heavily than others. One of my arguments against writing off seasons so poor that they are in WAA-, or even WAR- territory has been that everything that happens on the field during a player’s career should count because it really happened and the player was responsible for it. I’ve also argued that players the 40-year-future Famer with negative numbers is not contributing positively to any team other than a very weak non-contender, and is creating negative value for his team and teammates on average and contending teams.
But one argument I have not used is this: In the context of a Hall of Fame monitor is irrelevant to truly great players. There has never been a player near the Inner Circle whose career decline would place in jeopardy his Hall credentials. The only players for who WAA- seasons would have an impact are players on the margin: a position player like Lou Brock, whom the HoS puts well underwater anyway, and whom CAWS actually does not calculate as having Hall numbers, or Don Sutton, whom the HoS likes (it’s based on WAR and WAA+) and CAWS places right on the edge. These are not players who ever “eclipsed the field”; these are compilers, who stay in the game precisely in order to reach counting numbers that will lock in their Hall cases. (Or, alternatively, want to play our lucrative contracts.)
Sure there are great players who can’t let go: Willie Mays is a great example. But those painful last seasons have virtually no effect on his career stats if they’re included. Craig Biggio would be a more controversial example: a player whose WAA- seasons lower him just below the bar by some measures, but whom most of us will push over the line because of the narrative arc of his career: a player successful all over the diamond, even as a catcher. That seems to me to be the way to deal with this issue in the context of Hall monitors: don’t pretend that any part of the career doesn’t count; count it and then, if necessary, assess whether there are good arguments for overriding the number. In the case of a Biggio, I’d hope the vote would be “yes”; in the case of a Brock I’d say “no.”
But mosc and Doom have eloquently expressed the opposing view. I have my own personal view, but I still hope that this issue and others connected with the construction of a good Hall monitor (picture a robot scanning student passes) can be the subject of more discussion here.
That idea of mosc’s and Doom’s seems like an interesting approach.
Any thoughts on what a “substantive” WAA level should be?
Well, first, I see I botched hyperlink (nsb, are you counting?). You can still cut-and-paste, though, so no harm done, I hope.
I may have misrepresented mosc. The phrase he used was not “solid” or “substantive season,” which is how I understood him. The phrase was, “the longest relevant timeframe.” His example (Willie Mays) suggests he just meant, “till you exhaust all WAA+ seasons.” But since there’s an issue of contiguity in “timeframe,” I wonder whether, had Mays tacked on a few successful at bats in 1974, after a WAA- season, they would have figured in mosc’s or Doom’s calculations. It’s up to mosc, since my choice would be to use WAR, negatives and all.
But I think I’ve come up with a good metaphor for mosc’s point — at least it illustrates his point for me. If you think of great classical pianists. some of them died in their prime, some of them retired at a seemly age, and some of the just kept on going even when the batteries ran low. When I was young, my favorite concert pianist was Artur Rubinstein, and I’d go hear him year after year. But he kept performing till he was about 90, and there came a concert where I said: “That’s it: he may keep going, but I won’t.” It was pretty awful. Yet that actually has no effect on the way I consider the quality of Rubinstein as a one of the greatest pianists of the last century. It only mattered for the couple of years that I was thinking, “Jeez, I wish he’d retire and stop embarrassing himself.” He wasn’t embarrassed: he liked adulation, he liked performing; he liked money. I think mosc is looking at, say, Albert Pujols, the way I look at Rubinstein.
I could poke some holes in the analogy, but the purpose was to illustrate the force of mosc’s argument, so I’ll leave it there.
My problem is this: I don’t think WAA is any better—truer, less likely to be based on assumptions that are not accurate in every circumstance— than is WAR or conflations of it with other formula-based valuative systems.
In the notorious 1996 campaign, Roger Clemens went 10-13, and the Red Sox went 14-20 (.411) in his appearances. Yet he was awarded 5.4 WAA based on a waaWL% of .659. That is, according to the formula, an average team would have played at a .659 winning percentage in the games he started. Were the Red Sox a substandard team that year to have won at just a .411 percentage in those games? Without Clemens on the hill they were 71-57 or .554. To me there seems an absolute disconnect between reality and statistical analysis here.
The BoSox provided Clemens an average of 4.29 R/G. An average team in the 1996 AL scored 5.39 R/G. That’s why an average team with Clemens pitching would have had a .659 winning percentage. It’s not that the BoSox were below average (they scored 5.72 R/G); it’s that they were below average when Clemens was pitching.
Given Clemens’ opponents and park, the average pitcher’s RA/9 was 6.07, Clemens’ rate was 3.93. That’s why advanced stats thinks he was pretty good, while his W-L suggests he was mediocre.
I don’t see the disconnect. I think you’re looking at stats that tell a misleading story.
Here we come down to the problem that plagues me about the use of the term Wins. “Wins” above replacement, “Wins” above average. The only wins that count are the ones that show up on the scoreboard at the end of the game. I don’t doubt that Clemens was occasionally run-deprived overall during the season compared to others (although not particularly game by game), but considering his performance in a similar season, 1992, I see what to me can’t be explained away by the magic of numbers:
1992: 246.2 IP; 18-11 (team 21-11); 2.41 ERA; 203 H; 80 R; 66 ER: 62 BB; 174 ERA+; 2.54 FIP; 1.074 WHIP; 4.06 Run support (highest—2 games with 9); team record 73-89, 51-78 minus Clemens
1996: 242.2 IP; 10-13 (team 14-20); 3.63 ERA; 216 H; 116 R; 98 ER; 106 BB; 139 ERA+; 3.43 FIP; 1.327 WHIP; 4.29 Run support (2 games with 9 and 2 with 11); team 85-77, 71-57 minus Roger
Well, for those of us uninitiated into the mysteries, it looks like—Clemens vs Clemens—he had a huge deficit in effectiveness despite having more runs scored for him. Allowed just a few more hits but 46 more walks, 32 more earned runs, declined in ERA+ by 35 points, while his FIP increased by .89, his WHIP by .253, this for a team that had a middling good W-L, in contrast to the cellar dwelling ’92 squad.
WAA: 1992 6.4; 1996 5.4.
If Clemens was 5.4 “Wins” above average, it’s a darn good thing the Red Sox didn’t have an average pitcher in his place, producing a 4.6-18.4 record. Buts that’s only if ‘Wins” means, you know, WINS.
nsb, In 1996, Clemens was pitching in an environment where teams were scoring 5.59 R/G; in 1992, they were scoring 4.32 R/G. The ’96 BoSox upped their game and scored 0.20 more R/G for Clemens than they did in ’92, but the league upped its average 1.37 R/G.
In ’92, Clemens allowed only 2.92 R/9IP while the teams he faced averaged 4.32 (4.86 when adjusted for park factors). That’s great. In ’96 he allowed 3.93 R/9IP while the teams he faced averaged 5.42 (6.07 adjusted). (Let’s ignore for now the fact that the Sox of ’96 have a much worse fielding record than the Sox of ’92: it shows in advanced stats, not fielding percentage, and you’re clearly in the mood to dismiss advanced stats.) Basically, Clemens reduced opposition productivity by about 40% in 1992 and 35% in ’96 — but let’s avoid advanced stats like park factors, and just use R/9: those figures become 32% and 27%. That’s how he did his job. His team produced runs for him at rates of 94% of league average in ’92 and 80% of league average in ’96. That’s how his teammates did their jobs. Clemens was a little worse in ’96; his teammates were a lot worse. Consequently, Clemens got the wins his pitching warranted in ’92 and didn’t in ’96.
If you want see a disconnect, look at the figures you cite for ERA+. In 1996 Clemens’ ERA+ is almost 40% above average. Oh, skip park factors and just use traditional stats: his ERA was 27% better than league average, just like his R/9 average. You seem to ignore that and point to his W-L Pct. 6.5% below average as the actual value of Clemens’ pitching.
In ’96, in the games Clemens started, the Sox faced teams with run productivity slightly above average, and in those games the Sox produced runs at 79% of their opponents’ season averages, half of those games being in a park that boosted hitting by 6% that season. And, just to clarify, traditional stats have the Sox tied for the worst fielding in the league, about 20% worse than average. So if an average pitcher had been on the mound, how surprising would it have been if they had lost about 18 of 23 decisions?
You know how all this works, nsb. Your posts on this string have me puzzled.
Looking again, I over-simplified mosc’s description of his method. I think the formula should look like this, with S1 meaning best season, second best S2, etc.
S1/1+(S1+S2/2)+(S1+S2+S3/3) . . . . (S1 . . . SN/N)
I realized when watching my cat cower at the neighbors’ fireworks that the way I’d (mis)represented it wouldn’t work.
I’m not convinced that this will give adequate weight to players with short careers. (Doom and I once had an argument over who contributes more, a player who’s retired or one who’s resisting retirement and playing poorly, and Doom chose the latter, so he wouldn’t see this as a problem.) In the ersatz-but-not-entirely-ersatz formula I developed last string (the one I once again named WARQ), I had one factor, worth 16.7% of the total, that was (WAR/502PA*20)/3, which was WAR rate multiplied by the average number of seasons that great players have compiled, regardless of how many seasons a particular player actually played. What I was searching for was an appropriate weight to give to average quality despite the length and trajectory of a player’s career (the *20 was meant to boost brief bright flames, and the 16.7% was meant to limit their total wattage). Doom doesn’t like to use the rate stat at all, and I suppose mosc would agree.
Thanks Bob,
I’ll try some spreadsheet magic and see if I can compute it reliably.
When it’s written (s1+s2+ … sn / n), do you suppose it’s really meaning (s1+s2+ … sn) / n ?
If you check post, Doug, I think he means it the way I wrote the formula. I could be wrong . . .
Oh. Yes, you’re right.
Thanks Bob,
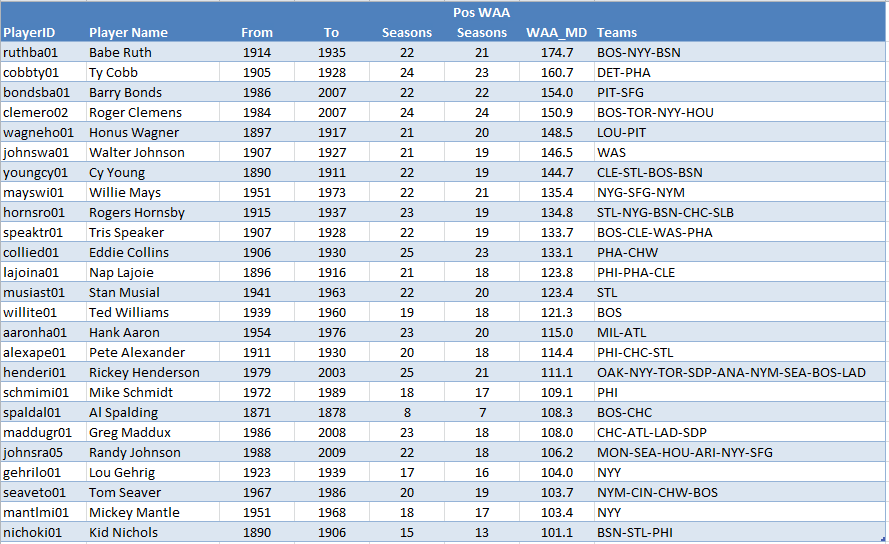
Here are the results, using WAA from Baseball Gauge and counting only positive WAA seasons.
The top 25 look like this.
Wow! Your computer is bigger than mine. (Well, actually, your understanding of how to do this efficiently is bigger than mine. Way bigger.)
The Top 25 list looks reasonable, though the inclusion of Spalding is an alert that true “Pioneer” players are going to have skewed standing in the list. The Hall of Stats doesn’t even include National Association players.
But if you go down further, things get pretty strange. Let’s say the cutoff for consideration is 20.0 WAA_MD (not sure what “MD” means). That would give us 886 qualifying players (Vic Wertz is #886). Why go down so low when the Hall only includes 232 players now? Because some current Hall members show up there. For instance, Red Schoendienst comes in with 20.7 WAA_MD, good for #831. Still, he’s two slots above Derek Jeter, #833 (it’s 20.74 to 20.73). Maybe we should rethink Jeter in the CoG . . .?
Here is another surprise: Lou Brock, 23.69, #701, just behind Gary Templeton, 23.70.
But this seemed so odd that I took a look at the numbers in detail. A lot rests on the Gauge’s figures. If you use B-R’s figures, Brock comes out with 26.07 and Templeton 18.73. Brock is still trailing in the dust in terms of the overall list, but the weird anomaly of ranking Templeton above him decisively disappears.
I also checked to see what was up with Jeter, and B-R is far more generous than the Gauge: 53.84 vs. 20.73! (Still, it looks to me as though B-R is also more generous at the top, so it’s hard to predict how rankings will change — but we know Jeter will go from far behind Brock to far, far ahead.)
The Gauge’s figures gives us more anomalies, which I don’t have time to check.
Roy Campanella, 23.96, #696, just edging out Dickie Thon
Earl Averill, #641, just behind Sherm Lollar
Herb Pennock, #388, just behind Derek Lowe
Craig Biggio, #353, just ahead of Andrew McCutchen
Tony Gwynn, #300, just behind Jake Peavy
Darrell Evens is #115 (57.3), while Dwight Evans is #352 (36.3)!
Of course, I’m delighted to see Bill Dahlen at #42, between Steve Carlton and Frankie Frisch. (Bobby Wallace is #102.)
We’d really need to see what happens with B-R figures, but I don’t see this as a promising initial test.
MD is mosc-Doom.
Of course.
I’ve updated the link with some more information.
The multiplier (ratio of gWAA_MD to gWAA_Pos) has quite a range, from infinitesimally more than one (generally for players with 2 positive WAA seasons, with the second barely so) to over 2 for a few players. Among notable players (10 or more positive WAA seasons), the highest multiplier is 2.07 for Red Faber and the lowest is 1.20 for Pie Traynor.
This is going to take a while to study, Doug. The ratios you point to concern the impact of the WD system, which is one issue. For example, Faber’s high ratio seems to be due to his career profile: he has exactly two top seasons, according to gWAA (7.6, 5.7), then his ratings fall off a cliff (1.8, 1.7 . . .). Those two top years are components of 16 seasons in WAA+ territory, increasing their weight and accounting (I think) for the top-heavy ratio. (In bWAA, the series goes: 8.1, 6.0, 1.5, 1.5, 1.5 . . . .)
Another issue is the simple ratio of WAA+ and WAA-, which, I think, ought to affect how we thing about individual players. To pick on Lou Brock again (sorry, Lou!), if you use the Gauge’s figures (which I’m skeptical of), Brock actually has more seasons in negative WAA territory (10) than positive (9). How reasonable is it to assess a player like that only on his positive seasons? (Actually, I see B-R rates 11 of his seasons as WAA-: Whew!)
I’ve looked through the list of Gauge WAA+ (MD) to identify borderline Hall cases, using the standard that the top 232 qualify. For the purposes of our interests, I’ve removed all players who played the majority of their careers before 1893, when the mound position was reconfigured and Major League baseball came to resemble the modern game — there were 23 of these players, ranging from consensus greats like Cap Anson to more obscure figures like Jim Whitney. Whatever their fame, the stats of the pre-1893 era simply are not comparable to later stats, particularly for pitchers. (Adam Darowski subjects them to major modifications before including them in the HoS; I just dodged the issue.)
Here are the last 10 players in and the first 10 players out according to the mosc-Doom system, bearing in mind that we’re using Baseball Gauge WAA, which is significantly different from B-R WAA.
Last 10 in:
Cy Seymour
Hippo Vaughn
Robinson Cano
Miguel Cabrera
Dizzy Dean
Chief Bender
Jack Stivetts
Todd Helton
Frank Tanana
Joe Kelley
First 10 out:
Duke Snider
Pee Wee Reese
Richie Ashburn
Sam Rice
Paul Molitor
Harry Brecheen
Eddie Muray
Ron Cey
Jose Rijo
Edgar Martinez
Here’s a partial list of what seem to me surprising choices who are in (original rank out of 255, including the earlier 19th c. players, in parens – in a few cases, it’s the high rank alone that’s surprising to me):
Hal Newhouser (49)
Joe Tinker (67)
Jimmy Sheckard (82)
Art Fletcher (105)
Sherry Magee (108)
Cole Hamels (161)
Early Wynn (174)
Jose Cruz (176)
Charlie Keller (186)
Norm Cash (203)
George Uhle (214)
George Burns (the Giant, 230)
Ron Guidry (236)
Brian Giles (240)
Kenny Rogers (245)
Here are some additional players on the outside who are surprising to me (I’m listing them in order, but not with a rank, except first and last – I’m skipping catchers: I’m sure mosc and Doom would add a catcher bonus):
Pete Rose (283)
Hugh Duffy
Burleigh Grimes
Larry Doby
Craig Biggio
David Ortiz
Dave Winfield
Jose Canseco
Tony Oliva
Ichiro Suzuki
Fred Lynn
Luis Aparicio (1115 – I stopped here)
Maybe the furthest stretch here is Joe Tinker, ranked at #67 (68.0 on the MD scale), and Aparicio at #1115 (17.0). The WAR stats are 53.1 and 55.8, respectively.
Seems like the MD method seems rather prone to signifcant distortions, at least using the Gauge WAA.
I’ll see if I can get Doom or mosc to join the discussion.
I ran the formulas for Tinker and Aparicio using B-R WAA and things look much more reasonable. Tinker’s still well ahead, but by only 44.2 to 37.3. The HoS gives Tinker a smaller 103 to 94 advantage (which makes sense, since its basic formula is WAR+1.8*WAA+).
The real impact in this case comes from the switch from WAR to WAA. Aparicio gets three WAR+ seasons knocked off of his 18 (plus one WAR-), while Tinker loses only one WAR- season out of his 15. Tinker is actually just higher than Aparicio in WAR for the 14 seasons each registered a WAA+ figure: 53.0 to 52.5.
Although Aparicio has the better total WAR, Tinker’s total WAA (+ and -) is far higher: 30.4 to 20.5.
So using bWAA+, I think the mosc-Doom metric works pretty well. Most of the initial distortion seems to come from gWAA. But I’d want to understand more about why there’s such a divergence between bWAA and bWAR in the first place.
Although this string seems to be effectively closed, I want to append a generalized issue I see with the mosc-Doom method, one that grows out of reflecting on the Tinker/Aparicio contrast and the exceptionally poor showing of Lou Brock under the system.
The issue concern the toggle between WAA+ and WAA-neutral/-. Like all arbitrary thresholds, the toggle can introduce distorting results. Here is example:
Player A’s career WAA seasons: 9.0, 8.0, 7.0, 6.0, 5.0, 4.0, 3.0, 2.0, 1.0, 0,1, 0.1, 0.1, 0,1, 0.1, 0.1.
Player B’s career WAA seasons: 9.0, 8.0, 7.0, 6.0, 5.0, 4.0, 3.0, 2.0, 1.0, 0.0, 0.0, 0.0, 0.0, 0.0, 0.0.
Player A’s total WAA is 45.6; PLayer B’s total is 45.0: their contributions are virtually identical over 15 seasons. But because of the toggle between 0.1 WAA+ and 0.0 WAA, Player A’s final six seasons provide repeated proportions of credit from his best 9 seasons, while Play B receives no ongoing credit for his best 9 seasons. The result is this:
Player A’s WAA_MD total: 85.2
Player B’s WAA_MD total: 63.0
This exaggerated hypothetical seems to have real impact in cses such as Lou Brock’s. Under bWAA, more than half of Brock’s seasons fall below the threshold and accrue zero credit. Penalizing him for those seasons by adding the negative WAA makes sense to me. But zeroing out those seasons, and providing Brock no ongoing credit for his best seasons, while giving other players with fractional WAA+ season after season of significant credit for their best seasons is what leaves Brock trailing in rank hundreds of places below players who may have contributed less total WAA.
Bob, you have hit the nail squarely on its head.