
August’s AL Pitcher of the Month was the Blue Jays’ Bowden Francis. If you’ve never heard of him, you’re not alone. Despite that lack of notoriety, Francis, whose career totals prior to August included just 81⅓ IP and four starts, has turned in two of the more remarkable months of pitching of the modern era. More after the jump.
Francis’s season hardly began like one in which he was likely to be named Pitcher of the Month. Prior to this season Francis had pitched only 37 innings, all in relief, yet found himself in the starting rotation as the season began. That experiment was short and painful, with Francis demoted to the pen after two horrific outings, and then back to the minors before April was done. He returned to the Blue Jays in June and made 11 appearances, 10 in relief, with a 4.13 ERA, hardly suggesting what was to happen next.
When Toronto dealt Yusei Kikuchi to the Astros at the trade deadline, Francis returned to the rotation. Beginning with his second start in August, Francis ran off this string of 7 starts.
| Rk | Gcar | Gtm | Date | Tm | Opp | Rslt | Inngs | Dec | DR | IP | H | R | ER | BB | SO | HR | HBP | BF | Pit | Str | StL | StS | GB | FB | LD | PU | Unk | GSc | SB | CS | 2B | 3B | GDP | SF | ROE | WPA | RE24 | Entered | Exited | |
|---|---|---|---|---|---|---|---|---|---|---|---|---|---|---|---|---|---|---|---|---|---|---|---|---|---|---|---|---|---|---|---|---|---|---|---|---|---|---|---|---|
| 20 | 41 | 120 | Aug 12 | TOR | @ | LAA | W,4-2 | GS-7 | W(5-3) | 4 | 7.0 | 1 | 1 | 1 | 0 | 8 | 1 | 0 | 22 | 81 | 57 | 16 | 9 | 6 | 8 | 0 | 1 | 0 | 79 | 0 | 0 | 0 | 0 | 0 | 0 | 0 | 0.290 | 2.52 | 1b start tie | 7b 3 out a3 |
| 21 | 42 | 125 | Aug 18 | TOR | @ | CHC | W,1-0 | GS-7 | W(6-3) | 5 | 7.0 | 3 | 0 | 0 | 0 | 7 | 0 | 0 | 25 | 95 | 71 | 16 | 13 | 8 | 10 | 1 | 3 | 0 | 78 | 0 | 0 | 1 | 0 | 0 | 0 | 0 | 0.497 | 3.49 | 1b start tie | 7b 3 out a1 |
| 22 | 43 | 131 | Aug 24 | TOR | LAA | W,3-1 | GS-9 | W(7-3) | 5 | 8.0 | 1 | 1 | 1 | 3 | 12 | 1 | 1 | 28 | 117 | 84 | 20 | 15 | 4 | 8 | 1 | 1 | 0 | 85 | 0 | 0 | 0 | 0 | 1 | 0 | 0 | 0.426 | 2.87 | 1t start tie | 9t — 0 out a2 | |
| 23 | 44 | 136 | Aug 29 | TOR | @ | BOS | W,2-0 | GS-7 | W(8-3) | 4 | 7.0 | 1 | 0 | 0 | 0 | 5 | 0 | 0 | 22 | 70 | 51 | 15 | 6 | 3 | 14 | 3 | 4 | 0 | 80 | 0 | 1 | 0 | 0 | 0 | 0 | 1 | 0.462 | 3.63 | 1b start tie | 7b 3 out a2 |
| 24 | 45 | 141 | Sep 4 | TOR | PHI | L,2-4 | GS-6 | L(8-4) | 5 | 6.0 | 6 | 3 | 3 | 0 | 6 | 2 | 1 | 24 | 89 | 61 | 11 | 14 | 10 | 7 | 1 | 1 | 0 | 54 | 0 | 0 | 0 | 0 | 1 | 0 | 0 | -0.030 | -0.11 | 1t start tie | 6t 3 out d1 | |
| 25 | 46 | 147 | Sep 11 | TOR | NYM | L,2-6 | GS-9 | 6 | 8.0 | 1 | 1 | 1 | 1 | 1 | 1 | 2 | 28 | 111 | 68 | 11 | 9 | 5 | 19 | 5 | 6 | 0 | 76 | 0 | 0 | 0 | 0 | 0 | 0 | 0 | 0.228 | 2.85 | 1t start tie | 9t — 0 out tie | ||
| 26 | 47 | 152 | Sep 18 | TOR | @ | TEX | L,0-2 | GS-6 | L(8-5) | 6 | 6.0 | 5 | 2 | 2 | 1 | 6 | 1 | 1 | 25 | 100 | 65 | 18 | 9 | 3 | 14 | 7 | 0 | 0 | 59 | 0 | 0 | 1 | 0 | 0 | 0 | 0 | 0.021 | 0.85 | 1b start tie | 6b 3 out d2 |
The totals are 49 IP with a 1.47 ERA, allowing only 18 hits and 5 walks, and holding hitters to a .110 BA and .161 OBP. Included were two games in which Francis took a no-hitter into the 9th inning. So you may be thinking “Okay, he was on a hot streak, but lots of pitchers have hot streaks, so what’s the big deal?” to which the response is that Francis’s hot streak is historically good, among the top 10 of the modern era for fewest hits and baserunners allowed.
Here’s where Francis ranks in the modern era for fewest hits allowed while averaging 7+ IP over spans of different lengths. I invite you to click on the links to see the company Francis is keeping, but suggest you open the links in new tabs and be patient as the queries may take a minute or more to return a result. Note that the two ranks shown are for all spans of the indicated length (potentially including overlapping spans for the same pitcher), and for the same but with overlapping spans removed.
- 3 games – 5 (T-15th/T-13th)
- 4 games – 6 (2nd/2nd)
- 5 games – 12 (T-9th/T-8th)
- 6 games – 13 (T-1st/T-1st)
- 7 games – 18 (T-2nd/T-2nd)
Here are the top 10 streaks for fewest hits over 7 games and 49+ IP (the gaps in the rank numbers indicate overlapping streaks that I’ve removed).
| Rk | Player | Team | Span Started | Span Ended | H | IP | W | L | GS | SV | BSv | CG | SHO | GF | IP | Dec | W-L% | ERA | H | R | ER | UER | HR | BB | IBB | SO | HBP | BK | WP | BF | BR | Ind. Games Link |
|---|---|---|---|---|---|---|---|---|---|---|---|---|---|---|---|---|---|---|---|---|---|---|---|---|---|---|---|---|---|---|---|---|
| 1 | Johan Santana | MIN | 2004-07-01 | 2004-08-01 | 16 | 54.0 | 4 | 2 | 7 | 0 | 0 | 1 | 1 | 0 | 54.0 | 6 | .667 | 1.33 | 16 | 10 | 8 | 2 | 6 | 16 | 0 | 73 | 3 | 0 | 3 | 193 | 36 | Games List |
| 2 | Bowden Francis | TOR | 2024-08-12 | 2024-09-18 | 18 | 49.0 | 4 | 2 | 7 | 0 | 0 | 0 | 0 | 0 | 49.0 | 6 | .667 | 1.47 | 18 | 8 | 8 | 0 | 6 | 5 | 0 | 45 | 5 | 0 | 0 | 174 | 29 | Games List |
| 3 | Justin Verlander | HOU | 2019-04-19 | 2019-05-21 | 18 | 49.1 | 6 | 1 | 7 | 0 | 0 | 0 | 0 | 0 | 49.1 | 7 | .857 | 1.64 | 18 | 9 | 9 | 0 | 8 | 11 | 0 | 59 | 1 | 0 | 0 | 178 | 31 | Games List |
| 5 | Whitey Ford | NYY | 1955-08-19 | 1955-09-11 (2) | 19 | 53.1 | 4 | 1 | 6 | 1 | 0 | 5 | 1 | 1 | 53.1 | 5 | .800 | 1.18 | 19 | 9 | 7 | 2 | 4 | 27 | 3 | 30 | 0 | 0 | 2 | 201 | 47 | Games List |
| 6 | Ferdie Schupp | NYG | 1916-09-05 | 1916-09-28 (2) | 19 | 56.0 | 6 | 0 | 6 | 0 | 0 | 6 | 4 | 1 | 56.0 | 6 | 1.000 | 0.32 | 19 | 4 | 2 | 2 | 1 | 10 | 0 | 26 | 1 | 0 | 0 | 194 | 33 | Games List |
| 8 | Ed Reulbach | CHC | 1906-08-17 | 1906-09-14 | 19 | 52.1 | 6 | 0 | 6 | 0 | 5 | 3 | 1 | 52.1 | 6 | 1.000 | 0.00 | 19 | 2 | 0 | 0 | 0 | 11 | 29 | 4 | 0 | 0 | 184 | 34 | Games List | ||
| 14 | Randy Johnson | ARI | 2004-04-16 | 2004-05-18 | 20 | 50.0 | 4 | 3 | 7 | 0 | 0 | 2 | 2 | 0 | 50.0 | 7 | .571 | 1.62 | 20 | 12 | 9 | 3 | 3 | 9 | 0 | 68 | 2 | 0 | 1 | 181 | 33 | Games List |
| 15 | Mario Soto | CIN | 1984-05-02 | 1984-06-06 | 20 | 51.0 | 5 | 0 | 7 | 0 | 0 | 4 | 0 | 0 | 51.0 | 5 | 1.000 | 1.94 | 20 | 12 | 11 | 1 | 6 | 18 | 0 | 48 | 0 | 0 | 2 | 189 | 42 | Games List |
| 16 | Ewell Blackwell | CIN | 1950-08-28 | 1950-09-20 (1) | 20 | 53.1 | 4 | 2 | 6 | 1 | 0 | 6 | 1 | 1 | 53.1 | 6 | .667 | 1.18 | 20 | 10 | 7 | 3 | 1 | 25 | 1 | 36 | 3 | 0 | 1 | 205 | 52 | Games List |
| 17 | Claude Hendrix | CHI | 1914-08-31 (2) | 1914-09-15 | 20 | 50.0 | 5 | 0 | 5 | 0 | 4 | 2 | 2 | 50.0 | 5 | 1.000 | 0.36 | 20 | 6 | 2 | 4 | 0 | 10 | 0 | 23 | 0 | 0 | 1 | 178 | 30 | Games List | |
| 18 | Rube Marquard | NYG | 1911-08-14 (1) | 1911-09-02 | 20 | 50.1 | 5 | 0 | 6 | 1 | 5 | 2 | 1 | 50.1 | 5 | 1.000 | 0.36 | 20 | 8 | 2 | 0 | 0 | 13 | 0 | 53 | 1 | 0 | 0 | 186 | 34 | Games List | |
| 19 | Jimmy Dygert | PHA | 1907-09-12 | 1907-10-03 | 20 | 49.0 | 6 | 0 | 6 | 0 | 5 | 2 | 1 | 49.0 | 6 | 1.000 | 0.00 | 20 | 7 | 0 | 0 | 0 | 11 | 38 | 3 | 0 | 0 | 164 | 34 | Games List |
For fewest baserunners allowed, the results are even sightly better, again while averaging 7+ IP over:
- 3 games – 9 (T-11th/T-11th)
- 4 games – 11 (2nd/2nd)
- 5 games – 18 (T-6th/T-6th)
- 6 games – 22 (1st/1st)
- 7 games – 29 (T-2nd/T-2nd)
Here are the top 10 streaks for fewest baseruneers over 7 games and 49+ IP, again with overlapping streaks removed.
| Rk | Player | Team | Span Started | Span Ended | BR | IP | W | L | GS | SV | BSv | CG | SHO | GF | IP | Dec | W-L% | ERA | H | R | ER | UER | HR | BB | IBB | SO | HBP | BK | WP | BF | BR | Ind. Games Link |
|---|---|---|---|---|---|---|---|---|---|---|---|---|---|---|---|---|---|---|---|---|---|---|---|---|---|---|---|---|---|---|---|---|
| 1 | Eddie Plank | SLB | 1916-07-17 | 1916-08-17 (1) | 28 | 49.1 | 4 | 2 | 6 | 1 | 4 | 2 | 1 | 49.1 | 6 | .667 | 1.09 | 21 | 9 | 6 | 3 | 2 | 6 | 17 | 1 | 0 | 0 | 175 | 28 | Games List | ||
| 2 | Bowden Francis | TOR | 2024-08-12 | 2024-09-18 | 29 | 49.0 | 4 | 2 | 7 | 0 | 0 | 0 | 0 | 0 | 49.0 | 6 | .667 | 1.47 | 18 | 8 | 8 | 0 | 6 | 5 | 0 | 45 | 5 | 0 | 0 | 174 | 29 | Games List |
| 3 | Christy Mathewson | NYG | 1909-08-21 | 1909-09-11 (1) | 29 | 49.0 | 5 | 1 | 6 | 1 | 5 | 3 | 1 | 49.0 | 6 | .833 | 0.00 | 28 | 10 | 0 | 0 | 0 | 1 | 26 | 0 | 0 | 1 | 171 | 29 | Games List | ||
| 4 | Justin Verlander | HOU | 2019-08-16 | 2019-09-17 | 30 | 49.1 | 4 | 2 | 7 | 0 | 0 | 2 | 1 | 0 | 49.1 | 6 | .667 | 1.46 | 23 | 8 | 8 | 0 | 5 | 6 | 0 | 66 | 1 | 0 | 0 | 173 | 30 | Games List |
| 5 | Claude Hendrix | CHI | 1914-08-31 (2) | 1914-09-15 | 30 | 50.0 | 5 | 0 | 5 | 0 | 4 | 2 | 2 | 50.0 | 5 | 1.000 | 0.36 | 20 | 6 | 2 | 4 | 0 | 10 | 0 | 23 | 0 | 0 | 1 | 178 | 30 | Games List | |
| 6 | Ed Walsh | CHW | 1910-08-04 | 1910-08-23 | 30 | 50.2 | 3 | 1 | 5 | 2 | 4 | 4 | 2 | 50.2 | 4 | .750 | 0.00 | 22 | 6 | 0 | 0 | 0 | 8 | 49 | 0 | 1 | 1 | 184 | 30 | Games List | ||
| 7 | Gerrit Cole | HOU | 2019-08-22 | 2019-09-24 | 31 | 50.2 | 5 | 0 | 7 | 0 | 0 | 0 | 0 | 0 | 50.2 | 5 | 1.000 | 1.42 | 24 | 9 | 8 | 1 | 4 | 7 | 0 | 90 | 0 | 2 | 3 | 181 | 31 | Games List |
| 8 | Justin Verlander | HOU | 2019-04-19 | 2019-05-21 | 31 | 49.1 | 6 | 1 | 7 | 0 | 0 | 0 | 0 | 0 | 49.1 | 7 | .857 | 1.64 | 18 | 9 | 9 | 0 | 8 | 11 | 0 | 59 | 1 | 0 | 0 | 178 | 31 | Games List |
| 10 | Clayton Kershaw | LAD | 2016-05-01 | 2016-06-04 | 31 | 55.2 | 6 | 0 | 7 | 0 | 0 | 3 | 3 | 0 | 55.2 | 6 | 1.000 | 0.81 | 27 | 5 | 5 | 0 | 1 | 3 | 0 | 69 | 1 | 3 | 0 | 191 | 31 | Games List |
| 11 | Jake Arrieta | CHC | 2015-08-30 | 2015-10-02 | 31 | 55.0 | 6 | 0 | 7 | 0 | 0 | 2 | 2 | 0 | 55.0 | 6 | 1.000 | 0.33 | 22 | 3 | 2 | 1 | 1 | 5 | 0 | 58 | 1 | 0 | 1 | 190 | 31 | Games List |
| 14 | Christy Mathewson | NYG | 1909-06-23 (2) | 1909-07-16 | 31 | 49.0 | 6 | 0 | 6 | 0 | 3 | 1 | 1 | 49.0 | 6 | 1.000 | 0.00 | 26 | 6 | 0 | 0 | 1 | 5 | 26 | 0 | 0 | 1 | 172 | 31 | Games List | ||
| 15 | Ed Walsh | CHW | 1908-09-21 | 1908-10-03 | 31 | 55.2 | 4 | 2 | 6 | 1 | 6 | 3 | 1 | 55.2 | 6 | .667 | 0.00 | 26 | 4 | 0 | 0 | 0 | 3 | 51 | 2 | 0 | 1 | 192 | 31 | Games List | ||
| 16 | Christy Mathewson | NYG | 1908-05-29 | 1908-06-23 (1) | 31 | 55.0 | 5 | 1 | 6 | 1 | 6 | 3 | 1 | 55.0 | 6 | .833 | 0.00 | 25 | 8 | 0 | 0 | 1 | 5 | 44 | 1 | 0 | 0 | 199 | 31 | Games List |
Obviously, Francis’s totals must be considered in terms of the innings he pitched, and pitchers in years past will have averaged considerably more than 7 IP per outing (or may be missing from these lists for that reason). Consider that caveat in how you choose to interpret these results.
For context, there have been 957 pitchers who recorded at least one season of the past twenty (since 2005) with 10 or more starts. Of these, only 254 (37%) recorded one or more spans of 7 games in which they averaged 7+ IP. That number, though, has declined dramatically during this period as shown below, to the point where fewer than 5% of pitchers since 2020 have recorded such a span in a season of 10+ starts.
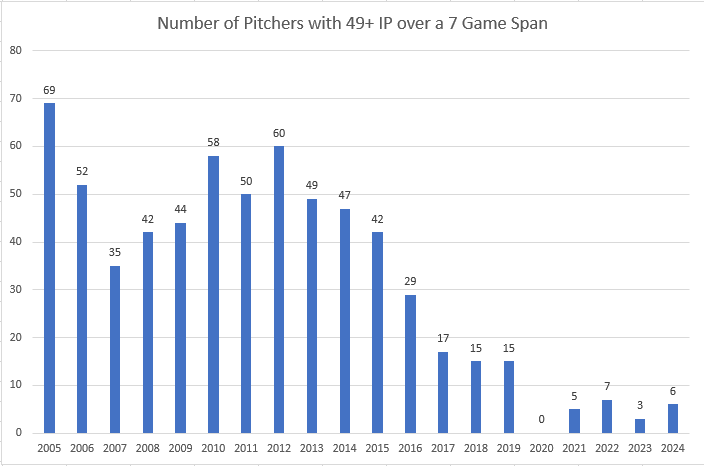
Of note are the 69 pitchers who recorded such a span in 2005, one more than all of the pitchers who have done so over the past eight seasons.
So, where did pitching like this come from? Actually, there were indicators of what was possible in Francis’s 2023 rookie season in which he posted a stellar 0.826 WHIP, the 12th lowest mark among rookie relievers in 30+ IP seasons with 200+ ERA+.
| Rk | Player | WHIP | ERA+ | Place | Season | Age | Team | Lg | W | L | W-L% | Dec | ERA | G | GS | CG | SHO | SV | IP | H | R | ER | HR | BB | IBB | SO | HBP | BK | WP | BF | ERA+ | FIP | WHIP | H9 | HR9 | BB9 | SO9 | SO/BB | Pos |
|---|---|---|---|---|---|---|---|---|---|---|---|---|---|---|---|---|---|---|---|---|---|---|---|---|---|---|---|---|---|---|---|---|---|---|---|---|---|---|---|
| 1 | Neftalí Feliz | 0.677 | 269 | 2009 | 21 | TEX | AL | 1 | 0 | 1.000 | 1 | 1.74 | 20 | 0 | 0 | 0 | 2 | 31.0 | 13 | 6 | 6 | 2 | 8 | 0 | 39 | 3 | 0 | 0 | 117 | 269 | 2.48 | 0.677 | 3.8 | 0.6 | 2.3 | 11.3 | 4.88 | ||
| 2 | Aaron Sanchez | 0.697 | 351 | 2014 | 21 | TOR | AL | 2 | 2 | .500 | 4 | 1.09 | 24 | 0 | 0 | 0 | 3 | 33.0 | 14 | 5 | 4 | 1 | 9 | 0 | 27 | 1 | 0 | 1 | 121 | 351 | 2.80 | 0.697 | 3.8 | 0.3 | 2.5 | 7.4 | 3.00 | 1 | |
| 3 | Sergio Romo | 0.706 | 209 | 2008 | 25 | SFG | NL | 3 | 1 | .750 | 4 | 2.12 | 29 | 0 | 0 | 0 | 0 | 34.0 | 16 | 13 | 8 | 3 | 8 | 1 | 33 | 3 | 0 | 0 | 130 | 209 | 3.31 | 0.706 | 4.2 | 0.8 | 2.1 | 8.7 | 4.13 | 1 | |
| 4 | Cla Meredith | 0.711 | 382 | 2006 | 23 | SDP | NL | 5 | 1 | .833 | 6 | 1.07 | 45 | 0 | 0 | 0 | 0 | 50.2 | 30 | 6 | 6 | 3 | 6 | 3 | 37 | 2 | 2 | 0 | 185 | 382 | 2.93 | 0.711 | 5.3 | 0.5 | 1.1 | 6.6 | 6.17 | 1 | |
| 5 | Bryan Hudson | 0.722 | 241 | 2024 | 27 | MIL | NL | 6 | 1 | .857 | 7 | 1.73 | 43 | 0 | 0 | 0 | 0 | 62.1 | 28 | 12 | 12 | 7 | 17 | 0 | 62 | 3 | 1 | 1 | 231 | 241 | 3.60 | 0.722 | 4.0 | 1.0 | 2.5 | 9.0 | 3.65 | ||
| 6 | Ryan Brasier | 0.772 | 277 | 2018 | 30 | BOS | AL | 2 | 0 | 1.000 | 2 | 1.60 | 34 | 0 | 0 | 0 | 0 | 33.2 | 19 | 6 | 6 | 2 | 7 | 0 | 29 | 0 | 0 | 1 | 124 | 277 | 2.83 | 0.772 | 5.1 | 0.5 | 1.9 | 7.8 | 4.14 | 1 | |
| 7 | Jonathan Papelbon | 0.776 | 517 | ROY-2 | 2006 | 25 | BOS | AL | 4 | 2 | .667 | 6 | 0.92 | 59 | 0 | 0 | 0 | 35 | 68.1 | 40 | 8 | 7 | 3 | 13 | 2 | 75 | 1 | 0 | 2 | 257 | 517 | 2.14 | 0.776 | 5.3 | 0.4 | 1.7 | 9.9 | 5.77 | 1 |
| 8 | Dellin Betances | 0.778 | 274 | ROY-3 | 2014 | 26 | NYY | AL | 5 | 0 | 1.000 | 5 | 1.40 | 70 | 0 | 0 | 0 | 1 | 90.0 | 46 | 15 | 14 | 4 | 24 | 1 | 135 | 4 | 1 | 2 | 341 | 274 | 1.64 | 0.778 | 4.6 | 0.4 | 2.4 | 13.5 | 5.63 | 1 |
| 9 | Pat Neshek | 0.784 | 206 | 2006 | 25 | MIN | AL | 4 | 2 | .667 | 6 | 2.19 | 32 | 0 | 0 | 0 | 0 | 37.0 | 23 | 9 | 9 | 6 | 6 | 0 | 53 | 0 | 0 | 0 | 138 | 206 | 2.88 | 0.784 | 5.6 | 1.5 | 1.5 | 12.9 | 8.83 | ||
| 10 | Ken Giles | 0.788 | 319 | ROY-4 | 2014 | 23 | PHI | NL | 3 | 1 | .750 | 4 | 1.18 | 44 | 0 | 0 | 0 | 1 | 45.2 | 25 | 7 | 6 | 1 | 11 | 1 | 64 | 0 | 0 | 1 | 166 | 319 | 1.34 | 0.788 | 4.9 | 0.2 | 2.2 | 12.6 | 5.82 | 1 |
| 11 | Rafael Soriano | 0.792 | 283 | 2003 | 23 | SEA | AL | 3 | 0 | 1.000 | 3 | 1.53 | 40 | 0 | 0 | 0 | 1 | 53.0 | 30 | 9 | 9 | 2 | 12 | 1 | 68 | 3 | 0 | 0 | 201 | 283 | 1.80 | 0.792 | 5.1 | 0.3 | 2.0 | 11.5 | 5.67 | 1 | |
| 12 | Bowden Francis | 0.826 | 249 | 2023 | 27 | TOR | AL | 1 | 0 | 1.000 | 1 | 1.73 | 20 | 0 | 0 | 0 | 1 | 36.1 | 22 | 7 | 7 | 5 | 8 | 0 | 35 | 1 | 2 | 1 | 136 | 249 | 3.86 | 0.826 | 5.4 | 1.2 | 2.0 | 8.7 | 4.38 | ||
| 13 | Caleb Thielbar | 0.826 | 233 | 2013 | 26 | MIN | AL | 3 | 2 | .600 | 5 | 1.76 | 49 | 0 | 0 | 0 | 0 | 46.0 | 24 | 11 | 9 | 4 | 14 | 4 | 39 | 0 | 0 | 1 | 171 | 233 | 3.40 | 0.826 | 4.7 | 0.8 | 2.7 | 7.6 | 2.79 | 1 | |
| 14 | Joey Devine | 0.832 | 698 | ROY-6 | 2008 | 24 | OAK | AL | 6 | 1 | .857 | 7 | 0.59 | 42 | 0 | 0 | 0 | 1 | 45.2 | 23 | 7 | 3 | 0 | 15 | 2 | 49 | 0 | 0 | 0 | 170 | 698 | 1.97 | 0.832 | 4.5 | 0.0 | 3.0 | 9.7 | 3.27 | 1 |
| 15 | Jeff Zimmerman | 0.833 | 215 | ROY-3 | 1999 | 26 | TEX | AL | 9 | 3 | .750 | 12 | 2.36 | 65 | 0 | 0 | 0 | 3 | 87.2 | 50 | 24 | 23 | 9 | 23 | 1 | 67 | 2 | 0 | 2 | 336 | 215 | 3.80 | 0.833 | 5.1 | 0.9 | 2.4 | 6.9 | 2.91 | 1 |
| 16 | Doug Henry | 0.833 | 406 | ROY-8 | 1991 | 27 | MIL | AL | 2 | 1 | .667 | 3 | 1.00 | 32 | 0 | 0 | 0 | 15 | 36.0 | 16 | 4 | 4 | 1 | 14 | 1 | 28 | 0 | 0 | 0 | 137 | 406 | 2.83 | 0.833 | 4.0 | 0.3 | 3.5 | 7.0 | 2.00 | 1 |
| 17 | Troy Percival | 0.851 | 241 | ROY-4 | 1995 | 25 | CAL | AL | 3 | 2 | .600 | 5 | 1.95 | 62 | 0 | 0 | 0 | 3 | 74.0 | 37 | 19 | 16 | 6 | 26 | 2 | 94 | 1 | 2 | 2 | 284 | 241 | 2.71 | 0.851 | 4.5 | 0.7 | 3.2 | 11.4 | 3.62 | |
| 18 | Mychal Givens | 0.867 | 230 | 2015 | 25 | BAL | AL | 2 | 0 | 1.000 | 2 | 1.80 | 22 | 0 | 0 | 0 | 0 | 30.0 | 20 | 7 | 6 | 1 | 6 | 0 | 38 | 1 | 0 | 0 | 117 | 230 | 1.73 | 0.867 | 6.0 | 0.3 | 1.8 | 11.4 | 6.33 | 1 | |
| 19 | Tyler Holton | 0.867 | 206 | 2023 | 27 | DET | AL | 3 | 2 | .600 | 5 | 2.11 | 59 | 1 | 0 | 0 | 1 | 85.1 | 56 | 21 | 20 | 9 | 18 | 1 | 74 | 1 | 0 | 4 | 324 | 206 | 3.56 | 0.867 | 5.9 | 0.9 | 1.9 | 7.8 | 4.11 | ||
| 20 | Andrew Bailey | 0.876 | 239 | ROY-1 | 2009 | 25 | OAK | AL | 6 | 3 | .667 | 9 | 1.84 | 68 | 0 | 0 | 0 | 26 | 83.1 | 49 | 17 | 17 | 5 | 24 | 3 | 91 | 0 | 0 | 6 | 323 | 239 | 2.56 | 0.876 | 5.3 | 0.5 | 2.6 | 9.8 | 3.79 | 1 |
That rookie campaign and Francis’s record run of games this season has allowed him to become the first pitcher in more than a century with a chance to allow fewer baserunners than innings pitched (minimum 125 IP) over the first 50 games of a career.
| Rk | Player | IP | BR | From | To | W | L | W-L% | ERA | G | GS | GF | CG | SHO | SV | IP | H | R | ER | UER | HR | BB | IBB | SO | HBP | BK | WP | BF | BR |
|---|---|---|---|---|---|---|---|---|---|---|---|---|---|---|---|---|---|---|---|---|---|---|---|---|---|---|---|---|---|
| 1 | Bowden Francis | 140.2 | 138 | 2022 | 2024 | 9 | 5 | .643 | 2.88 | 48 | 13 | 19 | 0 | 0 | 1 | 140.2 | 97 | 48 | 45 | 3 | 22 | 30 | 0 | 128 | 8 | 3 | 1 | 547 | 138 |
| 2 | Frank Arellanes | 294.1 | 294 | 1908 | 1909 | 20 | 11 | .645 | 0.00 | 50 | 34 | 16 | 23 | 2 | 7 | 294.1 | 235 | 85 | 0 | 0 | 3 | 52 | 110 | 7 | 0 | 5 | 1144 | 294 | |
| 3 | George McQuillan | 373.2 | 361 | 1907 | 1908 | 26 | 14 | .650 | 0.00 | 50 | 43 | 7 | 34 | 10 | 3 | 373.2 | 265 | 78 | 0 | 0 | 1 | 89 | 131 | 7 | 0 | 6 | 1430 | 361 |
As Francis still has two games to go to reach 50, we will have to wait until next year to see if he joins the other two. Speaking of which, you may have noticed the missing earned and unearned run data for Arellanes and McQuillan, and for some of the pitchers in the preceding lists. I believe Stathead validates the box score data by comparison to the play-by-play data. As there are no play-by-play data prior to 1912, the earned and unearned run totals and related calculations are not shown in queries of game level data.
Francis has also recorded the lowest WHIP in 100+ IP over the first three seasons of a career among pitchers who relieved in fewer than 80% of their games.
| Rk | Player | WHIP | GR | G | From | To | Age | W | L | W-L% | Dec | ERA | G | GS | CG | SHO | SV | IP | H | R | ER | HR | BB | IBB | SO | HBP | BK | WP | BF | ERA+ | FIP | WHIP | H9 | HR9 | BB9 | SO9 | SO/BB | GF | GR | Pos | Team |
|---|---|---|---|---|---|---|---|---|---|---|---|---|---|---|---|---|---|---|---|---|---|---|---|---|---|---|---|---|---|---|---|---|---|---|---|---|---|---|---|---|---|
| 1 | Bowden Francis | 0.903 | 35 | 48 | 2022 | 2024 | 26-28 | 9 | 5 | .643 | 14 | 2.88 | 48 | 13 | 0 | 0 | 1 | 140.2 | 97 | 48 | 45 | 22 | 30 | 0 | 128 | 8 | 3 | 1 | 547 | 143 | 4.21 | 0.903 | 6.2 | 1.4 | 1.9 | 8.2 | 4.27 | 19 | 35 | TOR | |
| 2 | Paul Skenes | 0.962 | 0 | 22 | 2024 | 2024 | 22 | 11 | 3 | .786 | 14 | 1.99 | 22 | 22 | 0 | 0 | 0 | 131.0 | 94 | 31 | 29 | 10 | 32 | 0 | 167 | 6 | 1 | 2 | 508 | 213 | 2.48 | 0.962 | 6.5 | 0.7 | 2.2 | 11.5 | 5.22 | 0 | 0 | PIT | |
| 3 | Dick Hughes | 0.967 | 34 | 68 | 1966 | 1968 | 28-30 | 20 | 9 | .690 | 29 | 2.79 | 68 | 34 | 13 | 4 | 8 | 307.0 | 221 | 101 | 95 | 29 | 76 | 12 | 230 | 7 | 2 | 8 | 1205 | 116 | 3.05 | 0.967 | 6.5 | 0.9 | 2.2 | 6.7 | 3.03 | 17 | 34 | 1/H | STL |
| 4 | Elmer Steele | 0.976 | 14 | 36 | 1907 | 1909 | 23-25 | 9 | 12 | .429 | 21 | 2.20 | 36 | 22 | 11 | 1 | 1 | 205.0 | 171 | 78 | 50 | 2 | 29 | 79 | 4 | 2 | 1 | 777 | 114 | 1.99 | 0.976 | 7.5 | 0.1 | 1.3 | 3.5 | 2.72 | 11 | 14 | 1 | BOS | |
| 5 | George McQuillan | 0.990 | 20 | 95 | 1907 | 1909 | 22-24 | 40 | 33 | .548 | 73 | 1.71 | 95 | 75 | 53 | 14 | 4 | 648.1 | 486 | 178 | 123 | 6 | 156 | 238 | 8 | 0 | 9 | 2484 | 144 | 2.30 | 0.990 | 6.7 | 0.1 | 2.2 | 3.3 | 1.53 | 18 | 20 | 1 | PHI | |
| 6 | Matt Harvey | 1.000 | 0 | 65 | 2012 | 2015 | 23-26 | 25 | 18 | .581 | 43 | 2.53 | 65 | 65 | 1 | 1 | 0 | 427.0 | 333 | 127 | 120 | 30 | 94 | 3 | 449 | 12 | 0 | 9 | 1690 | 146 | 2.65 | 1.000 | 7.0 | 0.6 | 2.0 | 9.5 | 4.78 | 0 | 0 | 1/H | NYM |
| 7 | Vida Blue | 1.008 | 8 | 57 | 1969 | 1971 | 19-21 | 27 | 9 | .750 | 36 | 2.36 | 57 | 49 | 26 | 10 | 1 | 392.2 | 278 | 119 | 103 | 32 | 118 | 4 | 360 | 5 | 1 | 11 | 1545 | 143 | 2.64 | 1.008 | 6.4 | 0.7 | 2.7 | 8.3 | 3.05 | 1 | 8 | 1 | OAK |
| 8 | José Fernández | 1.014 | 0 | 47 | 2013 | 2015 | 20-22 | 22 | 9 | .710 | 31 | 2.40 | 47 | 47 | 0 | 0 | 0 | 289.0 | 208 | 87 | 77 | 18 | 85 | 6 | 336 | 7 | 2 | 7 | 1151 | 160 | 2.52 | 1.014 | 6.5 | 0.6 | 2.6 | 10.5 | 3.95 | 0 | 0 | 1 | MIA |
| 9 | Ed Reulbach | 1.016 | 19 | 94 | 1905 | 1907 | 22-24 | 54 | 22 | .711 | 76 | 1.56 | 94 | 75 | 64 | 15 | 4 | 701.2 | 484 | 170 | 122 | 4 | 229 | 342 | 40 | 2 | 10 | 2715 | 174 | 2.63 | 1.016 | 6.2 | 0.1 | 2.9 | 4.4 | 1.49 | 19 | 19 | 1/H9 | CHC | |
| 10 | Addie Joss | 1.018 | 5 | 89 | 1902 | 1904 | 22-24 | 49 | 36 | .576 | 85 | 2.25 | 89 | 84 | 79 | 13 | 0 | 745.1 | 617 | 276 | 186 | 5 | 142 | 309 | 29 | 1 | 13 | 2904 | 134 | 2.58 | 1.018 | 7.5 | 0.1 | 1.7 | 3.7 | 2.18 | 4 | 5 | 1/3H | CLE |
Admittedly, Francis falls just below that 80% relief games threshold. For a more apples to apples comparison, here are the lowest WHIP in 100+ IP over the first three seasons of a career with 20% or more of games as starter and 60% or more in relief.
| Rk | Player | WHIP | GR | G | GS | From | To | Age | W | L | W-L% | Dec | ERA | G | GS | CG | SHO | SV | IP | H | R | ER | HR | BB | IBB | SO | HBP | BK | WP | BF | ERA+ | FIP | WHIP | H9 | HR9 | BB9 | SO9 | SO/BB | GF | GR | Pos | Team |
|---|---|---|---|---|---|---|---|---|---|---|---|---|---|---|---|---|---|---|---|---|---|---|---|---|---|---|---|---|---|---|---|---|---|---|---|---|---|---|---|---|---|---|
| 1 | Bowden Francis | 0.903 | 35 | 48 | 13 | 2022 | 2024 | 26-28 | 9 | 5 | .643 | 14 | 2.88 | 48 | 13 | 0 | 0 | 1 | 140.2 | 97 | 48 | 45 | 22 | 30 | 0 | 128 | 8 | 3 | 1 | 547 | 143 | 4.21 | 0.903 | 6.2 | 1.4 | 1.9 | 8.2 | 4.27 | 19 | 35 | TOR | |
| 2 | Mellie Wolfgang | 1.080 | 41 | 68 | 27 | 1914 | 1916 | 24-26 | 15 | 13 | .536 | 28 | 1.92 | 68 | 27 | 15 | 3 | 0 | 300.0 | 238 | 99 | 64 | 2 | 86 | 107 | 3 | 0 | 3 | 1164 | 145 | 2.64 | 1.080 | 7.1 | 0.1 | 2.6 | 3.2 | 1.24 | 32 | 41 | 1/5H | CHW | |
| 3 | Billy O’Dell | 1.081 | 28 | 46 | 18 | 1954 | 1957 | 21-24 | 5 | 11 | .313 | 16 | 2.62 | 46 | 18 | 3 | 1 | 4 | 164.2 | 128 | 56 | 48 | 12 | 50 | 3 | 109 | 5 | 0 | 0 | 661 | 137 | 3.07 | 1.081 | 7.0 | 0.7 | 2.7 | 6.0 | 2.18 | 12 | 28 | 1/H | BAL |
| 4 | Jeff Heathcock | 1.094 | 27 | 39 | 12 | 1983 | 1987 | 23-27 | 9 | 4 | .692 | 13 | 3.26 | 39 | 12 | 1 | 0 | 3 | 127.0 | 113 | 54 | 46 | 14 | 26 | 1 | 52 | 3 | 2 | 3 | 511 | 111 | 4.06 | 1.094 | 8.0 | 1.0 | 1.8 | 3.7 | 2.00 | 9 | 27 | 1 | HOU |
| 5 | Alexi Ogando | 1.102 | 103 | 133 | 30 | 2010 | 2012 | 26-28 | 19 | 9 | .679 | 28 | 3.12 | 133 | 30 | 1 | 1 | 3 | 276.2 | 229 | 105 | 96 | 27 | 76 | 3 | 231 | 10 | 0 | 13 | 1127 | 142 | 3.58 | 1.102 | 7.4 | 0.9 | 2.5 | 7.5 | 3.04 | 25 | 103 | 1 | TEX |
| 6 | Tanner Houck | 1.123 | 33 | 53 | 20 | 2020 | 2022 | 24-26 | 9 | 9 | .500 | 18 | 3.02 | 53 | 20 | 0 | 0 | 9 | 146.0 | 112 | 56 | 49 | 8 | 52 | 4 | 164 | 13 | 0 | 7 | 595 | 150 | 2.95 | 1.123 | 6.9 | 0.5 | 3.2 | 10.1 | 3.15 | 16 | 33 | 1 | BOS |
| 7 | Chris Sale | 1.125 | 80 | 109 | 29 | 2010 | 2012 | 21-23 | 21 | 11 | .656 | 32 | 2.89 | 109 | 29 | 1 | 0 | 12 | 286.1 | 234 | 93 | 92 | 27 | 88 | 8 | 303 | 8 | 0 | 9 | 1152 | 148 | 3.19 | 1.125 | 7.4 | 0.8 | 2.8 | 9.5 | 3.44 | 25 | 80 | 1 | CHW |
| 8 | Óscar Tuero | 1.137 | 39 | 58 | 19 | 1918 | 1920 | 24-26 | 6 | 9 | .400 | 15 | 2.88 | 58 | 19 | 6 | 0 | 4 | 199.2 | 174 | 87 | 64 | 4 | 53 | 58 | 13 | 1 | 6 | 812 | 98 | 3.10 | 1.137 | 7.8 | 0.2 | 2.4 | 2.6 | 1.09 | 28 | 39 | 1/H | STL | |
| 9 | Ryan Yarbrough | 1.152 | 48 | 77 | 29 | 2018 | 2020 | 26-28 | 28 | 16 | .636 | 44 | 3.94 | 77 | 29 | 0 | 0 | 0 | 344.2 | 315 | 161 | 151 | 38 | 82 | 9 | 289 | 24 | 1 | 3 | 1425 | 107 | 3.87 | 1.152 | 8.2 | 1.0 | 2.1 | 7.5 | 3.52 | 4 | 48 | 1 | TBR |
| 10 | Pedro Martínez | 1.155 | 65 | 91 | 26 | 1992 | 1994 | 20-22 | 21 | 11 | .656 | 32 | 3.05 | 91 | 26 | 1 | 1 | 3 | 259.2 | 197 | 94 | 88 | 16 | 103 | 7 | 269 | 15 | 1 | 9 | 1059 | 133 | 3.15 | 1.155 | 6.8 | 0.6 | 3.6 | 9.3 | 2.61 | 22 | 65 | 1 | LAD,MON |
If there’s a chink in Francis’s armor, it would have to be the long ball that was his undoing in his two no-hit bids. Francis’s 1.4 HR/9 leads all pitchers with 20% starts and 60% relief outings in 100+ IP with 120+ ERA+ over the first three seasons of a career.
| Rk | Player | HR9 | GS | G | GR | ERA+ | From | To | Age | W | L | W-L% | Dec | ERA | G | GS | CG | SHO | SV | IP | H | R | ER | HR | BB | IBB | SO | HBP | BK | WP | BF | ERA+ | FIP | WHIP | H9 | HR9 | BB9 | SO9 | SO/BB | GF | GR | Pos | Team |
|---|---|---|---|---|---|---|---|---|---|---|---|---|---|---|---|---|---|---|---|---|---|---|---|---|---|---|---|---|---|---|---|---|---|---|---|---|---|---|---|---|---|---|---|
| 1 | Bowden Francis | 1.4 | 13 | 48 | 35 | 143 | 2022 | 2024 | 26-28 | 9 | 5 | .643 | 14 | 2.88 | 48 | 13 | 0 | 0 | 1 | 140.2 | 97 | 48 | 45 | 22 | 30 | 0 | 128 | 8 | 3 | 1 | 547 | 143 | 4.21 | 0.903 | 6.2 | 1.4 | 1.9 | 8.2 | 4.27 | 19 | 35 | TOR | |
| 2 | Héctor Santiago | 1.1 | 27 | 78 | 51 | 124 | 2011 | 2013 | 23-25 | 8 | 10 | .444 | 18 | 3.41 | 78 | 27 | 0 | 0 | 4 | 224.2 | 192 | 95 | 85 | 27 | 113 | 4 | 218 | 22 | 2 | 8 | 980 | 124 | 4.49 | 1.358 | 7.7 | 1.1 | 4.5 | 8.7 | 1.93 | 24 | 51 | 1 | CHW |
| 3 | Drew Smyly | 0.9 | 43 | 114 | 71 | 124 | 2012 | 2014 | 23-25 | 19 | 13 | .594 | 32 | 3.26 | 114 | 43 | 1 | 1 | 2 | 328.1 | 291 | 126 | 119 | 34 | 92 | 4 | 308 | 4 | 0 | 16 | 1337 | 124 | 3.45 | 1.166 | 8.0 | 0.9 | 2.5 | 8.4 | 3.35 | 9 | 71 | 1 | DET,TBR |
| 4 | Dave DeBusschere | 0.9 | 10 | 36 | 26 | 124 | 1962 | 1963 | 21-22 | 3 | 4 | .429 | 7 | 2.90 | 36 | 10 | 1 | 1 | 0 | 102.1 | 85 | 42 | 33 | 10 | 57 | 2 | 61 | 5 | 0 | 8 | 447 | 124 | 4.40 | 1.388 | 7.5 | 0.9 | 5.0 | 5.4 | 1.07 | 12 | 26 | 1 | CHW |
| 5 | Alexi Ogando | 0.9 | 30 | 133 | 103 | 142 | 2010 | 2012 | 26-28 | 19 | 9 | .679 | 28 | 3.12 | 133 | 30 | 1 | 1 | 3 | 276.2 | 229 | 105 | 96 | 27 | 76 | 3 | 231 | 10 | 0 | 13 | 1127 | 142 | 3.58 | 1.102 | 7.4 | 0.9 | 2.5 | 7.5 | 3.04 | 25 | 103 | 1 | TEX |
| 6 | Jim Konstanty | 0.8 | 13 | 36 | 23 | 121 | 1944 | 1948 | 27-31 | 7 | 5 | .583 | 12 | 2.94 | 36 | 13 | 5 | 1 | 2 | 137.2 | 137 | 56 | 45 | 13 | 42 | 7 | 35 | 1 | 0 | 3 | 568 | 121 | 4.33 | 1.300 | 9.0 | 0.8 | 2.7 | 2.3 | 0.83 | 11 | 23 | 1 | BSN,CIN,PHI |
| 7 | Chris Sale | 0.8 | 29 | 109 | 80 | 148 | 2010 | 2012 | 21-23 | 21 | 11 | .656 | 32 | 2.89 | 109 | 29 | 1 | 0 | 12 | 286.1 | 234 | 93 | 92 | 27 | 88 | 8 | 303 | 8 | 0 | 9 | 1152 | 148 | 3.19 | 1.125 | 7.4 | 0.8 | 2.8 | 9.5 | 3.44 | 25 | 80 | 1 | CHW |
| 8 | Mike Montgomery | 0.8 | 37 | 109 | 72 | 120 | 2015 | 2017 | 25-27 | 15 | 19 | .441 | 34 | 3.45 | 109 | 37 | 2 | 2 | 3 | 320.2 | 274 | 134 | 123 | 29 | 130 | 7 | 256 | 22 | 0 | 27 | 1349 | 120 | 4.15 | 1.260 | 7.7 | 0.8 | 3.6 | 7.2 | 1.97 | 29 | 72 | 1 | CHC,SEA |
| 9 | Ricky Horton | 0.7 | 30 | 128 | 98 | 123 | 1984 | 1986 | 24-26 | 16 | 9 | .640 | 25 | 2.91 | 128 | 30 | 2 | 1 | 5 | 315.2 | 301 | 108 | 102 | 26 | 99 | 22 | 184 | 5 | 8 | 9 | 1306 | 123 | 3.64 | 1.267 | 8.6 | 0.7 | 2.8 | 5.2 | 1.86 | 29 | 98 | 1/H | STL |
| 10 | José Soriano | 0.7 | 20 | 60 | 40 | 122 | 2023 | 2024 | 24-25 | 7 | 10 | .412 | 17 | 3.48 | 60 | 20 | 0 | 0 | 0 | 155.0 | 124 | 72 | 60 | 12 | 68 | 3 | 153 | 16 | 1 | 9 | 653 | 122 | 3.85 | 1.239 | 7.2 | 0.7 | 3.9 | 8.9 | 2.25 | 7 | 40 | LAA | |
| 11 | Tom Hall | 0.7 | 33 | 91 | 58 | 129 | 1968 | 1970 | 20-22 | 21 | 14 | .600 | 35 | 2.87 | 91 | 33 | 6 | 2 | 4 | 325.2 | 250 | 124 | 104 | 24 | 128 | 10 | 294 | 3 | 0 | 10 | 1330 | 129 | 2.92 | 1.161 | 6.9 | 0.7 | 3.5 | 8.1 | 2.30 | 17 | 58 | 1/H | MIN |
| 12 | Billy O’Dell | 0.7 | 18 | 46 | 28 | 137 | 1954 | 1957 | 21-24 | 5 | 11 | .313 | 16 | 2.62 | 46 | 18 | 3 | 1 | 4 | 164.2 | 128 | 56 | 48 | 12 | 50 | 3 | 109 | 5 | 0 | 0 | 661 | 137 | 3.07 | 1.081 | 7.0 | 0.7 | 2.7 | 6.0 | 2.18 | 12 | 28 | 1/H | BAL |
| 13 | Adam Wainwright | 0.6 | 32 | 95 | 63 | 122 | 2005 | 2007 | 23-25 | 16 | 13 | .552 | 29 | 3.61 | 95 | 32 | 1 | 0 | 3 | 279.0 | 278 | 122 | 112 | 20 | 93 | 6 | 208 | 13 | 0 | 9 | 1200 | 122 | 3.79 | 1.330 | 9.0 | 0.6 | 3.0 | 6.7 | 2.24 | 11 | 63 | 1/H | STL |
| 14 | Hugh Casey | 0.6 | 35 | 97 | 62 | 125 | 1935 | 1940 | 21-26 | 26 | 18 | .591 | 44 | 3.25 | 97 | 35 | 20 | 2 | 3 | 407.0 | 393 | 164 | 147 | 28 | 119 | 20 | 142 | 17 | 1 | 9 | 1728 | 125 | 3.98 | 1.258 | 8.7 | 0.6 | 2.6 | 3.1 | 1.19 | 36 | 62 | 1/H | BRO,CHC |
| 15 | Steve Sundra | 0.6 | 19 | 50 | 31 | 123 | 1936 | 1939 | 26-29 | 17 | 5 | .773 | 22 | 3.62 | 50 | 19 | 11 | 1 | 0 | 216.1 | 219 | 104 | 87 | 14 | 101 | 4 | 61 | 0 | 0 | 7 | 946 | 123 | 4.48 | 1.479 | 9.1 | 0.6 | 4.2 | 2.5 | 0.60 | 24 | 31 | 1 | NYY |
| 16 | Pedro Martínez | 0.6 | 26 | 91 | 65 | 133 | 1992 | 1994 | 20-22 | 21 | 11 | .656 | 32 | 3.05 | 91 | 26 | 1 | 1 | 3 | 259.2 | 197 | 94 | 88 | 16 | 103 | 7 | 269 | 15 | 1 | 9 | 1059 | 133 | 3.15 | 1.155 | 6.8 | 0.6 | 3.6 | 9.3 | 2.61 | 22 | 65 | 1 | LAD,MON |
Time will tell what becomes of Francis for the remainder of his career. But, he can always look back fondly at August and September of 2024 when he was in a zone the likes of which few other pitchers have experienced.
Great game to put the Mets into the post-season, with Francisco Lindor and Ozzie Albies both recording WPA over 0.6, one of only 35 games since 2000 with players on both teams recording such elevated WPA scores.
There was more than one such game in only 10 of those 25 seasons, yet in half of those 10 seasons, there were two such games within a week, including this season, as Shea Langeliers and Luke Raley were the heroes in this A’s/Mariners game, two days before the Mets/Braves game. Weird!
The Brewers’ Jackson Chourio is now the second youngest player with a 2-HR game in the post-season. Only Andruw Jones in the 1996 WS was younger.
The four youngest players with such a game were all born outside the US. Number five is Milwaukee-born Tony Kubek, who celebrates his 89th birthday next week. Chourio is the third and youngest Brewer with a rookie season including 75 R, 75 RBI and 50 XBH. But, going up against the likes of Paul Skenes, Jackson Merrill and Masyn Winn, Chourio will likely not match Kubek in winning RoY honors.
Kyle Higashioka homered for the second straight day for the Padres. This season he became the first catcher to record four seasons with double-digit HR in fewer than 300 PA.
In Baltimore, the Royals became the third team to win their first two post-season games with a total of only 3 runs.
Detroit’s 31 year-old Andy Ibanez delivered a pinch-hit 3-run double as the Tigers rallied to upend the Astros, ending Houston’s 7 year run of ALCS appearances. It appears Ibanez is the youngest player to be the oldest player on a team appearing in a post-season series, six weeks younger than Russell Martin on the 2014 Pirates. Kenta Maeda is the only Tiger older than Ibanez who might appear in the next series.
Pete Alonso’s game-winning blast in game 3 is the 12th lead-changing home run in the 9th or extra innings of a sudden death (or “winner take all”) post-season game. Ten of the twelve came with the score tied, with Alonso and Johnny Bench the only players to do so with their team trailing. Bench’s blast tied the game in the 1972 NLCS, so Alsonso’s shot is the only one to take a team from trailing to leading.
Doug:
2024 is now on the books.
Shohei Ohtani, of course, had a remarkable season in some respects, and yet WAR doesn’t rank it as high as Aaron Judge’s by a fairly impressive margin. Ohtani has a lock on the MVP award in the NL—no one comes close—but Bobby Witt, Jr., has a remote chance of upsetting Judge for the prize in the AL, partly because Judge was just being Judge and partly because Witt is the big bat in KC’s remarkable rise, even though that rise is mainly due to pitching by a staff that posted a 113 ERA+, 26 points higher than last year’s. In fact, if pitching beats batting in the playoffs, KC is the odds-on favorite to win it all.
At the start of the season it looked to me as if the Dodgers would be invincible, but the team registered its fewest number of wins since 2017—minus the plague year—and not because of the injuries to Betts and Muncy but because the pitching staff was at best a work in progress, no starters having a qualifying season and only one with 140 innings pitched.
What that portends for the post-season we’ll soon see.
Pitching. The big story here, despite smaller ones about Francis, Skubal, and the like, is the relative absence from the mound of a gaggle of recently dominant pitchers: Verlander, Scherzer, Kershaw, deGrom, Beuhler, Cole, Snell, and the resurrection of one formerly not-dead-but-in-critical-condition starter, Chris Sale, after five years in limbo, mostly on the DL.
Teams are burning through pitchers arms as fast as they can be recruited, and as long as the current managerial approach remains in place, that scenario will stay in place, no team being able to count on a reliable rotation or even part of one from one season to the next. No team used fewer than 25 moundsmen in 2024, the average was 34, and Miami fielded 45, the Dodgers 40. While a certain percentage of these numbers were having cups of coffee, the Guardians, to pick an example at random, used 22 out of thirty total in 8 games or more. Fifty years ago, the pennant winning A’s and Dodgers each relied on staffs of 9, although teams even then were more likely to be in the low double digits.
The 100 pitch theory, it seems obvious, doesn’t really work as a limit on arm stress. The evidence shows rather the opposite.
Other notes:
Mike Trout on the DL most of the season. Again.
The White Sox—but you knew that. Actually, their Pythagorean W-L was 48-114.
No team hit the 100-victory mark for the first full season in ten years.
Thanks nsb,
Tom Seaver was once asked about the modern pitching philosophy and his response was that there was no reason pitchers today couldn’t rack up CG totals similar to those of bygone years. What was needed was for that expectation to be set, and pitchers would adapt, by pacing themselves and pitching to contact. To Seaver, the strain on pitchers’ arms was from the max effort needed to generate mid-90s velocity, not from high innings or pitch totals. He felt most pitchers could throw a 90 mph fastball comfortably for 9 innings, and do so consistently without injury.
But, the hitters have also changed. The “max effort” swings that virtually every batter takes on virtually every swing were a rarity in Seaver’s time. Look at a tape of a game from the 1960s, and you’ll notice the batters look completely different, with most employing short, compact swings intended to put the ball in play and avoid the dreaded strikeout. Against hitters like that, a 90 mph fastball works just fine because even well-struck pitches will mostly be line drives that stay in the yard. Against today’s hitters, today’s already inflated home run totals would rise even higher.
Ultimately, as long as analytics say a 1 for 4 day with a home run and three strikeouts is better than 2 for 4 with a single and a double and two other balls in play, then I expect we will see more of the same, whatever the toll on pitchers. What’s needed to change the equation is to make home runs harder to hit, so that those days with a blast and three whiffs become rare enough that that batting approach no longer makes sense. Making home runs harder to hit can only happen if the fences get moved back. Make the yard bigger, and pitchers can ease up on the throttle and spend less time on the IL. And, this idea is not really that revolutionary. Lots of ballparks in the old days had one or two fields with dimensions well into the mid-400s and a few even bigger than that. All those high triples and IPHR totals in the old ballparks didn’t happen by accident; outfielders had enormous ground to cover and those exciting plays (that are mostly missing from today’s game) were the inevitable result.
Up through the 1960s, for example, the so-called short porch down the right field line in Yankee stadium was more than compensated for by the huge expanse from left center to right center where four hundred twenty foot drives were merely routine fly balls. How many homers Mantle and Mays, not particularly big guys, would knock over today’s short fences should give Barry Bonds cause to pray in gratitude.
As for that short porch, Ruth wasn’t particularly a pull hitter, and Mantle batting lefty was nearly a straightaway hitter. Both hit more dingers on the road than at home. Gehrig? 251 at home, 242 on the road. Maris in 1961? 30 at home, 31 on the road. As for DiMaggio, a righty, he was the biggest sufferer, with a 148 home/213 away split. Berra is the only Yankee I can find with much power who really benefitted by the “porch,” almost reversing DiMaggio’s numbers at 210/148.
To digress, or possibly rant a little. I think the short porch business is more a combination of wishful thinking and sour grapes on the parts of Bob Eno’s tribe, the Yankee haters.Take Ted Williams, who was regularly pointed out as the guy who would benefit most by playing at home in the Stadium. (I remember a hot stove league article in Sport Magazine suggesting a Williams for Berra trade, and before my time DiMaggio for Williams was speculated.) Anyway, Take Ted Williams: his percentage of HRs per PA was 4.3 in New York, but it was 5.0 at Fenway. At Comiskey, a terrible HR venue, it was 4.8%. At Briggs it was 7.3%, suggesting that Williams for Kaline might have been the true trade of the fifties.
Digression over, my point is that the huge caverns in Pittsburgh pre Kiner, Philadelphia after the Baker Bowl went RIP, Washington pre Sievers, Cincinnati pre Kluszewski, and the Polo Grounds for anyone who couldn’t pull the ball like Mel Ott, would swallow today’s dinky parks despite their shorter foul lines.
I’m no Yankee hater! . . . Well, maybe a little. . . . or a lot . . . It was a long time ago . . .
When I was 8 or 9 I once was seated in a box behind the plate on the 3B side in line with the basepath. Williams came up. He swung routinely and from where I sat the ball quietly went straight up and came straight down. I perceived it as a pop-up to the catcher, but fans were reaching for it at the right field foul pole. Short porch.
But nsb is right. The Stadium outfield was like the Nebraska plains.
I think dimensions of 350 down the lines, 390 in the alleys and 420 straight away would make TTO seasons much less valuable, and impel a move to more batting for contact and more pitching to contact. More balls in play = more action on the field, including considerably more doubles, triples and IPHRs.
Doug:
Runners on base change the character of the game, but how they reach base is also significant. A walk really isn’t as good as a hit unless there are two out in the ninth with the bases loaded. Hits are more unsettling, ROEs are even more unsettling (a hidden factor in all this is the high fielding percentage of today’s players, thanks to manicured fields and basket-sized gloves). Doubles and triples ditto. Home runs used to have that effect but have become ho-hum events a large proportion of the time. Why? Because no runners are on base. The now maligned speed game, having runners always threatening to steal, may statistically seem a faulty approach, but it plays havoc with the pitcher’s concentration, and that counts for a lot.
I picked a year at random, 1957, to compare with 2024 and found that, eliminating home runs, the Major League OBPs were .297 vs .281, but since I couldn’t factor in Reached on Error figures, I have to assume the gap was larger, given the .978 vs .985 Fielding percentages.
Re: Trout, he has played only 319 games the past 5 seasons, but has still compiled 13.8 WAR for the period. That’s almost 7 WAR per 162 games, so even playing in small chunks of games spread out over 5 seasons, he’s still producing at an elite level. Here’s the list of players averaging 1 WAR per 25 games aged 28-32 (min. 250 games playing all 5 seasons), ordered by ascending games played.
319 – Trout
447 – McGwire
561 – Edgar Martinez
597 – Judge
603 – Joe Jackson
615 to 809 – 55 players, ending with Ripken Jr.
After his injury woes, McGwire managed to stay healthy the next three seasons, with 150 games each year aged 33-35. We can only hope for something similar for Trout.
McGwire had some “help.” Trout probably wont avail himself to such help.
On your pitching point, nsb, this is the changing element of the game that I most regret. When I was small (mid-’50s) my older brother had a book that listed all the 200-game winners. I loved that list, and especially the short top section listing 300 game winners. The 19th century didn’t yet count, except for Cy Young, so there were only half a dozen guys in that section and I was sure they were part of ancient history. Grove was the only real lively-ball era member of that group, and he’d barely staggered over the line about fifteen years earlier.
Then Spahn began his late-career run and Wynn kept plugging away, and suddenly there were two new 300-game winners in my lifetime. I was overjoyed, and the 300-game winner era was just beginning. Now the list is 18 (plus the 19th century guys who now count) and the full 200-game-winner list is about 120–more than half added since I started tracking.
But where do we stand? There are currently three active 200-game winners: Verlander (262), Scherzer (216), and Kershaw (212). All seem near the end of the line, and that’s fine: they’re over it. But who’s next? Gerritt Cole has 153 wins–he’s only 33, and it looks as though he’s bounced back, so he should get across the line. And then?
Johnny Cueto 144 (he’s 38 and about done)
Lance Lynn 143 (37, looks about done)
Charlie Morton 138 (just short of 41)
Chris Sale 138 (35, well, maybe, if this year is a trend, rather than this month)
. . . then . . . (scrolling down) . . .
Kyle Gibson 112 (almost 37 and a 93 ERA+ pitcher)
Sonny Gray 111 (34, never more than 14 Ws in a season over 12 years)
Carlos Carrasco 110 (37)
Yu Darvish 110 (38)
There are 8 pitchers with 100-109, all in their 30s and at least ten years in already. One or two may make it, but the odds are long. No one under 30 has compiled more than 71 wins (the top thousand list ends at 72). There are fair odds for Cole and Sale, but overall it’s possible we will never see another 200-game winner.
Another possible 200 game winner is Jose Berrios. At 30 years old and 99 wins, it would seem an outside shot, except that he hasn’t missed a start the past 7 seasons, so appears to be one of those rare rubber-armed hurlers. His results have been almost as consistent as his workload, with ERA+ in the narrow 108 to 123 range each full season of his career, save for an off year in 2022 when he posted a “lucky” 12-7 record with only a 74 ERA+. At 10 wins a season for 10 years, he would be at 199 at age 40.
Here are the lowest totals by an active leader in career wins.
204 – Don Drysdale (1968)
205 – Bobo Newsom (1948), Bobo Newsom (1949)
208 – Bob Feller (1950)
209 – Don Drysdale (1969), Jim Bunning (1969)
214 – Tim Hudson (2014)
219 – Jim Bunning (1970)
222 – Tim Hudson (2015)
224 – Jim Bunning (1971)
226 – Justin Verlander (2020), Justin Verlander (2021)
It would seem that, within 5 years, the Active leader in Wins might have fewer than 175 wins, far and away the lowest total ever observed.
Starting pitchers have recorded fewer than 60% of winning decisions since 2019, the first season below that threshold. Here are the last seasons with starting pitchers earning the indicated percentage of winning decisions.
60% – 2018
65% – 2017
70% – 2014
75% – 1976
80% – 1945
85% – 1920
90% – 1906
Here’s another screed. Don’t know why.
I suspect that Doug may be working up a post on Pete Rose. In the meantime, if so, question:
Outside of southwest Ohio, do many people really remember him as a playing force, as opposed to being an accumulator who hung on far past his expiration date in order to set records and stroke his ego?
I ask this because, taking a fresh look at his stats, I was surprised to see how dominate he was in certain interlocking categories that don’t get talked about much in these enlightened times of the three true outcomes.
Hits: 17 consecutive years in the NL top ten, 12 of those in the top 3.
Runs: 15 seasons in the NL top ten, ten in the top 3.
Times on base: 18 seasons in the NL top ten, 14 in the top 3. This is a more remarkable stat than it seems at first, since, while he wasn’t averse to taking a walk, he never finished higher that fourth in BoBs, being in the top ten just seven times. Until latterly, in fact the hits that put him on base were often doubles:
Doubles: Fifteen times in the NL top ten, 11 in the top 3.
I never liked Pete. I spent two years in SW Ohio in the mid 1970s, and as I recall, the treatment of Rose and Bench among the locals and in the press (Morgan was somehow bypassed. Guess why.) bordered on idol worship. Nevertheless, I think he was a presence on the field far beyond what modern stats suggest. Getting on base and scoring, making things happen—sort of like Ricky Henderson, but with more grit and less flair.
nsb, I think the answer to your initial question is No because a large percentage of people don’t have memories of the 1960s and 1970s (including some who once did). But when Rose was first putting up numbers all of my baseball-minded contemporaries in the remote outposts of Manhattan and the Bronx were very much aware of him (I actually think I saw less press about him after I moved to the midwest in ’66, but maybe it’s because I was too old to collect cards). After all, back then, BA counted, and even before he won three batting championships he was on the league leaderboard each week hitting well over .300 in the era of the pitcher. The constant 200-hit seasons were there almost from the get-go, and he was a model: the Charlie Hustle thing–scrappy second baseman with a high average (and then he played over 500 games at five different positions). Until we got to know him better once the Reds got into the playoffs and WS he seemed like a great guy. (Seldom has national exposure treated a player worse, and deservedly.)
Rose accumulated over his last few seasons, but he compiled 80 WAR in 17 seasons before that (a little more than Johnny Bench), and it’s hard not to be aware of that as a force on the field–you make the case. Pujols was a better player statistically because of his power, but his career profile is similar: virtually all his 100 WAR is in his first 16 seasons and then he’s a replacement-level drag on his team for five years (though Albert somehow tagged on a brief final act after the curtain seemed already down). No one’s going to say of him, “Oh, really, he was just an accumulator” the way they’re speaking about Rose now. It’s because Albert was a Pillar of the Community while Pete was a sleaze.
Rose played hard, he played everyday (16 seasons of 150 games, 3 more over 135 games), and he produced consistent results (12 consecutive 4 WAR seasons). That’s much more than just an “accumulator”.
The Pujols analogy is apt. Rose was a drag on his team for 7 seasons (age 39-45). For Albert it was age six seasons (age 36-41) before an impressive “last hurrah” campaign at age 42.
Yes, Rose hung around to break records. But, don’t forget about the money. He earned $4.5M those last 7 “drag” seasons (probably closer to $5.3M as there’s a season missing from that total). That’s almost double the $2.8M he earned the rest of his career (the latter total is missing his first four years, but those seasons likely amounted, at best, to no more than $120K or so).
Pete (and Jeter?) probably had the greatest collection of teammates post-WWII more so than anyone in the sport. But, they also contributed- a lot….
Gotta love this lineup:
2B Morgan
CF Dawson (Pinson, Tolan, Maddox)
3B Schmidt
RF Robinson
C Bench (Carter)
LF Foster (Luzinski)
1B Perez
SS Concepcion (Cardenas, Bowa)
The huge contracts extending past players’ primes have contributed greatly to the “accumulator” phenomena. Pujols and Cabrera are two examples of guys reaching milestones (600 HR’s, 500 HR’s, 3,000 hits) that otherwise would not have been part of their career paths. Of course, Hall of Famers nonetheless…..
Pete’s MVP in 1973? Could have easily gone to Morgan, Stargell or Bonds or even Darrell Evans, no?
Plus Carlton and Seaver (and Gullett, Nolan, Rogers, etc.) on the mound.
….and Jim Maloney.
Maybe it’s a mere coincidence but I believe Larry Shepard was either managing the Pirates or the pitching coach of the Reds when guys like Bob Veale, Gary Nolan, Don Gullett and Wayne Simpson sort of blew their arms out?
Seems more likely coincidental. None of them were excessively used by the standards of the time. Simpson at 176 IP age 21 might raise an eyebrow or two today, but he had thrown 160 IP in the minors the year before (when Shepard was managing the Pirates), so hardly a huge jump. Veale throwing 279 IP in 1964 (when Shepard was managing in the minors) was probably too many, as he had not thrown more than 201 IP before, and that was in the minors three years earlier. Veale backed it up with similar workload and results in ’65 and ’66 All-Star seasons and was still an above average pitcher in ’68 and ’69 under Shepard.
A few notes on the LDS games over the weekend.
-6 HR by the Padres in game 2 ties the post-season record, set previously by the 2015 Cubs and 2023 Phillies, both also in LDS games
-4 consecutive games with an extra-base hit by Kyle Higashioka ties the record streak by a catcher to begin a post-season, set by Gary Carter in 1981.
-Dodgers have now played 17 straight post-season games with their starting pitcher throwing fewer than 6 innings, a streak going back to Max Scherzer with 7 IP in game 3 of the 2021 NLDS.
-Mark Vientos becomes the second youngest player to record a post-season game with 3+ XBH incl. 2+ HR. Like the youngest to do so (Carlos Correa in 2015), it came in a losing effort.
-The Mets have scored 14 runs against opponent relievers over 3 games, incl. 11 runs in the 8th or 9th innings.
-Cade Smith and Bo Naylor formed the first all-Canadian battery in a post-season game. With Naylor’s brother Josh also in the Guardians lineup, it tied the record of 3 Canadian-born players appearing for a team in a post-season game, set by the 2004 Twins.
-Yuli Gurriel became the second player aged 40+ with 3+ runs in a post-season game, matching the feat of Enos Slaughter in 1956.
Monday/Tuesday LDS Notes
-Through three games in the NLDS series, the Mets have scored 13 of 19 runs against Philly relievers, while the Padres have 14 of their 21 runs against Dodger starters. I suspect the former is the more unusual breakdown.
-While others were mashing homers, Jose Iglesias and Starling Marte both delivered key 2 out, 2-RBI singles. It’s the first time two Mets aged 34+ have recorded 2+ RBI without a homer in a post-season game.
-Walker Buehler is the first Dodger since Don Sutton in the 1978 NLCS to not record a strikeout in a 5+ IP post-season start.
-Speaking of which, Manny Machado altering his path to the 2nd base bag and having the throw to that base glance off him to key the Padres’ 6 run rally brought back memories of the 1978 World Series between the Dodgers and Yankees. In the 6th inning of game 4, the Dodgers attempted an inning-ending double play but Reggie Jackson, already retired as the lead runner, broke it up by advancing no further than 30 feet or so from first base and then sticking out his backside to deflect the throw to first into right field, allowing Thurman Munson to score from 2nd base. Yankees won the game 4-3 in extras to square the series.
-Tarik Skubal has joined Christy Mathewson as the only pitchers to begin their post-season careers with two 6+ IP starts allowing zero runs and one walk or less. Mathewson’s two games were, of course, CG wins (on three and two days rest).
-Maikel Garcia became the 3rd leadoff hitter with 4+ hits and zero runs in a post-season win. The first to do so was Freddie Lindstrom in 1924 at age 18, the youngest player with 4 hits in a post-season game; Garcia will have to be content with being the youngest Royal with such a game.
Unimportant stat here. In tonight’s Yankees-Royals game Seth Lugo pitched to Alex Verdugo. I could not find another example of a batter-pitcher match-up of both names ending in ugo, at least during the regular season.
U go , Richard!! Great job by u
Further research indicates that Verdugo faced Lugo several times during regular season games.
So, in lieu of mano a mano, it’s Ugo v. Ugo ?
Jose Iglesias faced Raisel Iglesias in the Mets/Braves double-header to end the season, with Jose delivering the 8th inning RBI hit to tie the game 3-3 (that the Mets eventually won 8-7 to clinch a wildcard). Teammates in 2019 and 2021, the two are the only MLB players with that name. The 2024 season was the eighth that both have played in for different teams, but the first in which they faced other.
Speaking of the ending sound of names, Francisco Lindor’s grand slam was the fourth in a series clinching game against a pitcher with a name ending in ez. The team hitting the home run won all of these games and, on the first three occasions, went on to win the World Series.
The Guardians have become the first team to win a best-of-5 series in which they were shutout in consecutive games.
Two teams have done this in a best-of-7, by the Cubs in the 2016 NLCS, and by the Giants in the 1917 WS. The Giants also did it in the best-of-9 1921 WS.
Met pitchers have walked 22 Dodgers over the first three games of their series, the most to start any LCS. The good news for New York? The next two on that list (1993 Blue Jays, 1980 Phillies) won the World Series. Those 1980 Phils also hold the record of 24 walks for any 3 game span in an LCS. The 1981 Dodgers hold the record for walks allowed over the first three games of a World Series, but are the only team in the top 5 on that list to win the series.
For the Dodgers, they have become the 8th team with four or more shutouts in a post-season, and the third of those eight (after the 1905 Giants and 2020 Braves) to record 4 shutouts in a span of 5 games.
In the ALCS, 5 wild pitches by the Guardians in game 1 ties the Cardinals in the 2000 NLDS for the most in any post-season game. All five of those Cardinal wild pitches were by starter Rick Ankiel, with the four by Cleveland’s Joey Cantillo next on the list. Cantillo’s 4 batters faced are easily the fewest in the regular or post-season when allowing 4+ wild pitches and 3 + walks, with Adam Ottavino next on the list with the same totals while facing 9 batters.
Is anyone else scratching your head as to why Aaron Boone has Austin Wells hitting between Judge and Stanton? Don’t you think Judge might get better pitches to hit if it was Stanton hitting behind him? Sure, it’s nice to have your lineup alternating left and right-handed batters, but surely not if doing so gives the opposition a good reason to pitch around your best hitter.
Wells? I’m still trying to figure out the mustache….If Boone is going to do the left-right-left thing, they might as well bat Chisholm fourth. Since he came over from Miami, he’s more of a threat than “The Mustache”. Not the first mysterious, unexplainable move by a manager but certainly a glaring one. Someone should do a search and try to find the lowest OPS+ by a league champion’s cleanup hitter. I’m volunteering Joe Carter at some point in Toronto (1992 – ’93)?
Here’s the list, showing OPS for the games in which the player batted fourth.
The lowest in the live ball era is Steve Garvey’s .637 OPS for the 1984 Padres. Carter is actually not even the lowest Carter: Joe’s .813 in 1993 bests Gary’s .791 in 1986.
One of Casey Stengel’s maxims was to never bat right-handed power hitters back-to-back because “the double plays will kill you”. I suppose in Stengel’s time “power hitter” was synonymous with a dead pull hitter with an upper cut swing. But, that description hardly fits Judge or Stanton: Judge is able to adapt his swing to his environs and thus does most of his damage to the opposite field at Yankee Stadium; while Stanton typically hits missiles back where the pitch came from, with his closed stance promoting an opposite field bias.
Doug,
Thanks for the list…based on the years the guys ahead of him played (dead ball era), Garvey probably would have the lowest OPS+ of the group. Garvey was a double-play machine but Judge and Stanton tend to, I gotta believe, have much higher fly ball rates than just about anybody else (Ohtani?) in baseball right now. The Mustache was a later inning PH/substitution last night….and struck out twice in his two plate appearances 🙁
….and then I check and Judge led the SAL in GIDP this year 🙁
“AL” not SAL
Catchers for both teams named Austin, both with mustaches, and both batting under .100 for the post-season.
WAR likes Wells with 2.6 career WAR in fewer than 500 PA. Hedges’ 0.1 WAR in 5 pitching games exceeds his -1.6 WAR in 750 games as a catcher/DH.
Wild game 3 in Cleveland, as both teams hit game-tying and tie-breaking home runs in the 8th inning or later. Has to be a post-season first, right? Actually, not quite. It happened once before, and also in Cleveland (in fact, in the first ever post-season game at their current stadium).
In game 1 of the inaugural 1995 ALDS between the Red Sox and Indians:
-Luis Alicea ties the game for Boston in the top of the 8th
-Tim Naehring puts the Red Sox ahead in the top of the 11th
-Albert Belle pulls Cleveland even in the bottom of the 11th
-38 year-old Tony Pena walks off the Sox in the bottom of the 13th
All four of the home runs came with the bases empty.
The above are the only post-season games with both teams hitting game-tying home runs in the 8th inning or later. There are four other games with both teams hitting tie-breaking home runs in the 8th inning or later:
-STL and TEX in game 6 of the 2011 WS
-ANA and NYY in game 1 of the 2002 ALDS
-SEA and NYY in game 4 of the 2001 ALCS
-SEA and NYY in game 2 of the other 1995 ALDS
Jhonkensy Noel’s 2 out pinch-HR is just the fourth in the post-season to tie a game or take the lead in the 9th or extra innings.
Jazz Chisholm’s sacrifice bunt in game 4 is the 30th by a clean-up hitter for a team winning a post-season game. Only four of those thirty are from the past 27 post-seasons, including none from 1998 to 2014 (there was another gap between such games almost as long from 1956 to 1971, albeit involving many fewer games).
Giancarlo Stanton’s home run in game 5 gives him a highly improbable .200/.290/.800 career slash in post-season games in Cleveland. He is 5 for 25 in 7 games, but all five hits are home runs. Stanton’s “every hit a home run” magic could end in a future season but, for right now, he holds down both first and second place on this “list”. To wit:
5 – Giancarlo Stanton (CLE)
3 – Giancarlo Stanton (TBR)
2 – 21 players (13 opponents)
Of the 21 players with 2 hits and 2 HR in an opponent’s park, none have done so against two opponents, and only two are from the pre-expansion era: Chuck Essegian against the White Sox in 1959; and Bill Dickey against the Reds in 1939.
The Mets did not strike out in their 12-6 win in game 5, just the 11th such game in post-season history and only the second in the past 50 years. Only once have both teams gone whiff-less, in the very memorable game 7 of the 1960 World Series.
Today (10/20) is the birthday of Juan Marichal, Mickey Mantle, and Keith Hernandez.
The postseason used to wrap up a lot earlier – so Marichal and Mantle never had the good fortune of playing on their birthdays.
But Keith Hernandez did – once. Game 7 of the 1982 World Series saw Hernandez play his only professional baseball game on his birthday. He went 2/3 with 2 walks, 2 RBI, and a run scored. Those three runs to which he contributed were the difference in a 6-3 Cardinals win. I don’t know of any other players who have World Series Game 7 birthday credentials like that.
(And I’m saying all this as a Brewers fan… but this was too delicious a nugget to let it slip by without mentioning it.)
Welcome back Dr. Doom,
Nice little nugget. Only other time a player appeared in a World Series game 7 on his birthday, it was also Oct 20 and also involved the Cardinals, with 35 year-old Roy Smalley working a 7 pitch walk in a 6th inning PH appearance in 1987. Two batters later, Greg Gagne delivered an RBI single to put the Twins ahead to stay, as Frank Viola and Jeff Reardon held the Cards at bay the rest of the way.
Congrats to the Yankees and Dodgers on convincing LCS victories. After a hiatus of 43 years, their Fall Classic rivalry will return for a twelfth engagement, more than any other World Series pairing.
What is the connection between the 1981 pennant winners and today’s champs? None other than Yankee GM Brian Cashman, who grew up a Dodger fan and served (according to Wikipedia) as a 14 year-old batboy for the world champion Dodgers during spring training in 1982.
The stars must be aligned, for a rarity. The teams from each league with the best record are actually playing for the championship. I’m too busy right now to check, but how often has that happened since the leagues split in three?
nsb,
This will be the sixth time in 30 seasons, including both shortened seasons (1995 and 2020) since the playoffs were expanded beyond division winners:
1995 Braves (90-54) 4-2 over Indians (100-44)
1999 Yankees (98-64) 4-0 over Braves (103-59)
2013 Red Sox (97-65) 4-2 over Cardinals (97-65)
2017 Astros (101-61) 4-3 over Dodgers (104-58)
2020 Dodgers (43-17) 4-2 over Rays (40-20)
2024 Dodgers (98-64) vs. Yankees (94-68)
I found some time to pursue this subject a little, and here are the results:
In the two division era, the 25 years bookended by 1969 and 1993, the teams with the best league records played each other in the Series just nine times (30%), but twelve other times (48%) one of the Series teams led its league in wins, winning the championship 7 of those years.
Four times the Series was played between two division winners with lesser records.
Sixteen of the twenty-five championships were won by teams with the best record in their league, or 64%.
No Series was played in 1994.
In the the 30 years from 1995 to 2024, the teams with the best league records played or will play each other in the Series just 6 times (20%), and 12 other times one of the Series teams led its league in wins. In other words, just twenty-four of the sixty World Series competitors of the last thirty years have led their league in wins during the regular season, although in eighteen seasons a league leader did make the Series.
Five times lesser division winners faced each other.
Wild card teams have made it to the Series fourteen times, lesser division winners twenty-two times.
League leaders have or will have won the series thirteen times (43%), lesser division winners nine times (30%), wild card teams eight times (27%).
Twice the series has been a contest between two teams that failed even to win a division title.
Any comments?
Happy to comment, nsb, and thanks for putting those stats together.
When the leagues first formed divisions, this kind of random outcome is what I was most unhappy contemplating. In 1969 things worked out for those who believed the regular season mattered critically (in fact, both league playoffs were sweeps by superior teams) and I remember wondering whether it would usually work out that way, but, of course, it has not. My worst nightmare was a sub-.500 team playing into the World Series, but the only time that has ever really threatened the Series was canceled. Maybe the ’94 strike was a pretext.
For me, the devaluation of the regular season to a 162-game warm-up for the postseason represents a major loss of meaning, but I think younger generations of fans have been brought up seeing this in all major sports and don’t feel any loss. Things change. The size of the postseason field requires short early series that are more like crap shoots than tests of quality, and Cinderella teams like the Mets and Tigers come from nowhere and flame out in no time, serving only to knock better teams out of the more deserving match-ups. League Championship Series produce winners, but the significance of “winning the pennant” seems to have been lost, and the World Series is a standalone event, divorced from the seven months preceding. Given the uneven quality of individual team schedules, mixing up division and league balances and adding asymmetrical inter-league schedules, it’s hard for me even to know what the regular season represents. The linear quality of the season structure has dissolved into a complex dynamic that tells no simple story.
In the 1950s and through 1968 in slightly expanded form, the meaning of a season was reflected every day in the full standings of each league, which provided a symmetrical one-glance portrait of every team’s record vs. every team, the two leagues being independent in both name and substance. I miss it. But I also recall that the Majors were confined to ten or twelve cities, salaries were miniscule and imbalance so entrenched that when I saw my only Series game at age 13 one team was on its way to its ninth “World Championship” in my short lifetime (I had been 8 before there was a Series winner from a town other than my own).
If Branch Rickey’s vision of an 8-team Continental League had prevailed, I think things would have developed much more along traditional lines.
Dodgers vs. Yankees often delivers memorable World Series, to wit:
-Bill Bevens’ almost no-hitter turned into a walk-off loss (1947 game 4)
-the Al Gionfriddo catch to rob Joe DiMaggio (1947 game 6)
-Jackie Robinson’s straight steal of home (1955 game 1)
-Don Larsen’s perfect game (1956 game 5)
-Reggie Jackson’s first pitch home runs in three consecutive AB (1977 game 6)
just to name a few that come immediately to mind.
This year’s Classic has started in the same vein, with a come-from-behind walk-off win that featured both:
-a first walk-off grand slam in WS history
-a first lefty on lefty WOHR in WS history
The 1947 WS was the first to be televised, although there was only a tiny number of people who owned a TV at the time. Most people who saw the series did so in bars and restaurants.
Richard, am I right to recall that you followed the ’47 Series result from a playground, rather than from a bar?
Good thought Bob but I had to settle for listening to my portable radio when I was outside, sometimes in the playground.
Freddie Freeman becomes the 19th player to hit a triple and a HR in a WS game, but the first to do so in a WS opener.
Jazz Chisholm becomes the 8th player to steal 3 bases in a WS game, but the first to do so in a WS opener and in his WS debut.
The direction all this is heading seems a little alarming. I just read an article on MLB.com listing 10 “amazing facts” about WS Game 1. Did you know that Juan Soto is only the second player ever to have both a walk and a hit in a postseason game played on his birthday?
I once read that the number of potential neural pathways that exist in a normal human brain of 100 billion neurons exceeds the number of atoms in the universe. I thought this was absurd but then I started calculating the math. I do not think there are more amazing postseason facts than atoms in the universe, but if you think the second instance of a walk/hit birthday combo counts as one I’m confident there are more than there are molecules in the average goundhog, and I’m beginning worry that AI-fed internet and our own insatiable appetites will deliver them to us over and over and over again.
And to save everyone time and effort let me add that Keith Hernandez, an October 20 baby, had a walk and a hit in 1982’s Game 7. (This means that Soto is the very first player in MLB history to achieve the BB/H postseason birthday trick in a losing cause. As Casey would say, “Amazin’!”)
Just noticed Doom’s note above flagging Hernandez’s 1982 b’day feat. Kudos to him for spotting this before Soto and MLB.com made it a trivia answer.
Pretty surprising that only Hernandez and Soto have done this in the World Series. Seventeen players (including three pitchers) have a World Series hit on their birthday, and eight have a walk. The best of the bunch is Willie Mays Aikens with 2 HR and 4 RBI in the 1980 opener. At the other other end of the spectrum are the ten (including Soto) with an 0 for 3 or more, with Maury Wills the only 0 for 5 (batting leadoff in the 1963 opener). Here’s the complete list.
Doug:
A youngster like you perhaps doesn’t realize that one of the most stunning iconic moments not just in the Yankee-Dodger saga but in World Series history was the passed ball strikeout in the ninth inning of game four, 1941. Two outs, the Dodgers leading 4-3, bases empty. Henrich swings and misses, game over . . . but the ball gets away, and he runs to first base. DiMaggio singles, Keller doubles, Dickey walks, Gordon doubles, and the Yanks take a 7-4 lead into the bottom of the ninth after the game ought to be history. The impact of Buckner’s error in 1986 palls by comparison.
Also—in 1949 Henrich’s walk-off homer for a game one win (1-0) not only epitomized the career of a fine, near HOF career in its last full season, but—as many people think, at least—destroyed Don Newcombe’s confidence in World Series play. He was bombed in every successive Series start, at any rate.
Billy Martin’s one man show in the 1953 Series deserves mention, if only to counteract the impression he made later—several impressions, perhaps, of just being a king-sized jerk.
My biggest bone of contention with your listing is in regard to the 1955 Series. 1) Robinson’s name value aside, his steal of home did nothing to change the outcome of the game, which the Dodgers lost. 2) The true big story of the 1955 matchup involves a player remembered only for one play, although he was a much better player than Gionfriddo, also so remembered. The opposite field drive that Berra sent down the left field line, caught by hero Sandy Amoros and turned into a double play when the relay beat the runner back to first isn’t as spectacular to view as Mays’s catch and throw in the previous Series, but it accomplished just as much, or possibly more, saving Podres’ game seven shutout victory.
Jeez! How old are you, nsb? Do you actually remember the ’41 Series? I’m in awe.
But this is a great list. The ’41 Series turning point, though, isn’t remembered for Heinrich, DiMaggio, Keller, Dickey, or Gordon. This is Mickey Owen’s Dropped Third Strike. It’s a Brooklyn achievement, and although it is always Owen who is remembered, the story should be about Hugh Casey, the deeply unstable, alcoholic pitcher who unraveled after Owen’s flub (and who kept on unraveling for years till he put a sad end to it himself). (Casey had unraveled the day before, and why boy-genius Durocher didn’t pull him after Joe D’s hit or Keller’s double is a mystery.)
My own memories of this list only begin at the end with Amaros’s catch (although I do recall watching the Giants leaping in joy in ’54–a bitter moment for a Brooklyn fan who understood where the deepest animosities lay).
However, I don’t agree with you about the impact of Owen’s miscue vs. Buckner’s. I think they were actually roughly comparable in impact.
Sorry to disappoint, but the first Series I remember anything about is the ’51 go round, but only because we had a new TV, or our first TV, and I sat awhile looking at one game. My memory of that is confined, strangely enough, to a fascination with the name Joe DiMaggio. Living in a small midwestern city prior to the Saturday broadcasts of “Game of the Week” I was playing more baseball than following it until, as I’ve mentioned here a decade or so past, there came out a comic book about Willie Mays, and then Gillette published a miniature version of the Baseball Encyclopedia, thick with basic stats. So my first real Series experience began in 1954, but back then there was this thing about all games being day games, and school interfered with most viewing. The Mays catch was an evening news highlight that I remember quite well—and Dusty Rhodes becoming a household name for 15 minutes. The ’55 series, Mantle on the bench injured for most of it and Snider clouting home runs, plus the Amoros/Podres finish, are stuck in my memory, but honestly, I don’t think the Robinson steal made many waves at the time, since it came in game one and didn’t change the outcome.
I agree with you that the dropped third strike and Mickey Owen override the Yankee batters in terms of relevance, but Buckner’s error, no, can’t agree that it was as devastating. You’re forgetting the wild pitch prior to the error, allowing the tying run to score and putting Knight in scoring position. The BoSox unravelled, couldn’t hold a two run lead. Not the same as having the game completely in the bag.
I am grateful I was too young to be aware of baseball in 1951, assuming that my mother would, if I had been, have effectively indoctrinated me in Brooklyn devotion, as she ultimately did, demonstrating the parental weakness of my father’s Giant loyalties (I can still see the expression of silent satisfaction on his face at the close of the ’54 Series) and subjecting me to even more torment over The Shot than I felt learning about it a few years later.
We could argue on and on about Buckner, nsb, but there would be no resolution. My loyalties shifted partway to the Mets after 1962 and so there will be no pre-mortem forgetfulness about Stanley’s wild pitch for me. But wild pitches happen; Buckner’s flub was an act of Providence, and completed a game-reversal within two batters that, unlike the Owen fiasco, negated a one-pitch-away-from-Series-victory situation into the deflation of another away-game effort with a thoroughly demoralized relief ace. The force of the impact can be seen in Calvin Schiraldi’s career before and after the error. A bad outing that let the Mets get into position to tie the game turned within a day into the turning point ending a hugely promising career. (Much as you psychoanalyzed Newcombe.)
But you’ll be able to speak to the legacy of four subsequent Dodger losses to the Yankees and perhaps to Hugh Casey’s suicide (psychoanalysis ends only when the analyst gets bored). I can see our argument extending this string into an HHS marathon, but I think outcome is clear: in the end we both pack it up satisfied that we’ve prevailed.
Thanks for those nuggets, nsb. I captured the Henrich play in ’41 and Martin’s contributions in ’53, in my World Series post. But, hadn’t heard about the Amoros play, which is noted as the top WPA event of the game, improving the Dodgers’ chances of winning by 18%. What’s strange about that play, though, is that there were runners at first and second and left-fielder Amoros doubled off the trail runner rather that the lead runner, presumably because either there was no play at second, or the lead runner beat the throw there. Seems that there must be an element of baserunning blunder in that play if the lead runner got back to his base safely, but the trail runner couldn’t.
Most remember, incorrectly, that Buckner’s gaffe cost the the Red Sox the WS title. In fact, the Mets had already tied the game so, like Owen’s muff in 1941, Buckner merely cost his team the game, which the Red Sox might ultimately have lost anyway.
The other note about Robinson’s steal of home in 1955 was that Martin attempted, unsuccessfully, to match that feat after his two out triple in the 6th inning of the same game. Don’t know whether that was also a straight steal attempt or an attempted advance on a WP or PB, but have wondered if the two events were connected. That is, whether Martin took umbrage at Robinson for “showing up” his battery, and wanted to return the insult.
On the Amaros catch, Doug, Amaros really covered a lot of ground. Martin at second clearly was aware Amaros might get there and paused close to the bag at second while McDougald took off from first. My guess is that McDougald was hoping to tie the score with an all-out effort, while Martin expected to waltz home once the ball got past Amaros.
Buckner’s muff did indeed cost the Sox the game, but Owen’s muff did not cost the Dodgers the game. It didn’t cost them anything except a base runner at first with two outs. It was Hugh Casey who was the Buckner equivalent (sorta). (It’s also possible that Owen’s muff wasn’t a muff at all: the rumor I recall is that it was actually a spitball that crossed Owen up, but of course Owen couldn’t say that for the record and Casey did deny it for the record.) I remember that in Durocher’s autobiography (actually written by Ed Linn, who could make anybody sympathetic, even Leo) he spends time talking about Casey’s instability and the traits that led up to his later suicide. The key moment after Owen’s PB was when Keller hit a double with men on first and second, putting the Yankees in front. Casey had Keller at 0-2 but threw that pitch over the plate. (And even then the Bums were still only a run behind with two outs and the bottom of the ninth ahead–why didn’t Durocher pull Casey before he let two more runs in? It took the work of many to turn Owen’s intrinsically miniscule miscue into a goat’s burden that he carried the rest of his life.)
Thanks for the explanation of the Amoros play. Still seems like a baserunning blunder to me. Had McDougal waited to see, as Martin did, if the ball gets past Amoros, at worst McDougal is at third with nobody out. The fact that Martin was waiting to see should have given McDougal pause since, being closer to the play, Martin presumably had a better take on whether the ball was potentially catchable.
Yes, you’re right about Owen’s muff only costing a baserunner and an out. That out would have ended the game with a Dodger win, which would also have been the result had they retired DiMaggio or Keller. But, since they didn’t, that’s why the play seems like it cost Brooklyn the game.
Good points about Durocher – it’s a head scratcher why he stuck with Casey through that entire inning; take the four scoreless he’s already given you and be thankful it was so much better than his game 3 outing (5 batters faced, only one retired). Casey’s SABR bio makes the case that any Yankee demons he harbored were exorcised with his win in game 4 of the 1947 series (the Bevens game) when he got out of a bases loaded jamb in the 9th unscathed. It all went downhill after that for Casey, professionally and personally. His drinking and lack of fitness spelled the end of his career in 1949. Then, he lost a paternity case, was served with an IRS tax lien, and had his wife leave him, all in the seven months prior to his 1951 suicide. Sad story.
Well, McDougald was a fine player so I think you have to consider the counter-factual: how would we view his decision to run if Amaros hadn’t caught the ball?
Berra’s hit was opposite field and down the line and Amaros was way out of position. He judged the ball perfectly as he ran horizontally across the field (the strength of the catch was really in Amaros’s perfect triangulation, not in a circus dive or anything like that), but the odds were strong that he’d miss it and Podres was pitching a shut-out. If Amaros had indeed missed the ball, McDougald had scored, and Podres had settled down and gotten out of the inning perhaps Gil would have been praised for tying the game with aggressive baserunning.
But as it is, it’s easier to focus on the fact that there were none out, Podres seemed to be losing it (though he wasn’t–Yogi’s hit was pure Berra, crossing everyone up) so anticipating a longer rally was a good bet, and, in the end, McDougald snuffed the rally out.
Thanks for correcting my mis-spelling of McDougald’s name.
There are actually four players named McDougal or McDougall, but just one McDougald. Dewey McDougal has the unenviable distinction of posting the worst seasonal ERA (8.32) in 100+ IP; his 8.30 career mark is second only to Andy Larkin’s 8.86.
Doug, I saw McDougald play dozens of times. I had his baseball cards, year after year. I pored over his record daily in the NY Times, which published Yankee stats on the sports page every edition. And before I typed my post I went to his B-R page to check the spelling.
I feel bad for Dewey McDougal, but I take comfort knowing that since ERA was not a compiled stat in his day and 19th century data wasn’t computed until long after Dewey left this vale of tears, he never felt the force of his historic shame.
Then there’s Karen McDougal Trump’s former “acquaintance/tryst”. If I would have known sooner, I would have voted for him twice:
https://en.wikipedia.org/wiki/Karen_McDougal