
The Dodgers and Yankees meet in the World Series for a record twelfth time, but their first meeting in 43 years. More on the World Series is after the jump.
Twelve meetings in the World Series is easily the most for any pair of league champions. Here’s the list:
- 12 – Dodgers/Yankees
- 7 – Giants/Yankees
- 5 – Cardinals/Yankees
- 4 – Braves/Yankees, Giants/Athletics, Cubs/Tigers, Cardinals/Red Sox
- 3 – Reds/Yankees, Cardinals/Tigers
- 2 – Cubs/Yankees, Phillies/Yankees, Pirates/Yankees, Cubs/Athletics, Cardinals/Athletics, Reds/Athletics, Dodgers/Athletics, Giants/Senators, Pirates/Orioles, Braves/Indians
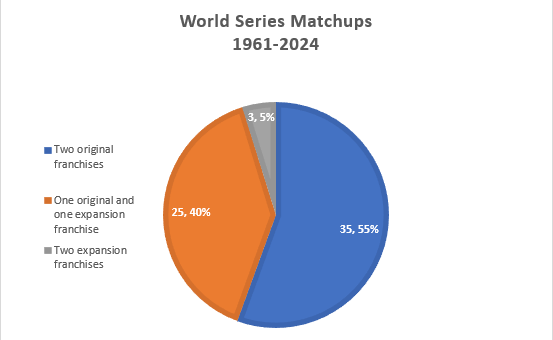
This is the 120th World Series, comprising 57 in the pre-expansion era and 63 since expansion in 1961. Here is a breakdown of World Series matchups in the expansion era.
The Yankees hold the upper hand in their World Series matchups with the Dodgers, winning in 8 of their previous 11 meetings. However, that scoreboard stands at 2-2 in the expansion era, and 3-3 since the Dodgers’ first World Series title in 1955. Here’s a brief synopsis of their previous World Series meetings:
- 1941 – In a matchup of two 100+ win teams, the Yankees prevailed in 5 games to claim their 5th World Series crown in 6 seasons. The series turned in game 4, when a strikeout of Tommy Henrich apparently won the game for the Dodgers to square the series. But, catcher Mickey Owen failed to secure the strikeout pitch to Henrich who advanced to first base on the muff, thus extending the 9th inning in which the Yankees would score 4 runs to win the game and take a 3-1 series lead.
- 1947 – In his debut season, Jackie Robinson became the first African American to appear in the World Series, but the Yankees prevailed in 7 games. In game 4, Bill Bevens, despite walking 10 Dodgers, was one out away from a no-hit win that would give the Yankees a 3-1 series edge, but Cookie Lavagetto doubled to right field to plate a pair of Dodger runs for a 3-2 walk-off win to square the series. In game 6, with the Dodgers facing elimination, the Yankees appeared to have tied the game with a 3-run home run, but Al Gionfriddo reached over the fence in deepest LF at Yankee Stadium to snag Joe DiMaggio’s 460 foot drive and preserve the Dodger victory. Brooklyn took an early 2-0 lead in game 7, but Joe Page pitched 5 scoreless frames in relief to backstop a 5-2 victory for the Pinstripers.
- 1949 – The teams traded a pair of 1-0 shutout wins in the first two games, and dueled to a 1-1 tie after 8 innings of game 3. In the 9th, the Yankees got to Ralph Branca for three runs, on a pair of two out RBI singles by Johnny Mize and Jerry Coleman. But the Dodgers didn’t go quietly, with a pair of solo homers in the bottom of the frame before Joe Page secured the final out. Yankee bats came alive in the next two contests to deliver a series triumph in 5 games.
- 1952 – The teams traded victories over the first six games and were knotted at 2-2 after 5 innings of game 7. Mickey Mantle, who slugged .655 for the series, delivered a solo blast in the 6th and an 2-out RBI knock in the 7th. The Dodgers loaded the bases with one out in the bottom of the 7th, but Bob Kuzava relieved for the Yankees and induced pop-ups by Duke Snider and Jackie Robinson to quell the threat and secure another Yankee series victory.
- 1953 – The home teams won each of the first four contests before the Yankees took game 5 at Ebbets field on the strength of Mickey Mantle’s grand slam home run. The Yankees were two outs away from a series triumph in game 6 before Carl Furillo tied the game with a 2-run blast off Allie Reynolds. In the bottom of the 9th, Billy Martin, who batted .500 for the series, singled to plate the winning run in walk-off fashion as the Yankees secured their 5th straight World Series title.
- 1955 – The home teams won the first six games to set the stage for the deciding contest pitting game 2 winner Tommy Byrne for the Yankees against game 3 winner Johnny Podres for the Dodgers. An RBI single in the 4th and a sac fly in the 6th, both by Gil Hodges, provided the margin of victory as Podres scattered 8 hits for the shutout victory and Brooklyn’s first World Series title after 6 agonizing disappointments.
- 1956 – The teams split the first four games before Don Larsen authored the only perfecto in World Series history in game 5. After 18 straight scoreless frames, the Dodgers finally broke through in the 10th inning of game 6 to walk-off the Yanks 1-0. New York romped 9-0 in the finale, shelling Dodger ace Don Newcombe for the second time in the series. New York’s 12 home runs stood as a new World Series record, eclipsed since only by the 2002 Giants and 2017 Astros.
- 1963 – In the first World Series played at Dodger Stadium, LA swept the Yankees, holding the New Yorkers to just four runs for the series against current and former Dodger aces Sandy Koufax, Don Drysdale and Johnny Podres. Former Yankee slugger Bill Skowron, dealt to the Dodgers after the 1962 season, pummeled his former club to the tune of .385/.429/.615 for the series.
- 1977 – Mike Torrez’s two CG victories paced the Yankees to a series win in 6 games. In the 4th inning of the clinching contest, Reggie Jackson followed a Thurman Munson leadoff single with a home run on the next pitch to put the Yankees ahead 4-3. Jackson added two more first pitch blasts to secure an 8-4 Yankee win.
- 1978 – The Yankees made it to October on Bucky Dent’s home run in game 163. The home teams won the first four games of the series before Yankee bats got to game 2 winner Burt Hooton in a game 5 blowout. Reggie Jackson’s two-run blast in game 6 was the coup de gras to clinch the series for New York. The two teams combined for 120 hits, still a record for a 6 game series and equaling the total for the same combatants in 1953.
- 1981 – In a bifurcated, strike-marred season, the two teams emerged as the survivors of two rounds of best-of-5 league playoff series. The Yankees won the first two games at home, holding the Dodgers to only 3 runs on 9 hits for the two contests. In LA, the Dodgers won three one-run games, a marathon 147 pitch CG win by rookie ace Fernando Valenzuela in game 3, an 8-7 triumph in game 4 in which Dodger relievers provided all 27 outs, and a 2-1 CG win by Jerry Reuss in game 5 on the strength of back-to-back 7th inning homers off of Yankee ace Ron Guidry. In game 6, Yankee manager Bob Lemon elected to pinch-hit for starter Tommy John in the 4th inning of a 1-1 game, but Yankee relievers allowed 7 runs over the next two frames as the Dodgers claimed their 5th World Series title.
For the 1949 WS you could have mentioned that in game1 Tommy Henrich hit the first WS walk-off home run.
Thanks, Richard. An indicator, perhaps, of the relative lack of prominence of the home run then vs. now, is that it took so long (the 46th World Series) for an event that has now happened 18 times in the World Series.
Prior to 1949, the only 1-0 Series win that came via a home run involved Henrich’s manager, the mighty Casey. Stengel was almost as good playing in the post-season as managing in it, with BAs of .364, .400, and .417.
https://www.ebay.com/itm/314618576524
too cool…if it comes thru
One of the things about the ’55 Series that was widely noted at the time was that it was the first time a team had won the initial two games of a 7-game Series and wound up losing. What a comeback by the Bums!! What fortitude!
But look at ’56. Aughh! The Yankees did the same thing! What rotten luck! US Steel always gets the breaks! (Vide Joe E. Lewis)
In fact, both Series followed the exact same pattern throughout: the home teams won the first six games and the visiting team captured the flag in the end. And this seemed to be developing into a pattern: the same thing happened in 1965 (Brooklyn over Minnesota) and 1971 (Pirates over the O’s). Four times in 17 years–it seemed almost to be a law of nature. So I was stunned when the pattern was broken in the Hubie Dome in 1987. No teams have replicated the pattern since 1971, and that 17-year stretch remains isolated.
But it had actually been broken before that when the Dodgers and Yankees set a new precedent. In 1978 Brooklyn won the first two games at home and the Yankees swept three at home as well, but then the Yankees prematurely won the sixth game as a visiting team in LA (where Brooklyn had recently begun playing many of its home games) establishing a new variant, Brooklyn now becoming the first team to win the first two games but lose the Series in six. Unfair!! How were they supposed to know that the Yankees would violate Series norms? Another victory for corporate America (GM, perhaps: US Steel’s glory days being past).
But at the next meeting of the two teams in 1981: Hurrah!! The Bums lost the first two in the Stadium but turned the 1978 pattern back on the Yankees in six. Two times in four years!! No teams have replicated the pattern since.
The 2024 Series has begun and there are danger signs for Brooklyn. The Bums have won the first two games at “home” (actually, in LA again; what’s up with that?). The omens are, well, ominous . . .
. . . So much for omens.
Bob, you were no doubt pleased that during game 3 on Fox, Joe Davis mentioned the Amoros catch as a key moment in the 1955 series (just to bring that discussion over to this thread).
Not as much as nsb was, I imagine. Remember, it was he who brought that subject to the last string, along with a series of other interesting Dodger-Yankee historical moments. And now you and Tom are picking up the theme.
RIP Fernando Valenzuela. He died one day before the 43rd anniversary of his gutsy performance on 10/23/81.
Fernando did not have his good stuff that day. WS Game 3 was his 5th start in 18 days. In his previous 4 starts, he went 31.2 innings, including 8.2 on 10/19.
He gave up 4 run on 2 HRs, 6 hits and 4 walks in 2.2 innings. With the team already down 2 games to 0, Fernando dug deep and shut out the Yankees the rest of the way, despite giving up 3 more hits and 3 more walks.
Thanks for the insight, Tom.
As events unfolded, sticking with Valenzuela in game 3 probably also helped the Dodgers win game 4, when a rested bullpen was called upon to cover 27 outs.
In 1981 Game 5, Ron Cey got beaned by a Goose Gossage fastball. At first there was real concern that Cey was seriously hurt, or worse. He lied unconscious for over 5 minutes. He had to be helped off the field. After the game, he went to the hospital and was diagnosed with a concussion.
Two days later, Cey was in the lineup. In the 5th inning, he hit a single to center that drove in the go-ahead run. LA never gave up the lead, as LA won 9-2, to win the Series.
I had forgotten all about Cey’s beaning, but the memory has returned now that you mentioned it. Yes, he did lie unconscious for what seemed the longest time.
Seems this year’s series could be over sooner than we’d like. As related on the game 3 telecast, this is the 25th Series in which a team has led 3-0. That turned into a sweep on 21 of the previous 24 occasions, and a 5 game series the other three times.
In yesterday’s Yankees-Dodgers game, game 4, of the World Series, Anthony Volpe hit a GS for his first WS HR.Only other Yankees to do that are Gil McDougald, Tino Martinez, Joe Pepitone and Bobby Richardson.
Whoever anticipated a contest of domination between the two presumptive MVPs was surely disappointed. Judge finally came alive in games four and five, but Ohtani’s big play was getting caught stealing and injuring himself in game two. BA for the Series, .056. Freeman, overshadowed all season by Ohtani (and Betts, early on until he was injured), carried the load with telling RBIs in every game.
Max Muncy? 0 hits in 20 PA’s….. these small sample sizes kill some guys
If you add up all of Mr. October’s post-season numbers (77 games IIRC) and multiply x2, he basically equals his 162 game regular season averages. Same with Mr. November in 159 (IIRC) career post-season games – literally the equivalent of his regular season body of work. Carlos Beltran always seemed to play well in the post-season but, nobody seemed to step up their game like Dykstra in his 32 post season games.
I have to believe Betts, Kershaw, and Ohtani are all destined for Cooperstown. Is Freeman a Hall of Famer? I guess so, particularly if he adds to his counting stats for another 3-4 years with just league-average type performance
As for Muncy, it will be hard for him to claim a Dodger superlative in light of Gil Hodges’ 1952 record of 0 for 26 PA (21 AB) in a 7-game Series. And Muncy still got to make good postseason contributions vs. the Padres & Mets–in the two days between the end of the regular season and his Series bust in 1952, Hodges’ MLB record is indistinguishable from that of a Fuller Brush salesman.
But thank you, Paul, for pointing out Dykstra’s terrific record. I wasn’t aware of how consistently good he’d been in the postseason, though I suppose the consistency of his later appearances was attributable to the US pharmaceutical industry. It is interesting to contrast that consistent excellence with his personal conduct, which was never remotely consistent except in its great distance from excellence. (Still, in the late ’80s I was a fan.)
Something similar occurred in the 1946 WS between the Red Sox and the Cardinals. Ted Williams batted .200 with 0 HR and 1 RBI. Stan Musial wasn’t much better with a.222 BA, 0 HR and 4 RBI.
Congrats to the Dodgers!
A clinching game that will not soon be forgotten. Yankees beat themselves badly, but LA came up with two key two out hits to take full advantage of the opportunity afforded them.
Was game 5 the first time the Yankees have allowed 5+ runs in an inning when holding a multi-run lead in a WS elimination game. Actually, no! The same thing happened in game 7 in 1960. No errors in that inning, but a bad hop on an easy double play ball turned two out nobody on into two on nobody out.
I have criticized Dave Roberts in these pages for his past post-season managing. But, not this year. Going into the post-season with only three starters, two of whom were just coming back from lengthy absences, and somehow getting eleven wins with solid performances from his staff just about every night was a masterstroke. Well done, indeed!
A few random notes on game 5.
-5 unearned runs allowed by Gerrit Cole are the most for a pitcher and for his team in a WS clinching game
-Jack Flaherty’s 1.1 IP are the fewest by a starting pitcher for the winning team in a WS clincher since Spec Shea also recorded four outs for the Yankees against the Dodgers in 1947. Three such starting pitchers didn’t survive the first inning. Here’s the list.
-3 home runs allowed by the Dodgers ties the 1964 Cardinals for the most by the winning team in a WS clincher.
-7 runs scored by the Dodgers ties the 2015 Royals for the most without a HR in the expansion era by the winning team in a WS clincher.
-This was the Dodgers’ 6th time clinching a WS victory in an away game; their other two wins have come at home (in 1963) and at a neutral site (in 2020). The Yankees have similarly clinched most of their WS victories (17 of 27) away from home.
Nice post, and I particularly like the nod to the Pirates’ 5-run 8th in ’60 and the remarkable management of the Dodgers’ decimated pitching staff.
But I’m here to complain, as grumpy old men do! I really object to the “most X in a clincher” stat when the game is not a sudden-death situation, or at least when applied to a team that is guaranteed a rematch if they lose.
When the “clincher” is the 7th game, every member of both teams goes into that game knowing it’s the clincher, and that their play that day will determine the Series outcome. In the case of other scenarios the stakes are asymmetrical. There’s a lot of difference between a clincher-in prospect and a clincher-in-retrospect, and I think the “most X in a clincher” stat, when broadly applied, is of weak interest for that reason.
The Yankees blowing a lead by allowing a 5-run inning is mostly comparable in 1960 and 2024 because the two teams had an equal amount to lose–although in ’60 they allowed 5 runs to a team with much greater external motivation because they too were in a sudden-death context. But Flaherty’s IP total “in a clincher” is something that no one could know when he left the field, whereas when Bucky Harris pulled Spec Shea it was the sort of all-or-nothing move that comes in a 7th game when the stakes are ofully n the table from the first pitch, not in a 5th game where a team is trying to close the deal on a 3-1 Series lead. (Shea was a #2 starter who had been very effective and had just his a quick rough patch with only one run in, while Bevens, whom Harris brought in, had been a struggling pitcher all year and had just suffered the most painful loss of his career–a career that seems to have been ended by just that last piece of overwork in the 7th game.)
In the last eight years the Dodgers and Astros have each appeared in the Series four times. Eight other teams have each appeared once.
The Dodgers have made the playoffs in each of the last twelve years, the Astros in each of the last eight. In the last thirty years, the Yankees have seen post-season action twenty-five time, with a string of 13 consecutive years beginning in 1995.
Here is a listing of dueling NL and AL MVPs who’s teams vied against each other in the World Series. Without citing numbers—but you can look it up—I’ll just report that, with exceptions, their performances fell below regular season level. Mantle, for example, had three excellent Series, but 1956 and ’57 were just run of the mill. None of DiMaggio’s post-seasons matched his usual performance level. The best matchup by far came in 1980 between Mike Schmidt and George Brett, which is fitting, since they were paired in their time the way Mays and Mantle were (or Campanella and Berra, or Musial and Williams). The worst dual performance to my mind isn’t the Musial/Williams disappointment of 1946, or the recent Ohtani/Judge let down, but the 1942 disaster pairing Joe Gordon’s .095 BA and Mort Cooper’s 5.54 ERA.
1912 Larry Doyle/Tris Speaker
1914 Johnny Evers/EddiesCollins
1927 Paul Waner/Lou Gehrig
1931 Frankie Frisch/Lefty Grove
1934 Dizzy Dean/Mickey Cochrane
1935 Gabby Hartnett/Hank Greenberg
1936 Carl Hubbell/Lou Gehrig
1939 Bucky Walters/Joe DiMaggio
1940 Frank McCormick/Hank Greenberg
1941 Dolph Camilli/ Joe DiMaggio
1942 Mort Cooper/Joe Gordon#
1943 Stan Musial/ Spud Chandler
1945 Phil Cavarretta/Hal Newhouser
1946 Stan Musial/Ted Williams
1950 Jim Konstanty/Phil Rizzuto
1955 Roy Campanella/Yogi Berra
1956 Don Newcombe/MickeyMantle
1957 Hank Aaron/Mickey Mantle
1960 Dick Groat/Roger Maris
1961 Frank Robinson/Roger Maris
1963 Sandy Koufax/Elston Howard
1967 Orlando Cepeda/Carl Yastrzemski
1968 Bob Gibson/Denny McLain
1970 Johnny Bench/Boog Powell
1975 Joe Morgan/Fred Lynn
1976 Joe Morgan/Thurman Munson
1980 Mike Schmidt/George Brett*
1988 Kirk Gibson/Jose Canseco
2012 Buster Posey/Miguel Cabrera
2024 Shohei Ohtani/Aaron Judge?
Thanks for this list, nsb. I expect it took some work.
It’s interesting to see how expansion has impacted this sort of match-up. Until 1931 the MVP was a sometimes thing–none before 1911 and only four years in the 1910s and six in the 1920s where both leagues even had MVPs. But once regularized these WS match-ups occurred 4-6 times each decade through the ’60s, then 2-3 times, then zilch for 24 years–that’s what happens as talent is dispersed among an increasing number of contenders. And, of course, in recent decades the impact of enhanced stats has made MVP voting less arbitrary–the impact of being on a pennant winning team was once very great. Now the voting occurs well before the “pennant” winner is known.
1968 seems of special interest to me, because it’s the only such match-up involving two pitchers, both of whom were also unanimous Cy Young winners. Fitting for the Year of the Pitcher. And it had a really interesting outcome. The HoF-quality guy, Gibson, was absolutely dominant, starting and completing three games, striking out 35 against only 4 walks and 18 hits total. He gave up five earned runs for a 1.67 ERA–but if you watched Game 7 you know that three of those were not really earned: they were the product of a two-out misplay by an outstanding center fielder. He even contributed a home run! But in the end he walked off the loser. While his opposite number, McClain, who also started three games, bombed in the first two and then coasted to a complete game win only after his team gifted him a 12-0 lead after 2 IP. But in the end his team won the Series, thanks to a different three-start three-CG pitcher who had received zero MVP vote-shares (and earned only 0.9 WAR), but matched Gibson when it counted. The whole thing was kinda Shakespearean.
Nice list, nsb.
You mentioned the disappointment of the 1942 matchup of Cooper and Gordon. In fairness to Cooper, his inflated ERA is mainly due to one bad inning in game 4, when he allowed the first six batters to reach in the 4th inning before being relieved. He had pitched okay in game 1, with 3 ER allowed over 7.2 IP, but was victimized by a dropped fly ball by Enos Slaughter that allowed two more to score.
Cooper’s main heroics were in getting the Cardinals to the post-season in the first place. St. Louis finished 38-6, erasing an 8½ game lead by the Dodgers, with Cooper going 7-0 over his final 8 starts in which he pitched to a 1.07 ERA over 76 innings.
Doug,
Gotta ask: “Has any team gone 38-6 in any stretch previously or since, let alone in the final 44 games of a major league season?”
The 1906 Cubs had 6 losses in their last 54 games.
Wow!! and they lost the WS 🙁
Thanks!!
It’s been done several times by the Cubs, Pirates, Giants, Yankees, A’s and Cards, most recently by the Yankees in 1939.
Thanks!
Richard, I’m not seeing a comparable stretch with the Yankees in ’39, though I can get them to 37-7 in a 44-game stretch (5/6 to 6/24).
I think the Tigers’ 35-5 start in 1984 is a more recent example in the same class, although it was “only” a 40-game stretch at .875 (vs. the ’42 Cards at .864).
If you put together the Giants’ two huge win-streaks in 1916 you get to 43-0 (17-0 + 26-0). Unfortunately, the rest of their season produced an equal number of wins: 43-66. (I know: not the same sort of thing . . .)
I re-ran my Stathead search and saw that the Yankees streak was in 1941, not 1939. I also saw that the Dodgers and the Guardians did it in 2017.
I see it, Richard. Quite a season for the Yankees. They were in 4th place before the streak started on June 10 and wound up taking the pennant by 17 games. I never paid attention to that season before.
Cleveland in 2017 has something a little shorter, but higher pct., 33-4, but it ends the season and so resembles the Cards in ’42. (It earned them the best record in the AL, but not the pennant–curse the postseason!) I’d completely forgotten the Dodgers stretch in that year–they went 52-9 and 56-11–they almost looked like the 1906 Cubs, with a .717 Pct. and a 21-game lead. . . . and then they went 1-16 from late August to mid-September.
How do these things happen?
Over a longer stretch, the Miracle Braves finished the 1914 season 61-16.
The Miracle Braves of 1914 had many parallels with the Miracle Mets of 1969. When I was young the thing we all knew about the Braves was that they had been in last place on July 4 and won the pennant. But in 1914 what people knew was that the Braves deserved to be in last place because they were a perennial last place team (as they were 1909-12, losing 100 every year) who had just emerged in 1913 as ordinarily bad, escaping the cellar with a 69-82 .457 record. Moreover, on July 4 the world was as it was supposed to be with the Giants dominating, looking to return to the Series for a third straight year to face the Athletics dynasty, in first on July 4 and on the way to an easy pennant drive.
So the fact that the team, 26-40 on July 4, went 68-19 the rest of the way and swept the A’s (who, in WAR terms, had a 51-36 advantage) isn’t what made them a miracle: it was that the team was the Braves.
The Mets’s story is eerily similar. They were coming off their first seven years with five last place and two ninth place finishes (evading 100 L only twice), and 1968 had seen them barely emerge from the cellar by a single game with a 73-89 .451 record, very close to the ’13 Braves. They got off to their usual slow start, but not quite bad enough to put them in the cellar. On May 27 they were 18-23–only on June 3 did they first break the .500 mark, and that was already a miracle: no Mets team had ever been over .500 except the 1966 team, who burst that barrier on April 17: their 2-1 record then was the only day a Mets team had ever spent over .500 (well, not quite: they had an off-day before their dominance came to a close). But after their 18-23 start the ’69 Mets added 82-39 .678. It wasn’t just the turnaround that was the miracle, it was that it was the Mets who turned around. And, of course, the 3-0 trouncing of the Braves in the league series and of the Orioles 4-1 in the Series followed. The Orioles were a 109-win team (with a WAR advantage of 62-41), expected to sweep; it was the A’s vs. the Braves updated.
One final note: On June 4, 1969 I was walking down Oakland Street and ran into a friend who was a devoted Cubs fan. The Cubs were trying to craft their own miracle and were leading their division by 8.5 games (on June 3!) at 34-16 .680. I was pumped up to 100psi by the Met’s breaking .500 and started ranting about it when he stopped me and said, “But this is the Cubs’ year, right?” “Absolutely,” I replied, “it’s your year, but I’ve been waiting since I was in junior high for the Mets to go above .500”–I knew about the 1966 one-day blip, but, c’mon–“and now it’s happened and they might actually go .500 for the season!” (Picture several small leaps for punctuation.) “But the Cubbies are great–don’t worry: this is your year!” (We’re still occasionally in touch, but we never speak of 1969.)
The fates of the 1942 Dodgers and 1969 Cubs would appear to bear some resemblance.
-In 1942, the Dodgers were up 9 on Aug 14, then lost a pair to the Cards on Sep 11-12 to fall into a tie with them.
-In 1969, the Cubs were up 9 on Aug 12, then lost a pair to the Mets on Sep 8-9 to lead by just half a game.
But, appearances can be deceiving. The ’42 Dodgers lost the pennant despite playing well down the stretch, just not well enough to keep pace with the Cards. Their 9 game lead disappeared despite going 16-13 from Aug 15 to Sep 12, and they lost a further two games to the Cards after that, despite finishing 10-4. So, from Aug 15 to season’s end, Brooklyn lost 11 games in the standings despite a 26-17 (.605) record.
Different story for the ’69 Cubs. Yes, the Mets played really well down the stretch, but a 19-27 Cub finish (.413) was the real culprit in their demise.
There is, however, a common link between the ’42 Dodgers and the ’69 Cubs, Doug. Their manager, Durocher. And we haven’t mentioned the ’51 Giants, whose 37-7 stretch run to close the season brought them into a playoff with the Dodgers, which they won (so 39-8 altogether). Also Durocher, though this time on the winning side of the race.
Durocher transformed teams. When he was made manager of the Bums in ’39 they flipped from perennial losers to a strong winning season and took the pennant two years later. 1942 was actually their best record since 1899, even though they lost the pennant. When he moved to a moribund Giants team in 1948 (not for baseball reasons; it was his gambling connections that screwed things up) he had them in the pennant race by 1950 and the Series the next year. The Cubs had edged above .500 only once in 19 seasons when Leo took over in ’66. He had them over in a year and apparently headed for a pennant in three more. But 1969 was one of the worst managerial jobs of all time.
Durocher was a McGraw style manager; I suppose he picked that up from Frankie Frisch during his time on the Cardinals. It was a successful model in general and Durocher got lucky with hot rookies (Pete Reiser and Willie Mays) whom he favored and protected (as he’d been favored by Miller Huggins, despite being far less talented). But Durocher’s fatal flaw was that he was a corrupt hustler. That wasn’t what brought down the ’42 Dodgers, but it’s very much what did in the Cubbies 27 years later. Leo let the clubhouse turn into a gambling house party when the team was high and it brought them down.
Replying to myself here. I said Durocher “protected” Reiser. Not the right word: he didn’t protect him at all, he boosted him (and thereby exposed him to the repeated injuries that tanked his career). Huggins had shielded Leo from players pissed off at his mouthy character, like Ruth and Gehrig, and started him despite his limited talents. Leo rushed Reiser along–Reiser was reckless and self-confident–and coddled Mays like an indulgent father when Mays was in the dumps. He wrecked Reiser but helped make Mays one of the best, if not the best position player ever.
It’s funny how there are some players whose careers were curtailed by injury, ailment, or even death, but they nevertheless have ultimately, if not immediately, been recognized as HOF worthy, while others with equal or better credentials are passed over. Reiser is the extreme case of the latter group in terms of career WAR, but he lost three full seasons to WWII, which makes his case exceptional.
Reiser, Thurman Munson, Nomar Garciaparra, Al Rosen, Charley Keller, for Pete’s sake, Eric Davis, Mattingly, Ray Chapman, Albert Belle, and if you take into account psychological debilities, Chuck Knoblauch, plus probably some I’ve forgotten. The list of pitchers, of course, starting with J.R. Richard, extends to the horizon.
I don’t begrudge the elevation of Ross Youngs and Kirby Puckett, in other words, but Munson and Keller were the superiors of either one, and I can’t rank them above the others I’ve mentioned. If tragedy is necessary to seal the deal, why isn’t Munson enshrined, not to mention Chapman?
Harold Baines in the Hall and not Charlie Keller?
Among Yankee players with at least 2000 PA Keller’s lifetime OPS+ of 153 puts him behind only Ruth, Gehrig, Judge, Mantle and DiMaggio.
Among Yankee players with 2000+ PA Keller’s OPS+ of 153 puts him behind only behind Ruth, Gehrig, Judge, Mantle and DiMaggio,
It would be interesting to go case by case on these, nsb. But I don’t feel the argument, “If X is in, Y should be” is valid. In my view Bains is a real error, but that shouldn’t mean anyone above his low bar should be in the Hall.
I do begrudge the elevation of Youngs–I didn’t think his case was strong and we know his “election” was the product of Frankie Frisch’s campaign to enshrine all of his friends. It discredited the Veterans Committee. (He’s not in a class with Puckett; George Sisler is.)
I think Keller’s worth the argument, but I don’t think Reiser is (despite the fact that–as I may have mentioned–I grew up a Brooklyn fan). Given Reiser’s actual career and the recklessness with which he treated his body, I think that had he played during the war years he would have knocked himself out of Hall contention as quickly as he did after the war. In any case, I don’t think we should induct players on the basis of one great season, a couple of solid ones. What would you then do with guys who have a comparable number of seasons but aren’t knocked out and just cool off? Keep ’em out because nothing awful happened to them before their strong years trailed away?
BTW, Reiser spent his war playing ball for the Fort Riley KS team, which had a lot of Major Leaguers (Joe Garagiola, Murray Dickson, Harry Walker and a bunch of others). Reiser told a story about a Black lieutenant who asked to play–he was told to go play with the colored team (there was none). So the team failed to add Jackie Robinson.
I see that the Hall of Fame has streamlined its four “era” committees down to just two, the “Classic” era (pre-1980) and the “Contemporary” era (1980 to the present). Hopefully, that will prevent too many more mistakes like Baines.
Here’s hoping that the Classic committee gets to work on electing Dick Allen and Bobby Grich, and the Contemporary committee does the same for Lou Whitaker (they being among the more notable snubs, to my mind).
Bob:
I said I don’t begrudge Youngs and Puckett, but I didn’t say that I think they should be in the Hall. I think Puckett’s elevation was more of an emotional catharsis for the voters, not based at all on his record, and Youngs might or might not have had a career through his mid thirties that matched what he achieved through his age 27 season, but there’s no telling.
And that really is my point. With the exceptions of Munson and Keller, who I feel have real cases to support them, I put the other names forth merely to illustrate the point that if we’re going to enshrine players on the basis of what might have been if only this or that hadn’t stricken them, then 1) some consistency would be welcome; 2) a special Hall designation should be created to signify how and why they are being honored,
And, by the way, Puckett is nowhere near George Sisler’s class. In Sisler’s seven year prior to his optic nerve problem he put up 47 WAR, leading the league twice in offensive WAR and finishing in the top ten six time, never below fifth. In the AL only Ruth did better. His OPS+ up to the eye problem was 155. Puckett’s seven big years yielded 37.6 WAR; he led the league once, was second once, and eighth once. His OPS+ peaked at 124. His eye problem, of course, put him out of the game completely.
We’re actually in agreement, nsb. Certainly, consistency would be welcome; I just don’t think we should let past inconsistency determine what future consistency should be. I think a Wing of If-Only added to the Hall of Fame is nice in concept.
And I didn’t mean Puckett was as good as Sisler or like Sisler, only that their cases are in one class and that Youngs’s is in another. Youngs, like Sisler, had seven productive seasons (4303 PA) but he only produced about 31 WAR in them compared to Sisler’s 47 (in 4280 PA). Puckett produced at a rate like Youngs but had ten really productive seasons (6504 PA, more than 50% above the others) with 45 WAR. So where Sisler adds value through a short and spectacular peak Puckett adds through a longer stretch of solid excellence, and the common feature is that their careers were brought to an end by medical issues before their different momentums could bring them across a clearly HoF total WAR. Youngs’s prime combines the trajectory of Puckett’s and the brevity of Sisler’s. If Puckett’s career had been one-third shorter I’m sure he would not have been considered for the Hall, although he’d have been Youngs’s peer.
Has it been widely noted that the Dodgers, who have now defeated the Yankees in four World Series (never mind losing eight!), have beaten the Yankees in 7 games (1955), 6 games (1981), 5 games (2024), and 4 games (1963)? I believe no other team has defeated a single opponent in each of the four possible Series outcomes. (If the answer to my question is yes it will show how embarrassingly out of touch I’ve become.)
Only two other instances of a team beating one opponent in the WS four or more times.
-Yankees over Dodgers: in 5, 6 and 7 games, but never a sweep
-Yankees over Giants: in 5, 6 and 7 games, but never a sweep
Only a few more instances of teams facing each other in the WS four or more times, showing series won.
-Cardinals (3) vs Yankees (2)
-Yankees (3) vs Braves (1)
-Athletics (3) vs Giants (1)
-Cardinals (2) vs Red Sox (2)
-Cubs (2) vs Tigers (2)
I’d like to title this “Hunter Greene 2024 and the Weakness of pWAR,” but I won’t.
Hunter Greene’s 2024 season, according to Baseball Reference, was the best in the NL, producing 6.3 pWAR. This total was accomplished in 150.1 innings, so it wasn’t a qualifying season, though he made 26 starts (and no relief appearances). His W-L record was 9-5, his team’s W-L record in those 26 starts was 11-15.
By comparison, Chris Sale’s Cy Young season produced 6.2 pWAR in 172.2 innings, 29 starts. Sale’s W-L record was 18-3, his team’s record 22-7 in his starts.
ERA: Greene 2.75, Sale 2.38
ERA+: Greene 160 Sales 1.74
FIP: Greene 3.47 Sale 2.09
WHIP: Greene 1.196 Sale 1.044
Where does Greene outdo Sale?
Largely in two ways, both negative:
Park Factor: Greene 106 Sale 100
RA9def ;Greene -0.17 Sale 0.00
Luckily, the Cy Young voters appeared not to fall into the trap, as they often do, of assuming that pWAR tells the whole story.
oops. Sale’s WHIP was actually even better at 1.013.
WAR looks at what pitchers do in each start against that particular opponent. Do well against a better team, and WAR rewards handsomely. But, do poorly against weaker opposition and those rewards will be clawed back.
Don’t know if that was at play in why Greene seemed to fare better than he ought to, or Sale to fare more poorly than seems right, but I’d start by looking at each outing individually, rather than the overall season stats.
I once found a similar instance of a pitcher’s WAR that didn’t seem to make sense. Then I looked at each start to see how may runs the pitcher allowed and how many runs that team scored on average, totaled up the plusses and minuses and came up with a number that closely approximated RAA and hence a similar WAR total. You can argue whether that’s the right way to evaluate a pitcher’s performance but that’s how WAR does it.
This is really interesting, Doug. I’ve known about this in terms of “strength of schedule,” but had never pictured it in terms of expected performance in individual games.
Doing a really rough calculation, it does appear that Greene had a significantly tougher overall strength of schedule, though it’s not a huge difference. And Sale’s worst outings were against the Marlins and A’s (8 ER in 4 IP on that one).
One thing I noticed was that although Greene missed a month in the latter half of his season, his second-half ERA (10 starts; 57.2 IP) was 1.09. Kind of impressive. This says nothing to nsb’s point, which is on target–strength of schedule notwithstanding–but I hadn’t known about it before. Compare second-half-Greene to “the unhittable Mr. Francis” and his streak:
IP: Francis 49 / Greene 57.2
ERA 1.47 / 1.09
BA .110 / .139
Each producing 4-2 W-L. Greene’s second half is not far behind a stretch that prompted an HHS special edition.
But, bottom line: WAR is information, not an answer. It may be constructive in drawing attention to Greene strength, but as a comparative tool it doesn’t seem to give a good assessment of 2024 Greene vs. Sale.
One further riff on the Greene/Sale comparison. I’m not sure how this would play out on a full analysis, but the comparison of team records in pitcher starts doesn’t seem like a particularly illuminating angle to me.
The contrast was 11-15 for Greene and 22-7 for Sale, which seems pretty stark. But if you look at games in which the pitcher pitched over 5 innings without giving up any runs, it turns out that Sale did it 6 times and his team went 6-0 in those games, while Greene did it 7 times and his team went 3-4. (Greene also had 4.0 IP on the season’s final day, but did not start the fifth.)
I can’t see any logic in casting shade on Greene for that very sharp difference. Sale pitched for a much better team than Greene, and Atlanta scored an average of 5.4 R/G for Sale, while the Reds’ average behind Greene was 3.4 R/G. So I’d just delete that from the comparison. nsb’s point will stand without it.
One of the penalties of not following MLB more closely is that when I pursue stats I sometimes encounter what appear to be inexplicable anomalies that just reflect changed practices I’m not used to, like runners appearing from nowhere and standing on second base or 7-inning games. Pursuing Hunter Greene further I encountered one of those, and it is especially unusual.
On June 6, 2022, the Reds and D’backs played a single 7-inning game in Cincy. I don’t see any indication of why the game was only 7 innings. there was no rain, and the Reds batted in the bottom of the 7th, ahead 4-0, indicating that the game wasn’t prescheduled to last 7 innings.
Actually, the game was not quite 7 innings. It ended with two outs in the bottom of the 7th, after the Reds had gone ahead by seven runs–sort of suggesting a mercy rule, but it did not end when the Reds went ahead by seven: another batter came to the plate and singles, at which point everyone went home. Maybe the lights went out (?).
The reason I was looking at this game was that I noticed that Greene had pitched a shutout in 2022 (thus sharing the league lead!) and was surprised he’d been allowed to pitch beyond the 7th. Of course, it turned out he wasn’t. But his performance was pretty remarkable nevertheless. The lead-off batter in the game, Daulton Varsho, started it off with a single: a bunt to the pitcher. But he was erased trying to steal on a third strike to the next batter, and after that, Greene retired 20 batters straight–a perfect game post-bunt single. (Brought to mind Ernie Shore’s somewhat similar 1917 perfect game.)
Greene has been allowed to pitch only once beyond seven innings. A bit earlier in 2022 he pitched to three batters in the 8th and was pulled with one out after two walks. The reason he was still on the mound was that he had allowed no hits. In fact, the game ended as a no-hitter (eight innings for Red pitchers, as they were visiting in Pittsburgh). Greene was the losing pitcher, the run scoring on a third walk and a groundout after he had left.
Note: Although the B-R game record says there was no rain in the 6/6/22 game referenced above, Greene’s 6.2-inning one-hitter, I’ve found contemporary accounts that say it was indeed rain that brought the game to a premature close.
I don’t know if anyone else will be interested, but here’s a subject I found worth looking into.
George Crowe
Luke Easter
Steve Bilko
Rocky Nelson
Marv Throneberry
Triple A First basemen of the Nineteen-Fifties. Only Easter and Crowe (one time only when he was age 36) had qualifying seasons that produced big league numbers approximating their minor league potentiality. Strange that they are bunched so closely together in time.
The most successful of the group at triple-A was the now all-but-forgotten Rocky Nelson, three-time International League MVP, who only found his big-league stride at age thirty-four platooning for the Pirates. Prior to that he disappointed managers in St. Louis (three times), Chicago, Pittsburgh (in 1951) Brooklyn, and Cleveland.
Steve Bilko hit 313 home runs, including consecutive seasons of 55 and 56, in 1532 minor league games. In 1954 he guarded the first sack for the Cardinals with not bad numbers, but circumstances didn’t go his way, and he ended up in the ultra-friendly confines of Home Run Derby park, little Wrigley Field in Los Angeles, pre-Dodgers, where he was the PCL’s MVP three years in a row. From 1958 through 1962 the six-feet one, two hundred seventy pound slugger held down the ground around first base as a part-timer or platooner for four teams, garnering a decent 2.2 WAR in 1961 for the expansion Angels, playing in his dream park once again, little Wrigley, while doing a balancing act with someone almost as huge, Ted Kluszewski, post-back trouble.
Marv Throneberry’s 15 minutes of fame (or 20 years in New York, strangely) I won’t go into. He got stuck behind Bill Skowron at Yankee Stadium, never making much of his opportunities to shine when the often injured Moose was out of the lineup, but he anchored some amazing lineups in AAA Denver for three years, including 1956 when the team featured Woodie Held, Bobby Richardson, Tony Kubek, and Norm Siebern, all of whom had long careers as starters in the bigs. That year was his, however: his 42 HRs, 145 RBIs, and 123 runs picked off the league MVP award.
Luke Easter and George Crowe had parallel careers in some respects, but not parallel lives. Both were the fifth of ten children, but Luke grew up in St. Louis, dropped out of school in the ninth grade, never made the Negro Leagues until he was in his thirties, and was the regular first baseman for Cleveland for three and a half years. He was always popular with fans, and after returning to AAA, from ages 38 through 43 he tore up minor league pitching, averaging over thirty home runs a year and 100 RBIs. At age 47 he played in 77 games for Rochester, batting .271.
George Crowe, in contrast, had a career somewhat similar to that of Jackie Robinson. A great all-around athlete, he was the first Indiana Mr. Basketball, graduated from Indianapolis University (then Indiana Central), leading the school’s basketball team to a 30-0 season one year and starring on the baseball diamond. In the service in WWII he had a run-in with a white Colonel and quit his base’s athletic teams, then got a transfer to another outfit, and finally spent over a year as a lieutenant in a quartermaster division in Asia. After his discharge he played pro basketball for a time on the same team in California as Jackie Robinson and Irv Noren. When the team went broke he crossed the country to play for the New York Rens, a team somewhat like the Harlem Globetrotters, but without the clowning. In 1948 the team played against George Mikan and the NBA’s Miineapolis Lakers in a game that was billed as the Championship of the World. The Lakers won 75-71. Crowe had also spent the summers of 1947-48 playing in the Negro National League, batting .306 and .349. Entering the minors at age 28, he batted .354, .353, .339 before the Braves brought him up to the big club, where he was stuck behind the likes of Earl Torgeson and Joe Adcock, with a full season return to AAA ball in 1954, where he led the league in doubles, RBIs, and total bases while bashing 34 HRs and hitting .334, the lowest average he compiled as a full-time minor leaguer.
Part-timing and platooning for Milwaukee, St. Louis, and Cincinnati from 1955 through 1961, he got his only chance to really shine in 1957. In 532 PAs, he hit 31 HRs, drove in 92, and batted .271. He was well-liked and respected, especially by his friend Jackie Robinson, who wrote “Crowe was the most articulate and far-sighted Negro then in the majors. . .. Young Negroes turned to him for advice.”
As it turns out, nsb, someone else was interested. Thank you! Maybe not high heat stats, but high heat history. I’ve always known about Easter but have no memory of him. I remember all the rest, although I think that among them I saw only Throneberry play (for the Yanks and Mets–badly).
I have to dispute one small phrase, however. Rocky Nelson is not all-but-forgotten. He was the foil to Mickey Mantle’s famous base-running masterpiece in the ninth inning of the WS deciding game in 1960. Without Rocky’s (understandably) slow reflexes, there would have been no Mazeroski heroics. I believe we were un-forgetting Nelson’s role on this blog not long ago. (Nothing else to quibble about. I live in Indiana and was never before aware of Crowe’s basketball role in the state. Thanks for that too!)
Bob:
George Crowe’s brother Ray coached the famous Crispus Attucks High School State Champions in 1955-6, with Oscar Robertson as his star player. One loss in two years, a 45 game winning streak, and a pair of titles. The team was far more renowned in it’s time for being the first all-black team to win a state crown than was the fluke of the previous year when little Milan HS, enrollment 161, took the title and spawned that terrific film, “Hoosiers,” starring Gene Hackman, who like myself grew up just over the state line in Danville, Illinois.
I can see how you might be more familiar with mid-century Hoosier sports than I, nsb, growing up so nearby. Of course, I know about Crispus Attucks, but not its sports history. “Hoosiers” was certainly terrific (but in my town people talk about “Breaking Away”), and anyone who grew up where Gene Hackman did has my automatic respect, though you had it on other grounds already.
In that 1957 season, Crowe was one of 5 black players in the top 8 of NL HR totals, including Aaron and Banks at the top of the list.
Easter made the top 10 in AL HR in three straight season (1950-52), including 2nd to Larry Doby (who made top 10 just about every year) in the last of those seasons. It would be 35 years before the Indians next had a pair of 30 HR sluggers.
Off the beaten path, once again….. On October 3, 2015, the Nationals’ Max Scherzer pitched a 9-inning no-hitter, striking out 17 NY Mets. The lone blemish appears to be a Yunel Escobar throwing error in the bottom of the 6th. His teammates managed to strike out an additional 18 times without taking a walk. QUESTION: Are these 35 strikeouts a record for a 9-inning game without a single base on balls?
Interesting path, Paul. I can’t answer, but I’ll be astonished if the answer isn’t yes.
In following up, I discovered that Scherzer’s game score of 104 was second only to Kerry Woods’ 105 in his 20-K game on 5/6/1998, as far as nine-inning games were concerned. But Joe Oeschger’s 153 in his 5/1/1920 26-inning CG is the highest ever (over 50% beyond Woods’–Oeschger’s opponent, Leon Cadore, scored a measley 140). While those are all interesting stats, the reason I’m writing this is because I discovered that Oeschger actually pitched two CGs of 20 innings or more. On 4/30/1919 he pitched 20 innings. As in his game a year and a day later, his opponent was Brooklyn (though Oeschger moved from the Phillies to the Braves), and both games ended in a tie. The famous 1920 game ended with the score 1-1; a year before Oeschger was a little less effective and the score was 9-9. In fact, his game score of 58 (he gave up 24 hits!) was lower than that of his opponent, Burleigh Grimes (79).
So my question, down a completely different winding path, is this: How many pitchers in history pitched multiple 20-IP complete games?
Per Baseball-Reference Joe Oeschger is the only pitcher with multiple 20+inning CGs.
Thanks, Richard, Always good to hear from you. And it feels nice to think I stumbled on an obscure piece of baseball history that readers of HHS can use to stump friends and earn admiring eye-rolls. (Even though I actually have always been a fan of Brooklyn’s Leon Cadore.) Happy Thanksgiving!
And a happy Thanksgiving to you, Bob.
Paul:
In response to your question I found that there have been 44 games, with any number of innings, with a combined 35+ strikeouts but none also with 0 combined walks except for the Mets game that you mentioned. The closest I found was a a Yankees-Astros game on 9/29/2013. There were 35 strikeouts and 2 walks in a 14 inning game. My search covered the years 1901 through 2022.
Richard,
Thank you for the response. Pretty bizarre anomaly…..actualy, incredible to think that a guy pitches a 17-strikeout/0-BB no-hitter and his teammates go and strike out even more frequently without taking a walk. But, based on where the game appears to be headed, I wouldn’t doubt it happening again.
Some Thoughts on No-Hitters
Part 1: Hall of Fame Cred?
My memory may be wrong, but as I recall, back in the 1950s and 1960s one of the preferred items on a pitcher’s CV for entry into the Hall of Fame was a no-hitter.
And at that time, when the Hall was barely out of its infancy with very few members, the majority of great pitchers had thrown one, or in Cy Young’s case, three. Nevertheless, there was no real logic to this notion since, in the first 60 years of the Twentieth Century, while there had been 97 no hit performances, 102 if the Federal League is included, just 23 of them had been pitched by HOFers, several of whom hadn’t, as of 1960, been admitted to Cooperstown.
As of this writing, 31 HOFers account for 49 of the 279 no-hitters twirled in the AL and NL since 1900. Nolan Ryan, of course, pitched his record 7, Young, Feller, and Koufax 3 each, and some others did it twice. But the remaining 33 HOFers of the era—I’m excluding relievers, except for Wilhelm and Eckersley, who both threw one and so are in the other category—33 HOFers failed the test, including
300 game winners:
Pete Alexander
Steve Carlton
Lefty Grove
Greg Maddux
Roger Clemens—oops, not in then Hall
Eddie Plank
Don Sutton
Tom Glavine
Early Wynn
Who else?
Pedro
Fergie
Robin
Whitey
Mordecai
Drysdale
Newhouser
McGinnity
And 17 more.
Part 2: The Anti-HOF
Sixty-four HOFers pitched 49 no-hitters, seven of them perfect games. (I’ll get to perfect games later.)
At the other end of the spectrum, though, 46 no-hitters were thrown by pitchers of less than overwhelming—often far less than overwhelming—careers. My criterion for singling out these 46 was perhaps simpleminded and arbitrary: the pitcher had to have fewer than 70 career wins. I leave it to another to devise a more accurate means of assessment.
Of the 45 on my list—yes, one of them found the magic twice— only 13 had winning records. Nine won 50 or more games, but of those nine only three had winning records. Four won over 60 games in their careers, but all had losing W-L stats. The best pitchers of the 45 were probably Nick Maddox 43-20, Tom Hughes 56-39, Paul Dean 50-34, and Tom Phoebus, 56-52. The pitcher after these four with a career winning record won a total 38 games, the next 35, the next 31. I don’t think my criterion is far off the mark.
The tone was set in 1901 by the first no hit pitcher of the century, Pete Dowling, who beat Christy Mathewson to the punch by 15 days. Career record 39-64. In 1922 the third perfect game of the century (and the last prior to Don Larsen’s in the 1956 World Series, a dry spell of 34 years) was hurled by the immortal Charlie Robertson, career record 49-80. Some other remarkable lifetime records of No Hit Pitchers: Iron Davis 7-10; Bobo Holloman 3-7; Bo Belinsky 28-51; Jonathan Sanchez 39-58. Tyler Gilbert, still active as of his age 30 season, has a 2-7 mark lifetime with a career WAR of 0.9. Bill Stoneman threw a pair of gems in his 54-85, 4.5 WAR career.
Here is a list:
Anti-HOF No hit pitchers
Pete Dowling 39-64
Weldon Henley 32-43
Johnny Lush 66-85
Mal Eason 39-73
Big Jeff Pfeffer 31-39
Nick Maddox 43-20
Iron Davis 7-10
Jimmy Lavender 63-76
Tom Hughes 56-39
Ernie Koob 23-31
Charlie Robertson 49-80
Bobbie Burke 38-46
Paul Dean 50-34
Dick Fowler 66-79
Ed Head 27-23
Don Black 34-55
Bill McCahan 16-14
Rex Barney 35-31
Cliff Chambers 48-53
Bobo Holloman 3-7
Bob Keegan 40-36
Bo Belinsky 28-51
Dave Moorhead 40-64
Tom Phoebus 56-52
George Culver 48-49
Bill Stoneman(2) 54-85
Ed Hallicki 55-66
Mike Warren 9-13
Joe Cowley 33-25
Juan Nieves 32-25
Tommy Greene 38-25
Jose Jimenez 24-44
Bud Smith 8-9
Jonathan Sanchez 39-58
Dallas Braden 26-36p
Phillip Humber 16-23
Henderson Alvarez 27-35
Chris Heston 13-13
Lucas Giolito 61-62
Alec Mills 12-14
John Means 23-26
Spencer Turnbull 15-29
Tyler Gilbert 2-7
Reid Detmers 16-28
Domingo Germain 31-29
Another great deep nsb dive—tripartite, no less. This is what makes HHS fun to check in on, especially on a cold winter night. (Autumn, but never mind: it’s cold and snowy.) Reading through these, my eye rested on the name of perhaps the most unHallworthy no-hit pitcher in history, Bobo Holloman (lifetime 3-7). I’ve loved his story ever since reading about him in Bill Veeck’s autobiography, Veeck As In Wreck. I found the book on the shelf after reading nsb’s posts and re-read Bobo’s Saga, per Veeck.
Veeck spends a memorable couple of pages describing Holloman’s epic performance. The game occurred near the start of the ‘53 season when Veeck was in desperate financial trouble, his attempt to move his St. Louis Browns to Baltimore having been blocked by hostile league owners over the winter. The league was trying to squeeze him out, the fans were boycotting the team, he’d sold the team’s stadium and his own ranch out west to raise cash, and his longtime assistant had mortgaged his own home to help Veeck meet payroll. After recounting the many financial screws that were being tightened on his basically bankrupt Browns, Veeck says this:
“And finally, there was visited upon us in our time of travail the final affliction of Bobo Holloman’s no-hitter. Now really, I know Job had a hard time of it, in spots, but Bobo’s no-hitter would have broken his spirit.”
Veeck had obtained Holloman over the winter from Syracuse in the International League and paid $10K, with the proviso that if Holloman stayed with the Browns past June 15 Veeck would fork up another $25K. When Holloman showed up he turned out to be a big personality with small skills. Veeck: “He could outtalk me, outpester me, and outcon me. Unfortunately, he could not outpitch me.” When it became clear that he was headed back to Syracuse, Holloman, who spoke of himself in the third person, complained about having worked only in the bullpen, but not as a starter, which was his destiny. “You haven’t given Big Bobo any chance.” Marty Marion suggested that he start Bobo in one game as a courtesy before Veeck sent him down and Veeck said ok. On May 6 Bobo faced the Athletics, a team that was headed for a season nearly as bad as the cellar-dwelling Browns. Holloman entered the game with an 8.44 ERA. Here’s a portion of Veeck’s account of the game and its aftermath.
“Everything he threw up was belted. And everywhere the ball went there was a Brownie to catch it. . . . [Veeck details the game’s many miracles.] . . . With two out in the ninth a ground ball was rifled down the first-base line—right at our first baseman, Vic Wertz. Big Bobo had pitched the quaintest no-hitter in the history of the game. Big Bobo Holloman was one with the immortals. Even among immortals Big Bobo was immortal; he was the only pitcher in the twentieth century to pitch a no-hit game on his first major-league start. I’m not any more superstitious than the next man, but I don’t think it’s really wise to send a man back to the minor leagues right after he’s become immortal. I bought him a TV set as a reward for his splendid work and resigned myself to digging up $25,000 for Syracuse. Before the year ended I managed to sell him, slightly frayed but a certified immortal, to Toronto for $7,500. Big Bobo’s dandy little no-hitter had cost me $17,500 and a TV set.”
Holloman played out the season (poorly: 5.07 ERA) for Toronto’s IL team, made brief appearances for five teams in a descending series of five minor leagues in 1954, and then was out of baseball.
The other notable Bobo was Mr. Newsom, who could also out-talk anyone with whom he might strike up a conversation and who also mostly spoke of himself in the third person.
Newsom never tossed a no-no, but did twirl 5 one-hitters, including this 1934 game in which he lost his no-hit bid with two out in the 10th inning.
Part 3: Games Perfect, Pitchers Not Always
Seven Hall of fame pitchers have tossed perfectos out of the twenty-two on record, names to be reckoned with: Young, Joss, Bunning, Koufax, Randy Johnson, Halladay, and (maybe) Catfish Hunter, who at least had his moments. Some other names on the roster are also impressive, led by Dennis Martinez, who won 245 games in a long, workhorse career. Kenny Roger, David Wells, and Mark Buehrle all chalked up over 200 victories, and David Cone hit 194.
Nevertheless, including the immortal Charlie Robertson, the list provides the names of six players who are lifetime under-.500 throwers, from Don Larsen at 81-91 to Philip Humber with his 16-23 record and 0.9 WAR. Three of the last 5 gems have been pitched by people whose names may someday be answers to a trivia quiz, Humber, Dallas Braden, and Domingo German.
At this point, like Johan Sebastian’s son, Wilhelm Friedemann Bach, you may be asking the question,”So, old man, what’s the point of this Three Part Invention?” (Sorry. Look it up.)
Answer? A few observations, mainly.
Unfortunately, the spectacle of a pitcher being removed from a no-hit bid has become much more common in recent seasons, with 18 such games of 7+ IP through the 2021 season, and 18 more since 2022 (click on the link below for a graphical view).
Number of Games with Starting Pitcher Removed after 7+ No_Hit IP
For trivia buffs, the first pitcher to suffer this fate was Johnny Klippstein of the Reds in this 1956 game. Reds’ manager Birdie Tebbetts was evidently way ahead of his time, pulling Klippstein before facing Mathews and Aaron for a fourth time.
Klippstein, the epitome of the journeyman pitcher, spent 18 usually undistinguished seasons in the majors, first as a swing man for the Cubs and Reds, then as a mostly middle reliever for seven other teams. Two of them, the 1959 Dodgers and 1965 Twins, won pennants, and Klipp’s 3 World Series appearances were perhaps the twin peaks of his career: 0.00 ERA.
Thanks for the graph, Doug. Removing no-hit pitchers early is smart baseball and bad for baseball, like so many probability-based trends.
I suspect Tebbetts wasn’t thinking about the bottom of the 8th inning so much as the top. Klippstein was wild that night and had let in a run, so the Redlegs were behind. Tebbetts pinch-hit for Klippstein with a runner on second and one out to try to tie the game. (1956 was a break-out year for Cincy and they were contenders for the first time in a decade so even though the season was young there was something real at stake.)
By the way, that counted as a no-hitter in ’56, as had Newsom’s game ’34. MLB changed the rules decades later later in the ’90s, a decision that I think was very poorly advised, especially when applied retroactively–a perfect way to purge interesting history in favor of narrow accounting rules. I remember first learning about Klippstein’s semi-no-hitter–when it was still a no-hitter–on the back of his 1959 Topps card.
Thanks for the info on the rule change, Bob.
I can understand Newsom’s game once being regarded as a no-hitter, having recorded 27+ outs. But, Klippstein had only pitched 7 innings. Do you know what was the minimum number of outs required to qualify for a “no-hitter”? Incidentally, Kilippstein had only one other start allowing no hits, in this 1954 game. Like his 1956 game, he walked 7, but in only 3 IP.
Klippstein seems to have found his stride late in his career, pitching to a 2.44 ERA in just over 300 IP (all in relief, save for one start) over his final 5 seasons. His 6.5 WAR over that stretch almost matched the 7.2 WAR he compiled in over 1600 IP to start his career. Klippstein’s 52 point ERA+ improvement (from 90 to 142) in the second period is easily the best among pitchers with 1500+ IP thru age 34 and 250+ IP after, with Tom Gordon in second place with only a 30 point improvement.
Hi Doug. Klippstein wasn’t credited with a no-hitter: the Redlegs were credited with one. They did complete a 9-inning no-hitter, but the game went into the tenth and the third pitcher, Joe Black, gave up the first hit in the tenth. So the game was a no-hitter but no one pitcher got credit for one. Had the game ended in a 1-0 loss after nine (where it was headed) it would still count as a team no-hitter.
A more poignant example is Harvey Haddix’s 1959 perfect game, which is no longer a perfect game — or even a no-hitter — because of an error, intentional walk, and then a walk-off hit in the 13th. Haddix retired 36 straight batters — unsurpassed — against the most powerful offense in the league and isn’t even credited with a no-hitter. Another perfect game that disappeared was Ernie Shore’s in 1917. Babe Ruth started, walked the first batter, got himself tossed protesting, and then Shore retired 26 batters in a row after the initial baserunner was caught stealing. Kids like me (as I once was) learned about the game because it was listed among perfectos with an asterisk that explained the exception. In 1991 MLB just eliminated all the asterisks along with the games, so they are now just lost to new fans. (I you ask me — and no one has — Armando Galarraga should be awarded an asterisked perfect game as well. When you use asterisks instead of a blindered definition, you can substantially right an injustice.)
But to answer your question, prior to 1991 any starter who pitched a no-hit CG had a no-hitter. So if the game had been rain-shortened and ended in a 0-1 loss for Klippstein after seven, he would have been credited with a no-hitter. Theoretically, a no hitter could involve as few as 4 IP (if the visiting pitcher’s no-hitter ended in, say, a rainout loss — don’t know whether that’s ever happened). The shortest example I remember is Mike McCormick’s rain-shortened 5-inning no-hitter in 1959. But there were many others, all appropriately asterisked, and everyone understood the discount to be applied. I think there’s a stronger case to be made for not counting sub-9-inning game as a no-hitter than not to count a 9-inning no-hitter because there was a hit in extra innings. But there’s just no need to exclude any of them.
Thanks for clarifying, Bob.
That 5 inning no-hitter by McCormick is one of eleven of that length (none shorter), ten of which came before that 1991 rule change, so would have been recognized as no-hitters at the time. The longest no-hitter still recognized as such is 10 innings by three pitchers, including Jim Maloney in 1965 when he “scattered” 10 walks and a HBP (the other two were more impressive, at one and two batters over the minimum).
I remember seeing (on TV) Mark Gardner of the Expos lose a no-hitter in the 10th inning against the Dodgers in 1991. Two days later, Dennis Martinez tossed his perfecto, to make it two Expos no-hit games in three days, under the old rules. Or, maybe the rules didn’t change until after the 1991 season, because the announcers (Dave Van Horn and Duke Snider) seemed to be under the impression that Gardner had his no-hit game once he completed 9 innings.
Your comment on Gardner reminded me of watching (also on TV) Milt Wilcox’s 1983 perfect game go up in smoke on the 27th batter.
Those other two 10-inning no-hitters were remarkable. (I can’t see the second page of your Stathead table but I’m guessing they’re by Fred Toney and Hooks Wiltse.) Toney’s 1917 game may not be as famous as it used to be because of the 1991 rule change. Before that, the game was famous as a “double no-hitter“: neither Toney nor his opponent, Hippo Vaughn, gave up a hit in nine innings. In the top of the tenth Vaughn gave up a single, which led to a run scoring after an error and then a freak play on a slow roller. Under the old rules, Vaughn still had a no-hitter, but not anymore. The earliest baseball book I recall reading had a stirring account of the game.
The Wiltse game in 1908 was a bit like Gallaraga’s. Wiltse retired the first 26 men in order, and then he retired the 27th too, striking out the opposing pitcher, George McQuillan, but the umpire missed the call, as he publicly acknowledged later. The next pitch hit McQuillan (probably aimed at the umpire!). Wiltse then finished retiring the side, but with the score 0-0 the game went on. Wiltse pitched a perfect 10th. Unlike Gallaraga he was credited with a no-hitter, but they share having lost a perfect game with two-outs in the ninth because of an unquestionably erroneous umpire’s call.
Your remarks about viewing no-hitters on TV brought to mind the memory of my father, on a business outing to Chicago in 1960, having witnessed in person Don Cardwell’s inaugural start for the Cubs after being acquired from the Phils. It was a one walk, no hit win over St. Louis.
In looking up this game at Baseball Reference, I came across the astounding fact that in the following year, 1961, Cardwell led the NL in Pitching WAR at 6.1.
How? Why?
His 15-14 record for a 64-90 team?
But 1) He was 10-5 at home, not extraordinarily better than the the team (40-37) and 5-9 on the road, matching the team’s ineptitude there (24-53).
2) His record in terms of run support was ordinary: 1-11 when his team scored 2 or fewer runs, 14-2 with better support. ( He had a relief loss.)
3) Against teams with winning records he was 9-13 with a 4.47 ERA. Against losers he was 6-1, 2.19.
4) He finished out of the top 10 in ERA and ERA+, in fact in almost every important pitching stat. You name it, he wasn’t named, in WHIP, H9, FIP, PR, PW, RE24, WPA, REW, He was fifth inWPA/LI, and showed up middling in a few other registers largely because of his 259 Innings pitched.
As in my remarks earlier in this string, but with even more conviction, I confess to being baffled by too many of the outcomes of pWAR over the years to look upon it as a completely reliable measure.
It’s not just the elimination of asterisks that are irksome about the new regime of the Baseball Gods.
nsb, I think you’ve hit on a terrific example to crystallize reasons for skepticism. Cardwell’s pWAR leadership is completely counter-intuitive. I’ve been poring over the relevant stats to try to explain it, comparing Cardwell to the top ten leaders in ERA+ (among which he does not rank, as you point out).
I’ve found no correlation with things like RA/9IP or FIP. But I do think I understand how the figure was arrived at, in general. The main issues seem to be (1) offensive strength of opposition; (2) park factor for all parks pitched in; (3) defensive quality of the pitcher’s teammates.
B-R calculates the RA/9 that an average pitcher would allow given those factors (RA/9avg) and then compares it with the RA/9 of each pitcher. There’s a good correlation between pWAR and (RA/9 – RA/9avg); that is, the incremental runs saved by each pitcher compared to an average pitcher. (Other factors will include simple things such as total IP.)
The key thing about Cardwell is that while he had a solid RA/9 in light of opposition strength and pitched in somewhat challenging field environments, the Cubs were awful in the field, by far the worst in the league. Here’s a table of the 10 ERA+ leaders (ranging from 141 to 116, with Cardwell at 109) and Cardwell, showing fielding quality, personalized park factors, net runs saved vs. average, and pWAR (RA9def / park factors / RA9 – RA9avg / pWAR):
Simmons 0.30 / 110 / -0.53 / 3.2
Gibson 0.26 / 108 / -0.90 / 4.4
O’Toole 0.22 / 99 / -0.83 / 5.1
Spahn 0.39 / 88 / -0.44 / 4.0
Koufax -0.20 / 105 / -1.00 / 5.7
Gibbon -0.05 / 97 / -0.67 / 3.5
McCormick 0.13 / 93 / -0.61 / 4.3
Sadecki 0.28 / 107 /-0.68 / 4.0
Jackson 0.29 / 109 / -0.62 / 3.7
Drysdale -0.23 / 105 / -0.99 / 5.4
Cardwell -0.45 / 103 / -1.10 / 6.1
As I understand it, RA9def gives the quality of the fielders in each game, but not of the fielding. That is, Cardwell may have benefited from poor fielders fielding well when he pitched, and all the credit goes to him, while it may have been that whenever he pitched he gifted everyone a few greenies before the game. It’s like park factors that won’t reflect that a pitcher often pitched with a strong wind blowing in from center field.
But whether the measures are valid or not there is a logic to them, and they highlight how pWAR seems to be based on a platform independent of traditional stats, and even popular advanced stats (like ERA+). The theory behind it is sort of topographical. Instead of picturing every game as being on a level playing field, pWAR tries to create a contour map that includes uphill/downhill forces bearing on performance, and then map play over those contours.
Maybe a new asterisk is needed:
pWAR*
*Be warned .This measure is not meant to indicate that the highest number denotes the best or most effective yearly performance.
Amend that to read “. . . that the highest number necessarily denotes . . .”
Maybe. When we were kids, the number that I recall dominating discussion of pitching excellence (among kids, at least) was W-L. At some point that became W-L* (This measure . . .). ERA became the gold standard, and I think it remained that until advanced metrics were developed, although W-L still had a lot of impact on Cy Young-type assessments. When I began using advanced stats, I felt ERA+ had superseded ERA*, and pWAR was kind of a black box.
You probably won’t remember but at one point I became obsessed (on HHS) with new fielding metrics. I began to proselytize The Fielding Bible, reading every edition carefully and introducing methods from it in strings here. It seemed to me to open an enormous new door to understanding the game, both because the methods appeared to provide a real way to measure fielding value and because when it came to fielding value there was so much more of it than I’d imagined.
So when I see the impact of fielding support on pWAR the black-boxness of pWAR seems reduced and the logic of looking at ERA+ as ERA+* seems enhanced. I’m prepared to agree with your formulation of pWAR*, but not as a way of suggesting that we rely more on ERA+, ERA, FIP, or whatever (W-L!), but that the statistical history being created from Statcast data may supersede the type of context-bound assessments that pWAR is based on.
But in the meantime I’m perfectly fine with holding the warranted skepticism about cases like Cardwell alongside continued respect for the transparency of ERA/ERA+ and recognizing that the remaining black-box features of pWAR require us to avoid regarding it as definitive. Accepting Cardwell’s superiority in ’61 is a big stretch. (And it’s especially nice for a Dodger fan like me that if we ditch Cardwell as the pWAR leader in ’61, the much more intuitive result is to award the blue ribbon to Koufax!)
Here’s an addendum: After my last post, which ended by referring to Cardwell as the pWAR leader, I thought: I should have said NL pWAR leader! Obviously, I thought, Cy Young winner Whitey Ford, who went 25-4, must have been the MLB pWAR leader. That was my pre-teen brain speaking — Ford’s award was based on that gaudy W-L, plus the Yankees’ dominance.
Ford not only wasn’t the AL pWAR leader, he wasn’t even in the ERA+ Top Ten — but neither was the pWAR leader: the Twins’ Jack Kralick, whose 13-11, 3.61 ERA, 6.0 pWAR season was positively Cardwellian. There are a few differences in Kralick’s factors — very few UER plays a role, countering a less egregious defense — but the basic calculation is the same and the result equally counter-intuitive.
In 1961 the Cy Young voting was MLB-wide and voters could name only one pitcher (Ford 9 [pWAR 3.7!], Spahn 6 [4.0], Lary 2 [4.3]), so it’s not strange that neither Cardwell nor Kralick were mentioned. But eight pitchers in each league received some MVP votes — neither Cardwell nor Kralick were listed anywhere on a single ballot. (The only pitcher to get a first-place vote was Joey Jay — go figure.)
Anyway, the upshot is that Cardwell really was the MLB pWAR leader after all.
Bob:
Just to bring things into perspective, Ford led the league in Wins and W-L percentage, and in the games he started the team went 34-5. He also ranked first in the AL in FIP, RE24, WPA/LI, and REW. He finished second in strikeouts and in the league top ten in ERA, WHIP, SO/BB, pitching runs, pitching wins, WPA, and a variety of other categories.
Against teams with winning records he was 9-2 with a 1.86 ERA. There were only 4 winning teams that year.
His real challenger in the AL, Yankee killer Frank Lary, had very similar results on the surface, but he failed to lead the league in any categories except complete games. His record against winning teams was also good, 9-3, but with a high ERA of 3.58. Versus the Yankees, he was 4-2, but a 4.34 ERA kind of undercuts that. Ford was 3-0 against the Tigers with a 2.00 ERA.
Warren Spahn, the third pitcher to draw CY votes, led the NL in Wins, ERA, WHIP, CGs, Shutouts, and REW, finishing in the top 10 in many additional categories. He showed 11-9 against winning teams with a 3.50 ERA, but against the pennant winning Reds he was 1-5, 6.51.
Sandy Koufax had his breakout season in 1961, led the league in all the strikeout related categories and FIP. Showed in the top ten in many other categories. He was 10-7 against winning teams but with a 4.06 ERA, 3-2 against the Reds with a 4.33 ERA.
Any of these guys was a better pitcher that year than either Cardwell or Kralick. Cardwell was actually 4-1 vs Cincinnati, but he was 1-6 vs the second place Dodgers. Kralick was 1-3, 5.02 vs New York. And, as already noted, neither hit the leader board in most categories.
Another category I looked up is Quality Starts:
Ford 24 62%
Lary 25 69%
Spahn 19 56%
Koufax 22 63%
Cardwell 20 53%
Kralick 18 55%
Cardwell and Kralick don’t exactly lead the pack.
Well, I’d vote for Lary above all of them, but that’s only because I loved going to see him beat the Yankees.
The thing about all this is that most traditional stats are simply not in conversation with pWAR. Of course W-L is irrelevant, but so are quality starts and even W-L outcomes vs. .500+ teams. Those are not the things pWAR measures — it’s blind to outcomes on that level.
I think the main counter-intuitive ingredients in pWAR are defensive strength and park factors. I’ve pointed out how Cardwell is given enormous credit for performing as he did with a really terrible fielding team. That’s not just errors: it’s fielding outs not made that a pitcher with an average team can count on. A good example of park impact is the gap between Spahn, who pitched in parks that, overall, had an 88 park factor, and Cardwell, at 103. When you add in fielding (Milwaukee was by far the best fielding team and the Cubs more than twice as far below average as the next to worst, using Total Fielding Runs) you can see why pWAR evaluates Spahn as if he were pitching down a mountainside and Cardwell as if he had a hurricane blowing towards the outfield. Ford’s factors are very close to Spahn’s (fielding even better, park factors slightly less pitcher-friendly [93], but still very much so).
You’re perfectly right to point out how a level playing-field model of performance makes pWAR seem arbitrary. It does. And to the degree that pWAR is still a black box it’s asking a lot for people to have faith in its calculations of performance based on imbalanced topographies. I’m a partial convert because I had a come-to-James moment as I studied each volume of The Fielding Bible. I was brought to deep faith in the huge and largely invisible impact on pitcher performance of teammate quality in the field — the magnitude of the plays-not-made factor. I’ve forgotten it now, but for a time I suddenly was able to speak the language of Total Fielding Runs. But I have total sympathy with how random pWAR results can seem otherwise.
Basically, in the pWAR world, pitchers on lousy teams are not only likely to have poor W-L records, they’re going to have poor ERAs because of bad fielding beyond errors. They’ll catch no breaks that the ballpark dimensions don’t give them, and they’ll get pulled from more games earlier because it will have appeared to the managers of the time that they were pitching poorly when they were doing an average job. Batter who seemed to have solved them were actually solving the defense.
So what I’d urge for someone who has not been baptized in the church of Total Fielding Runs is to look at counter-intuitive pWAR results and resist thinking, “That’s nuts!” and instead think, “That’s pretty interesting . . . but it’s not for me.” There’s no reason to take something on faith when the spirit has not moved you.
Bob:
The problem I see with the fielding business is that it’s based on a model that concerns itself in part with what didn’t happen. Derek Jeter was a less than outstanding fielder, no one denies that, but somehow his team managed to play .600 ball over his career and win their division 13 times in the 17 years that matter, finishing second three times. Was it just that his hitting more than counterbalanced the poor fielding, or did the other fielders on the team make up for his deficiencies, or perhaps did he, as many clutch players were always assumed to do prior to the movement to deride the concept—did he make the plays that counted? Who knows? Further, were those particular missed opportunities capable of being handled by an average shortstop? By a Belanger? Would they have handled them, every one? In spite of theory and mathematical probability formulas, it is impossible to say exactly because they weren’t handled by anyone at all.
Models don’t allow for variants outside the norm. According to the best models of human ability and achievement, Shakespeare’s plays were written either by an infinite number of chimpanzees pounding on an infinite number of typewriters, or by Marlowe (after he was dead), Bacon, Raleigh, or the Dukes of Hazard, but not by a former school teacher from the sticks without much personal ego, who was content to go back to an obscure life after he’d made his mark and his pile. In spite of all the noise to the contrary, though, all the reliable evidence, which has gradually grown over the years but which no unbiassed scholar has ever doubted anyway, indicates that it was Will of Stratford who wrote Hamlet, Lear, R&J, Julie Cesar, The Tempest, Othello, the Shylock thing, and so on. Any contrarian is making Much Ado about Nothing because no one can tell him it’s As You Like It.
NSB,
For what it’s worth, Jim Palmer has lower-than-expected FIP numbers that are possibly due to an infield of Brooks, Belanger, Grich and a CF like Blair and all-field, no-hit catchers like Dempsey and Etchebarren. Catfish Hunter has similar issues with FIP but, probably more Oakland Coliseum related with all the large foul territory and cool weather?
As for Jeter? Great teammates help cover a lot of blemishes. The way he hit, he’s a Hall of Famer if he plays left field or DH’s. But, “past a diving Jeter” was a John Sterling call as often as his famous home run announcements.
nsb, I can say with absolute confidence that I’m not going to be able to persuade you about the “fielding business.” These are the sorts of issues I had with it before I began to devote time to understanding the system behind it. I found there were more things in fielding data than were dreamt of in my baseball philosophy. It was time consuming to learn about, and the sources I used were already dated then (my latest Fielding Bible is now almost a decade old) — and, honestly, my memory of those pre-pandemic studies no longer runs smooth; “mere oblivion” is more like it.
But, yes, the metrics establish norms for many different types of plays at each position and compare performance to those norms with +/- values that accumulate over the course of a game and season, with WPA factored in, and the work is play-by-play over whatever quality data exists for each era. (So the 1961 data would be less reliable than the 2001 data, which shows Jeter’s poor performance in that banner Yankee year — not made up for by the Yankee defense; it appears to have been made up for by Yankee offense.)
Having said this much I can’t go further. The best data goes back only about twenty years and the idea is pretty much captured on the old Fielding Bible site (archived.fieldingbible.com) and, I think, in the FAQs on the new site (fieldingbible.com). But it’s the books (which came to about a thousand pages for the first four editions, ending in 2015 — I see there’s been one other volume since) that I found so engaging about five years ago. I do not remember the method that Rtot used to project these into the pre-2003 past (at least as far as 1957).
I know this is an unsatisfactory answer, but the fault, nsb, is in me, not in Rtot. I wasn’t born understanding Rtot; I think I achieved some understanding of Rtot; but I would not want to thrust Rtot upon you. On the other hand, it’s fun to learn new perspectives and you may want to think about questioning the loyalty of your doubts and making the attempt to look into advanced fielding stats. After all, nothing can come of doing nothing.
Bob:
Liked the Shakespearean touches.
Speaking of proximate no-hitters, in that same 1917 season, the White Sox and Browns played 3 no-hitters against each other. In the third game of the season, Eddie Cicotte blanked the Brownies in St. Louis. Three weeks later, these teams met again at Sportsman’s Park, and Ernie Koob tamed the bats of the world champions-to-be. The next day was a double-header occasioned by a rainout in the season-opening series. In the second game (deemed the originally scheduled game) Bob Groom again stymied White Sox hitters.
Congrats to Dave Parker and to the family of Dick Allen on their HoF induction.
Now, if only those committees could do right by Bobby Grich, Lou Whitaker and the recently passed Luis Tiant.
Allen’s a given, but—not to disparage the choice of Dave Parker entirely, since it beats any number of vets committee picks of the past—passing over such players as the three you name plus a score of others with merits equal to or better than Parker’s is upsetting.The pick of Jack Morris a few years back at least had the merit of rewarding a guy who racked up a large number of wins and was a noted money pitcher with an iconic World Series performance to his credit.
Parker? His career arc resembles somewhat that of a later contemporary, Don Mattingly, except that Mattingly’s career was stalled and eventually caused to dwindle by chronic back issues, while Dave’s main issue was cocaine. He was able to hang on and had, count them, exactly one season out of his last twelve with more than 1.6 WAR. Mattingly, in contrast, put up four decent seasons after his problem arose but chose not to hang on. As a result, in 7722 PAs, Don produced 42.4 WAR. In spite of Parker’s sometimes gaudy RBI numbers in later years, he finished with 40.1 WAR in 10184 PAs. Who else had 40.1 WAR? Well, several players, but one in particular who will never be considered for the Hall in spite of having an extremely impressive career cut short, Albert Belle: 40.1 WAR in just 6676 PAs.
I think Allen is a fine choice, even though he’s not yet in our more exclusive Circle, but Parker’s selection over Boyer, John, and Tiant is a mystery to me, as is the fact that Grich wasn’t even on the ballot. (I think Whitaker’s case belongs to a different committee.) I assume the committee members know a lot more than I do. Have any of them explained their reasoning? (Does anyone on HHS want to make the case for Parker over the others?)
I don’t want to try to make the case for Parker over others. But, the explanation for the pick isn’t a mystery. The panel as a whole does not appreciate analytics. Most wouldn’t care that Parker has a 40.1 WAR. They just remember “The Cobra,” “We are Family,” the arm, and see that he had gold gloves, a lot of HRs, a lot of RBI, and a .290 batting average.
The voters: Paul Molitor, Eddie Murray, Tony Pérez, Lee Smith and Ozzie Smith, Joe Torre, Sandy Alderson, Terry McGuirk, Dayton Moore, Arte Moreno, Brian Sabean; Bob Elliott, Leslie Heaphy, Steve Hirdt, Dick Kaegel and Larry Lester.
Dayton Moore and Leslie Heaphy are the only ones under 68. And, when Moore was Royal GM, he admitted that he didn’t understand defensive analytics. He said: When you watch baseball games every single day, its very apparent who can play defensively and who can’t.”
Of the 16 members, only Alderson, Sabean and Molitor were known for using analytics in their decision making.
Joe Torre expressed concern over the use of analytics.
Arte Moreno’s track record shows a deep lack of appreciation for analytics. Analytics minded personnel, like Jerry Dipoto quit because their voices are not heard.
Thanks for this clear account, Tom. It sounds as though we haven’t progressed very far from the days of Frankie Frisch’s Veterans Committee.
The only exception I’d take with your comment is the implied view of those who are 68 and older. It’s a club I joined quite a while ago and I’ve found membership entails no barrier to learning the strengths (and limits) of advanced stats. Alderson, Sabean, and Molitor are all fellow club members. Many club members share clear memories of Ken Boyer’s play, and we show our statistical chops with our superior grasp of the economics of Medicare. It is unfortunate that a few continue to be gripped by faith in The Intangibles, but that may change, since new members are being admitted at an accelerating rate and we have an iron-clad term-limit policy.
No offence intended. I’m getting there myself.
None taken. Just a little senior humor.
Parker’s HoF case would be based mostly on peak value. That peak was good enough (apparently) to at least place him among outer circle HoF brethren, as evidenced by Bill James’ Hall metrics that suggest that he is definitely in the equation:
Black ink: Batting – 26 (90th), Average HOFer ≈ 27
Gray ink: Batting – 145 (125th), Average HOFer ≈ 144
Hall of Fame Monitor: Batting – 125 (122nd), Likely HOFer ≈ 100 (higher score here in part due to playing on two World Series winners)
Hall of Fame Standards: Batting – 42 (146th), Average HOFer ≈ 50
Hall of Stats has Parker at 78, well below Hall level. His defense (he won three gold gloves in his prime) and baserunning are only slightly negative for his career. However, half of Parker’s batting WAR is clawed back by positional adjustment. That clawback provides some explanation as to why Parker’s rankings in James’s Hall metrics seem higher than one might expect based on WAR.
All that said, JAWS has Parker ranked only 42nd among right-fielders. That is probably the most telling stat in making the case that there are certainly better Hall choices than Parker.
Thanks for compiling the case, Doug. If I recall, the HoF metrics concern who is likely to be voted in, not who deserves it. (I mean, the Black Ink test rates Pete Runnels over Boyer — it’s not a serious stat.) The exception is JAWS, which is meant to be an independent standard.
The question, though, was how to justify Parker over the rejected candidates (not even considering his contemporary, Grich, whose WAR exceeds Parker by 75% — and whose WAR rate exceeds by 100+%).
The explanation of peak value must involve a very short peak indeed. Compared to the only other candidate assessed by bWAR (Boyer), Parker’s JAWS 7-year peak WAR of 37.4 trails Boyer’s 46.2, which is 15% above Parker’s total WAR.
It’s hard to imagine that people with deeper baseball knowledge than we would be ignorant of all this, so I think the reasons must lie elsewhere. (I have no idea where — I can’t see Parker’s case as competitive with any of the other MLB players on the ballot. I have no skills in assessing the Negro League stars who were passed over.) This especially true because Parker got more votes even than Allen (14 to 13), double the number for Tommy John, who had almost 300 wins and surgical immortality. (Boyer got fewer than 5.) There’s got to be something we don’t know, doesn’t there?
You’re right about James’s HoF metrics. He invented them for fun more than anything else and were just about who is likely to be elected to the Hall, not who deserves to be. Even the HoF Standards just compares season and career totals to those of HoFers, without regard to context. And, of course, with these metrics coming from the 1980s, no modern analytics were involved.
Somewhat bizarre (and metaphysical?) that Allen dies 12/7/2020 and one of his closest friends and supporters in Chicago, Bill Melton, dies on 12/7/2024. Melton argued for Allen in the Hall of Fame for years and, sure enough, a day after Melton passes, Allen is elected.
Thanks for the shout out on Melton, the 1971 AL HR champ and the first White Sox player with consecutive 30+ HR seasons (actually, the first White Sox player with any 30+ HR seasons). In the off-season after the 1971 season, Melton fell off his roof (after sneezing) and broke his tailbone. When he came back, he still felt sore and changed his swing (without realizing it) to avoid further pain; he never approached the 30 HR plateau again. Melton’s 154 HR for the White Sox was the franchise record until Carlton Fisk passed him in 1988.
Imagine any player today repairing his own roof to save a few bucks, much less the league leader in HRs. The MINIMUM MLB salary in 2024 was $740,000.
That minimum salary would qualify a young lad for a monthly mortgage payment of approximately $24,000/month. ($740,000/12 months x .40) Gotta believe any roofer would be glad to do the work on that home
….and, nowadays, he’d be on the DL from March till July
When I heard of Ricky Henderson’s demise, it suddenly struck me that this has been a pretty bad year for baseball, the worst since the pandemic year, in terms of retired player deaths.
With a few days to go, here’s the 2024 roll call of recently deceased players with ten seasons to their credit and career WAR above 10.0, each deceased player’s name followed by the WAR number.
*Indicates HOF.
# Indicates Circle of Greats member.
Willie Mays 156.2*#
Rickey Henderson 111.1*#
Pete Rose 79.5#
Luis Tiant 66.1
Orlando Cepeda 50.1*
Rocky Colavito 44.9
Fernando Valenzuela 41.5
Rico Carty 32.7
Ken Holtzman 27.3
Rudy May 20.4
Bud Harrelson 20.3
Merv Rettenmund 20.0
Bill Melton 18.7
Don Gullett 18.2 (9 years)
Jerry Grote 15.0
Jose DeLeon 15.0
Joey Jay 14.0
Carl Erskine 13.9
Mays, Henderson, Rose, Tiant, Cepeda, Colavito, Valenzuela—possibly even Carty and Holtzman—are names with associations that resonate still, but how many people now remember that, for instance, Joey Jay was the first Little League player to make it to the bigs?
New Yorkers probably recognize Harrelson and Grote as mainstay teammates on those unlikely Mets of 1969 and 1973, but does anyone else?
Carl Erskine? Six years a winner in double figures for the Dodgers dynasty of the late 1940s through the late 1950s. Now possibly forgotten is his 14-strikeout outing against the Yankees in the 1953 Series, coming at a time when high pitching Ks were anomalies.
Melton has been eulogized here earlier.
Gullett was to the Big Red Machine what Erskine was to the Boys of Summer.
Rettenmund’s two best seasons came for the Orioles pennant winners of 1970-71.
————-
But, speaking of the pandemic year, is it too late to mourn a little over that year’s losses of notable players? The 2020 list is daunting, and I don’t remember too much being said at the time, due to such distractions as Covid-19 and all that that crisis entailed, plus a little matter of insurrection on January 6, 2021.
In any event, here is that year’s list with the same additions following the names:
Tom Seaver 109.9*#
Joe Morgan 100.6*#
Phil Niekro 95.9*#
Al Kaline 92.8*#
Bob Gibson 89.2*#
Dick Allen 58.7*
Whitey Ford 57.1*#
Jim Wynn 55.8
Lou Brock 45.3*
Tony Fernandez 45.3
Johnny Antonelli 31.9
Lindy McDaniel 28.2
Denis Menke 28.0
Don Larsen 18.8
Ron Perranoski 18.2
Frank Bolling 16.9
Jay Johnstone 16.7
Glenn Beckert 15.6
Eight Hall of Famers. Six Circles of Greats members.
Plus Jim Wynn, who in their seven seasons as Houston teammates, led Joe Morgan in WAR five times, plus leading the 1974 Dodger pennant winners in same.
Tony Fernandez.
Johnny Antonelli, as much the reason for the Giants’ 1954 success as Willie.
Lindy McDaniel. Twenty-one years, mostly as a premier reliever, mostly on indifferent teams.
Menke, a valuable teammate of Wynn and Morgan on those early Astros teams.
Don Larsen? A fact I found by accident: he was almost a year younger than Whitey Ford, despite his weathered face and Whitey’s youthful grin.
Perranoski—another premier reliever, only with better luck than McDaniel.
>> Sorry if this double-posts. I posted it earlier, tried to edit, and it disappeared. <<
When I looked at HHS yesterday I noticed that there had been no posts in over a week so I decided to write up a small item on a topic related to this year’s HoF vote. Coming back to post that I see nsb’s thoughtful obituary survey and it feels a little odd to chime in on a different note. I have some thoughts on nsb’s melancholy comment that I may add later, but right now I just want to acknowledge nsb’s lists and the players they recall so that my topic shift doesn’t seem to make light of their passing.
What caught my eye for a post was the high level of HoF support for CC Sabathia that has become evident through Ryan Thibodaux’s Hall of Fame Tracker. The tracker shows well over 90% support for Sabathia’s first-year candidacy with 15% of the votes accounted for. I wouldn’t really have been much surprised except that I happened upon some B-R page listing that included Tim Hudson and, in following up, saw this quote from Jay Jaffee: “He’s not Hall of Fame material, but there’s no shame in that.” Maybe. But when I look at Hudson’s record I don’t see a huge gap between him and Sabathia. Sabathia was a strikeout pitcher while Hudson was not, but look at these numbers:
……………………….Hudson………….Sabathia
IP…………………….3127……………..3577
W……………………..222……………….251
L………………………133……………….161
Pct………………….. .625…………….. .609
ERA………………….3.49………………3.74
ERA+………………..120……………….116
WAR…………………56.6………………61.8
WAR/162……………4.0………………..3.7
WAR 5yr Peak……27.1………………30.4
K…………………….2080……………..3093
K/9……………………..6.0………………..7.8
K/BB………………….2.27………………2.81
FIP…………………….3.78………………3.78
WHIP………………..1.239……………1.259
H/9……………………..8.5………………..8.6
HR/9…………………..0.7………………..1.0
(I suppose I could have made my argument simply with the three WAR figures, but out of respect for nsb . . .)
Hudson spent two years on the HoF ballot, drawing support from 5.2% of voters in his debut and 3.0% in his sophomore year. Like many sophomores with poor grades he was thereupon expelled, Jaffee’s judgment proving nearly universal within the BBWAA.
I can understand why a HoF voter might see Sabathia’s record as superior, though to my eye the two players are strongly comparable, key trade-offs being things like Sabathia’s superior K/9 and Hudson’s superior HR/9, Sabathia’s somewhat greater career length and Hudson’s somewhat higher WAR rate. I’d give the edge to Sabathia too, but mostly the two are just very similar (identical FIP, near-identical ERA+ and WHIP, etc.). What’s hard to understand is how even taking the position that Sabathia has the edge could take you to both the Jaffee/BBWAA position that Hudson’s a no-question non-Hall pitcher Jaffee voted for Joe Nathan over Hudson in 2022) and what seems to be the emerging BBWAA position that Sabathia’s a no-brainer first ballot selection.
PS: Since first posting this I’ve realized that the case of Mark Buehrle is a bit similar.
Bob:
Here’s a pitcher whose stats even more closely match those of Sabathia:
IP——-3316.0
W——-256
L——–153
Pct——.626
ERa—-3.85
ERA+–117
WAR—60.7
K——–2448
K/9—–6.6
K/BB—2.37
FIP—–3.74
WHIP–1.351
H/9—–9.4
HR/9—0.8
Here are what to me are more relevant stats comparing the three hurlers
Sabathia first, Hudson second, mystery pitcher third:
PR——-226——254——223
PW——23.5—–25.8—–22.4
RE24—253.98 284.01—257.94
WPA—-22.8—–29.8—–24.2
WPA/LI–22.7—-30.1—–24.8
REW—-26.3—–29.4—–26.0
Hudson far outshines Sabathia in these (to me underrated) categories as well, making your case for skepticism even more powerful.
The third pitcher I’ve brought into the mix, who is, incidentally, the closest match to Sabathia in B-Ref’s similarity scores, is Andy Pettitte. Pettitte has more WAR per innings pitched ( .0183 vs .0172), a slightly better ERA+ and, again allowing for the fewer innings pitched, he makes a better showing in my six additions, except for PW.
On balance, leaving Hudson out of it, I’d say Pettitte is as Hall worthy as Sabathia, especially when you consider his postseasons, and he currently is holding steady in the voting at around 13%.
Hudson, of course, needs serious reconsideration. I’m not sure that being better than Sabathia makes him an automatic winner, but I’d prefer him to many.
Conclusion: It’s not just the veterans committees that make nonsensical decisions.
nsb, I have to confess that I’m no longer conversant with RE24 and, even worse, don’t even know what PR and PW represent (unless PR means Pinch Runner!).
I’d expect nothing less from your detective skills than finding the additional Pettitt parallel! I think there is an explanation in Pettitt’s case that doesn’t apply to Hudson: PEDs. We’ve seen what an impact that had on high-profile cases like Bonds and Clemens, and I think Pettitt is caught in that. You can agree or disagree with that bar, but unlike Hudson it at least explains the outcome. I feel pretty confident Pettitt would be in the Hall otherwise.
My own position on Pettitt is hesitant. As I recall the evidence, Pettitt confessed to a single course of PEDs in trying to return from an injury. I don’t recall whether he said they were effective. This seems to me different from cases of routinized PED use that had lasting effects on performance and wound up utterly skewing MLB season and lifetime leaderboards and awards, as seems to have been true in high-profile cases. Cheating is bad, but subject to assessments of context, degree, and contrition. For those who achieved “immortality” by distorting key measures in baseball’s statistical history I think their unasterisked leaderboard outcomes are sufficient reward for cheating, without adding gratuitous honors like Hall membership, whether they would surely have achieved them without PEDs (e.g., Bonds and Clemens) or more likely not (e.g. McGuire, Sosa, or Brown). So while I think we can understand Pettitt’s exclusion and may feel it’s justified, I suspect that if I had a ballot I’d probably include Pettitt.
Pitching Runs
Pitching Wins
Base Out Runs Added(RE24)
Win Probability Added
Situational Wins Saved(WPA/LI)
Base out Wins Saved(REW)
These are measures of pitching effectiveness in game situations.
Thanks, nsb. Where do you find the stats on PR, PW, and REW? I may have missed them on B-R and FanGraphs, but maybe they’re on StatHead, which is not in my investment portfolio.
They’re on B-R. Go to Appearances on Leaderboard for each individual pitcher and, if the pitcher is pretty good, they’ll be there. Or go to the All Time Leaderboards, enter Career Totals, and scroll way to the bottom of the pitching section and there they are in a row, with Championship WPA mixed in. Adjusted Pitching Runs and Adjusted Pitching Wins are the first two headings, actually. I was going from memory.
There they are! Thank you. I’ll start exploring them.
Looking over these stats, nsb, it seems to me that while the RE and WPA stats are game situation stats, PR/PW are not. I appreciate the value of the RE/WPA calculations. I don’t think they are included in pWAR formulas. On the other hand, pWAR formulas take account of the quality of defense which, if I understand the other stats, is not included in what they assess. (You already know of my biblical worship of that factor.)
I used to be conversant with RE/WPA stats and a quick review has brought their general basis and function back to mind. In the years I’ve let the high heat cool in my soul I presume guys like Thorn, James, and Tango, and the whole SABR crew have continued their work, and I wonder whether any of them have integrated the game-context/leverage elements with defensive quality (along with usual suspects, like park effects). I know LI is a factor for relief pitchers, but I don’t think it applies to starters.
My understanding is that the leverage indices are applied only to mid-inning relievers in pWAR simply because a pitcher who starts an inning is responsible for the jams he creates, while relievers are not responsible for the jams they walk into (nor batters for the RE24 situations presented as opportunities).
“………. Pettitt confessed to a single course of PEDs in trying to return from an injury.”
Bob,
I don’t think the BBWAA believes him
Nothing much to do about that — they may be right. (And I checked and found that Pettitt confessed to two PED episodes, not one, both connected to getting off the DL.)
We’ll know the Hall of Fame vote in a couple of days, which will end one of the periods I enjoy each year: following Ryan Thibodeaux’s Hall of Fame Tracker to see how candidates are doing. As of this morning (1/19, Robert E. Lee’s birthday), the Tracker has revealed about 44% of the total ballots, so it’s giving a pretty clear picture of what the outcome will be. Final outcomes differ from Tracker final percentages, of course, but usually not by much (they are usually a few points lower, rather than higher, but not always).
One of the things that always interests me is the list of candidates who receive zero votes. Some are obvious (would anyone ever consider Fernando Rodney a HoF great, with his 7.4 WAR over seventeen seasons?), but I did a calculation this morning that surprised me. I looked at the vote shares of position players on the ballot according to their WAR/162 productivity. It’s a JAWS category and one that I’d tend to pay a lot of attention to (not to the exclusion of other key factors! [that’s for nsb]), but it seems to have virtually no impact on voters. Here are the WAR/162 leaders and their current vote percentages (the list would continue down at 4.6/162 so I made the cut at 4.9):
ARod ………….. 6.8 / 40.1%
Tulowitzki …….. 5.6 / 0%
Pedroia ………… 5.6 / 14.0%
Utley …………… 5.4 / 54.6%
Wright …………. 5.0 / 11.6%
Manny …………. 4.9 / 36.0%
ARod and Manny’s vote figures are distorted by steroid issues. The obvious outlier here is Tulowitzki. His lower vote share is partly explained by his shorter career: 44.5 WAR total, the lowest in this group (though not too far behind Wright’s 49.2). There are a number of other candidates with total WAR similar to or even below Tulowitzki who are getting votes: Vizquel, for example, at 45.6 is getting a 12.2% share of votes—he once rose as high as 52.7% before stories about his personal conduct put on the brakes. Jimmy Rollins is now at 20.3% with 47.6 WAR and a rate of 3.4/162.
I wouldn’t argue for a moment that Tulowitzki deserves to be in the Hall. I don’t think he’s a reasonable candidate (but I’m a small Hall guy). But it seems noteworthy that not a single one of the 172 ballots known so far includes his name, despite the fact that he was a fine defensive shortstop with a 118 OPS+ (which discounts the Coors Field effect). The 5.6/162 figure is very high (2/3 higher than Rollins, who actually is on a trajectory that could get him in the Hall)—Ichiro’s figure is 3.7/162 and not a single voter has said that he is not Hallworthy. (Of course, we know why that is; it’s the right call.) Brian McCann has only 3.0 WAR/162 and 32.0 total, but he has 6 votes (3.5%): he and Russell Martin are both obviously getting the catcher’s break among a subset of voters.
For me, Tulowitzki’s Zilch is so far the biggest anomaly of the vote. (I think Ian Kinsler’s 2.3% share despite 54.1 WAR at a 4.6/162 rate as a second baseman is probably next on that list.)
Tulowitzki was certainly a Hall of Fame talent who just didn’t have a Hall of Fame career…. “brittle” might be an understatement. Re Kinsler, I think a large majority of the BBWAA pay zero heed to the “WAR” metric and just do the eye test and then review the career “accumulation/compilation” stats. Jimmy Rollins was a guy who was NEVER over-matched. Despite batting at the top of the order, he never really took a walk. He put the ball in play and, unfortunately, a lot of those were 300-foot flyball outs.If someone could check “Stathead”, he might have the most 500-out seasons of all-time?
Most 500-out seasons is 7 by Juan Pierre. Following him are Jimmy Rollins with 6 such seasons and Cal Ripken with 5 such seasons. Altogether there have been 139 seasons in which a player accounted for 500 outs and Tulowitzki does not have any of them. The most he had was 459 outs. Most outs in a season is Omar Moreno with 560, followed by Frank Taveras with 545 and Horace Clarke with 542.
Richard,
Thank you for the info.
I was a Tulo fan but his injuries just kept mounting and a Hall of Fame talent was never going to be a Hall of Famer 🙁
With the Hall announcement imminent I just logged on thinking it might have happened–still an hour to go at the time–and I spotted an article on Ichiro on the ESPN site. It includes interviews snippets with MLB contemporaries’ reminiscences and this one by Mike Sweeny was so much fun that I decided I should share it here.
“He leads off the game with a line drive to left-center field for a base hit and he gets over to first base, and all I could think about was when I was in Japan playing against the Japanese all-stars, anytime that an American would get a base hit up on the jumbotron would be this big huge graphic, almost kind of like a 1950s/1960s graphic from Batman and Robin. Like ‘Pow!’ or ‘Boom!’ And it would say, ‘Nice batting.’ And so over the loudspeaker, you’d hear the PA announcer say, ‘Nice batting.’ And you’d see these big graphics up on the jumbotron.
“So being a kid from Southern California that doesn’t speak any Japanese, I don’t know what to say to Ichiro. I don’t even know if he knows English. He had just gotten here in spring training. So I look over at him and I pat him on the back and say, ‘Ichiro, nice batting.’ And I don’t know what kind of response I’m going to get. And he looks at me — never met him before — and he goes, ‘Mike Sweeney, nice ass.’ I just started dying laughing. I’m like, oh my gosh, his English was perfect. No accent. And I’m going, oh my gosh, this guy, he’s going to be great.”
Looking for some interesting statistical anomaly to toss in now that the vote has been announced . . .
Here’s one: I was sure Torii Hunter was going off the ballot. He received only 5 votes among the 216 revealed before today’s announcement (2.3%). He needed to get at least 15 of the remaining 178 (8.4%) to survive, almost triple his rate among the revealed ballots. Very unlikely. But that’s precisely the number he got. He will be on the 2026 ballot.