
Michael Hoban closes out his series on the CAWS Career Gauge with this last installment identifying the players, both those who achieved Hall-worthy career performance as measured by CAWS and those who did not. More after the jump.
There are one hundred four (104) position players and forty-eight (48) pitchers in the live ball era (since 1920) who have Hall of Fame numbers according to the CAWS Career Gauge. Here is the distribution by position.
- First Base – 16
- Second Base – 14
- Third Base – 10
- Shortstop – 13
- Left Field – 14
- Center Field – 11
- Right Field – 12
- Catcher – 12
- Designated Hitter – 2
- Pitcher – 48
The rest of this post identifies those players who achieved, or came close to achieving, Hall of Fame-worthy careers as measured by the CAWS Career Gauge. For an introduction to CAWS, please see Part 1. For an explanation of Hall of Fame standards as measured by CAWS, please see Part 2.
The following lists will show the career totals for those players who had HOF numbers at each position. All numbers include the 2018 season, and will show:
- Bold print = Hall of Famer
- Italic = active player in 2019
- Career Win Shares from Bill James’ Win Shares formulae
- Core Value = sum of Win Shares for 10 best seasons
- CAWS = Core Value + .25 x (Career Win Shares – Core Value)
- CAWS+ = normalized CAWS where 100 = CAWS positional HOF-qualifying standard
Right Field (CAWS = 280)
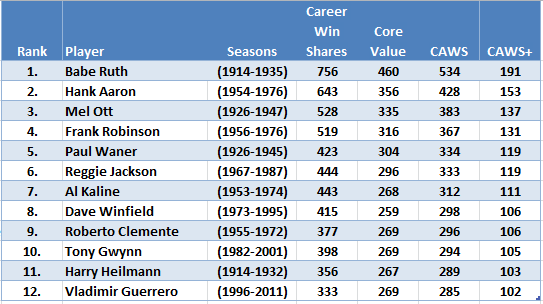
Note that all of these players have been elected to the Hall of Fame.
Left Field (CAWS = 280)
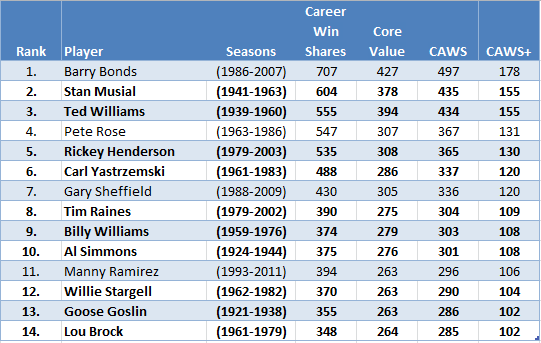
Note that of the players not elected to the Hall of Fame, one (Rose) is ineligible (banned) and the three others have been suspected of PED usage.
Center Field (CAWS = 270)
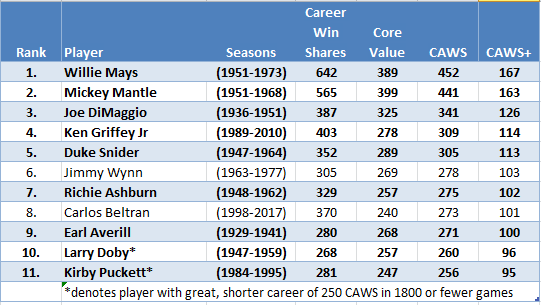
Of the two players not elected to the Hall of Fame, one (Beltran) is not yet eligible.
First Base (CAWS = 280)
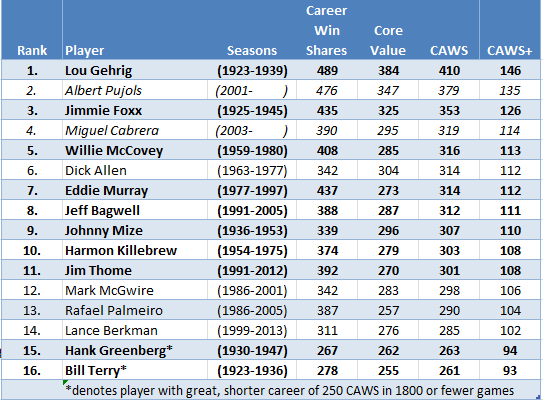
Two of the players not elected to the Hall of Fame are still active, one (McGwire) has admitted PED use, and a fourth (Palmeiro) is suspected of PED use.
Second Base (CAWS = 260)
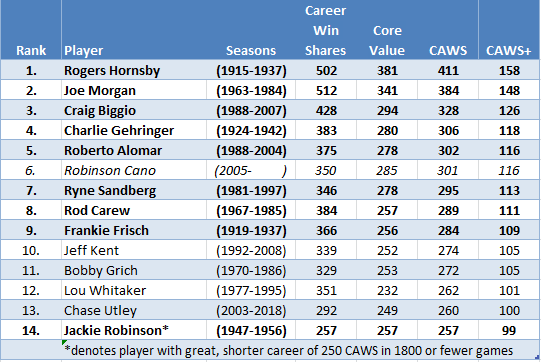
Of the players not elected to the Hall of Fame, one is not yet eligible (Utley), and one is active but has been suspended for PED usage.
Third Base (CAWS = 270)
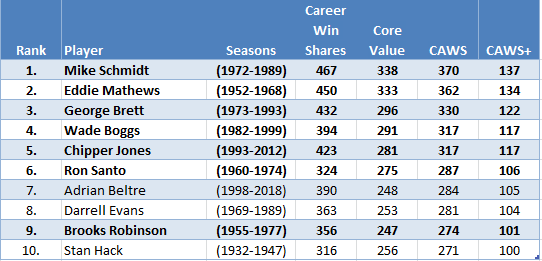
One of the players not elected to the Hall of Fame is not yet eligible (Beltre). Two other third basemen compiled HOF-qualifying great, shorter careers of 250 CAWS in a career of 1800 or fewer games: Heinie Groh (272 career Win Shares/243 core value/250 CAWS); and David Wright (267/247/252).
Shortstop (CAWS = 250)
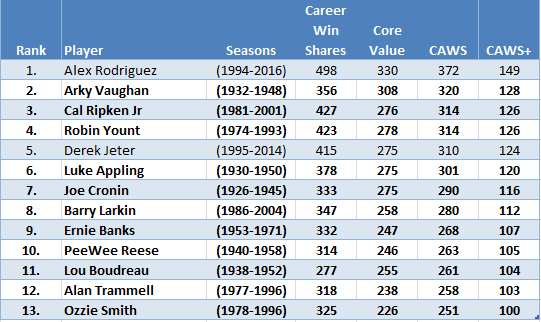
Both of the players not elected to the Hall of Fame are not yet eligible, though one (Rodriguez) has been suspended for PED usage.
Catcher (CAWS = 250)
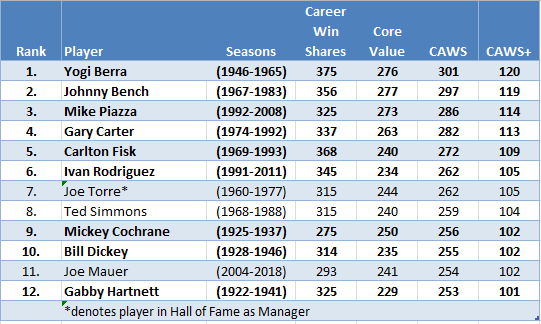
One of the players not elected to the Hall of Fame is not yet eligible (Mauer).
Designated Hitter (CAWS = 280)
Both of these players are in the Hall of Fame with solid credentials.
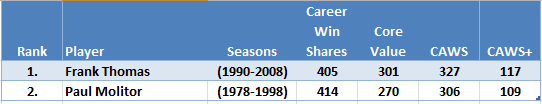
Pitcher (CAWS = 220)
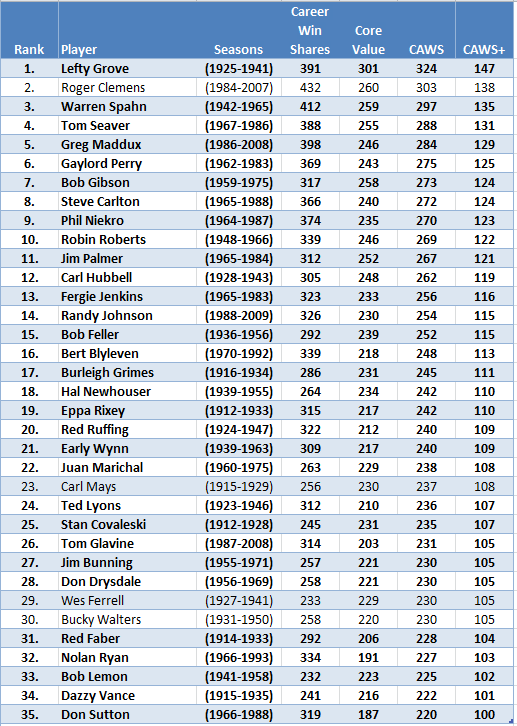
Only four of these players are not the Hall, one of whom (Clemens) is suspected of PED usage.
In addition to the players above, the following pitchers have Hall of Fame numbers according to the CAWS Career Guage, despite not reaching 220 CAWS.
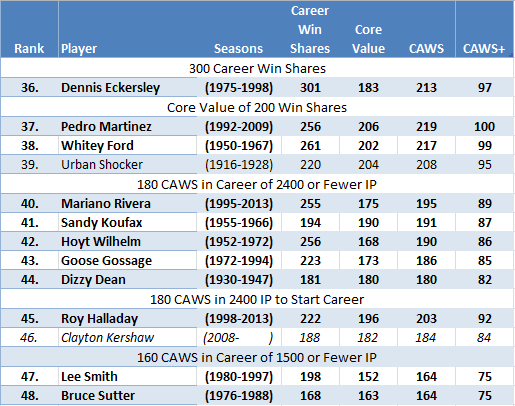
Only one retired and and one active player are not in the Hall among this supplementary list of CAWS-qualifying pitchers.
The Very Good
With any ranking system, there will be very good players who fall just short of the mark. Here are some of those players, by position.
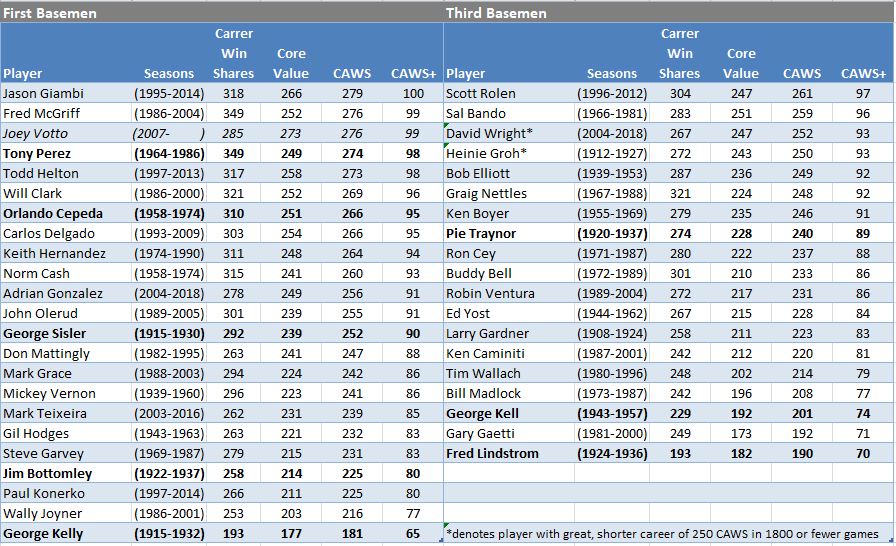
Only a handful of corner infielders not qualified by CAWS are Hall of Fame selections. Note that Joey Votto has, this season (2019), reached Hall of Fame qualifying levels for CAWS.
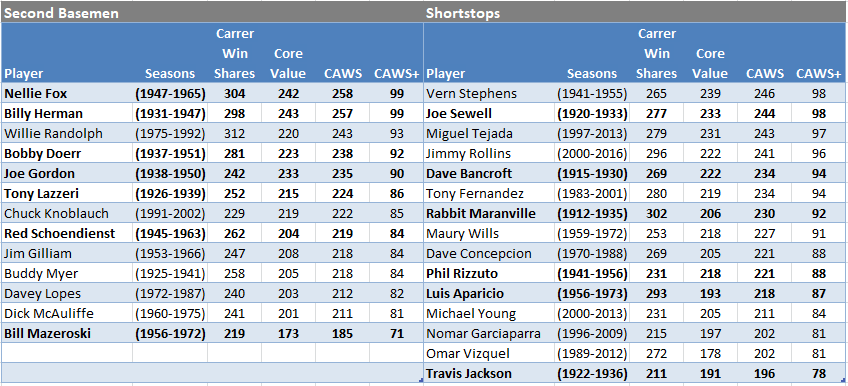
In contrast to the corner infielders, there is a larger proportion of middle infielders not qualified by CAWS who have been honored with Hall enshrinement. Most of them, though, are “in the conversation” with CAWS+ scores of 90 or more.
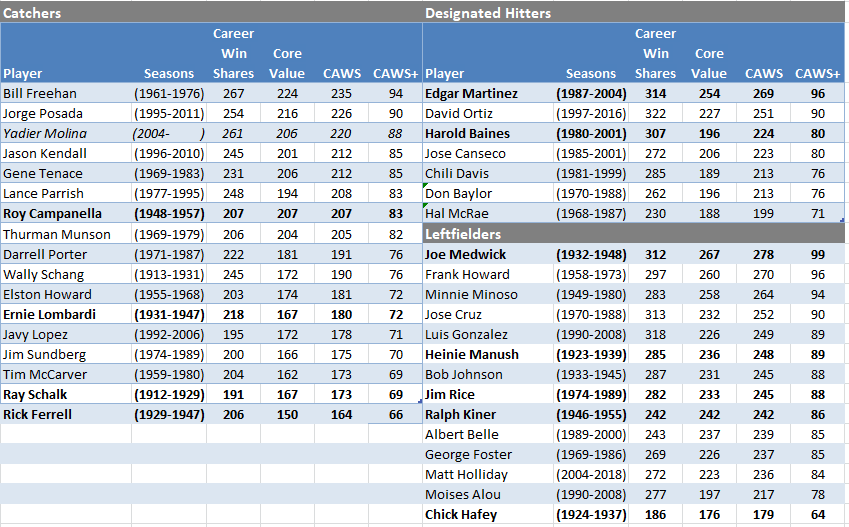
A couple of almost qualifiers (Martinez and Medwick) are among the non-qualifying HOFers for these positions. But there are several quite dubious Hall picks among the rest, with some allowance given for Roy Campanella‘s unique circumstances. Yadier Molina will likely pass Posada, and possibly Freehan, but most likely will not reach the 250 HOF qualifier.
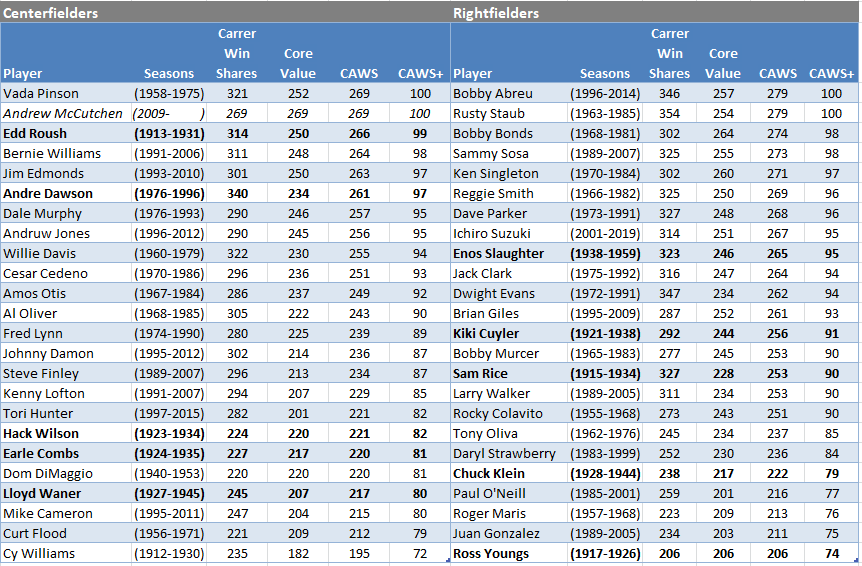
A sizable number of players here at the more demanding of the outfield positions, with a smattering of non-qualifying HOFers, half with CAWS+ of 90 or more, but the other half below that mark. Note that Andrew McCutchen has, this season (2019), reached Hall of Fame qualifying levels for CAWS.
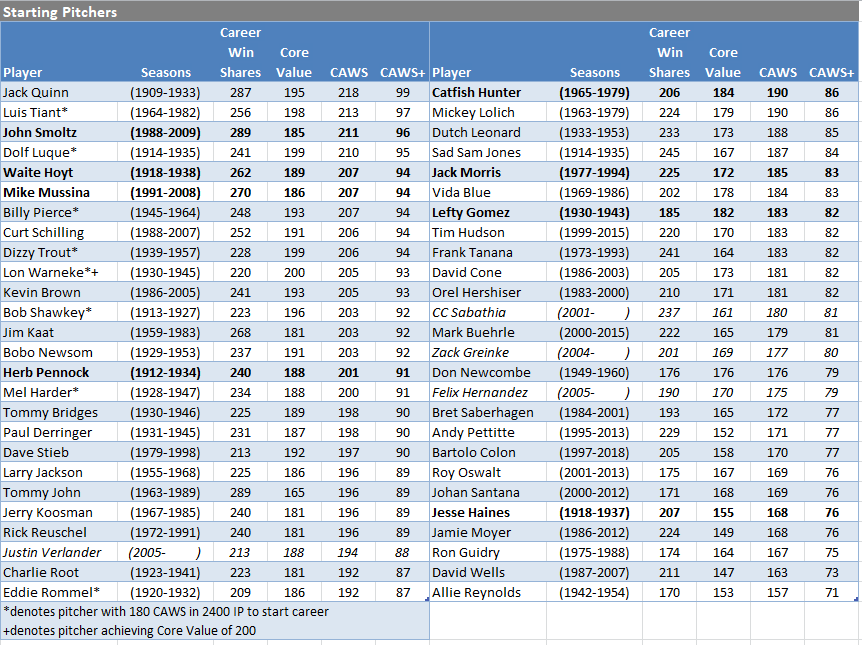
Similar story with starting pitchers, with only a couple of handfuls of Hall inductees among the non-qualifiers, half with better CAWS+ (on the left) and lesser lights on the right. Note the active pitchers on this list, one (Verlander) seemingly with a good chance of reaching 220 CAWS, the others much less likely. Note also the asterisked players, who achieved the CAWS qualification which admitted Roy Halladay (including Lon Warneke who also achieved the 200 Core Value qualification), but whom Michael has elected not to include among those pitchers with HOF-caliber credentials.
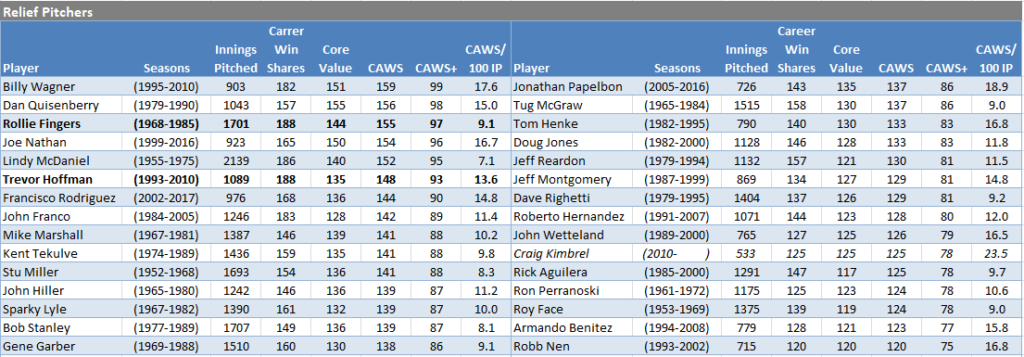
Finally, the relief pitchers with, perhaps surprisingly, only one active pitcher making the list. But, that pitcher (Kimbrel) easily outclasses all of the others in the CAWS per 100 IP metric.
For those who may be interested, I’ve prepared a spreadsheet of Career CAWS scores for all of the players in the Baseball Gauge database. The data presented are based on Win Shares as calculated by Baseball Gauge, which may not always match the Win Shares as shown on Bill James’ website. There are two calculations for Career Win Shares (CWS), Core Value (CV) and CAWS, one with no rounding of seasonal Win Shares totals, and one with rounding of each season’s Win Shares to a whole number. You can also download seasonal data for each player from this link.
Doug,
Nice job. I do not know how I completely missed Lon Warneke.
Mike.
Wasn’t meaning to show you up with the apparent, additional CAWS qualifiers, but thought it needed to be acknowledged since this had come up in the discussion of Part 2. Hope you weren’t offended.
The surprising Win Shares for Warneke and Trout (and Newsom, Harder, Bridges and Derringer) has me wondering whether the talent disparity between the best and worst wartime players may have resulted in overly generous WS allocations for those better players. But, would have to study this further to say more than that.
As to the Halladay qualifier of 180/2400 to start a career, was playing around with instead using 200 CAWS for careers of less than 3000 IP. That brings in Halladay, Warneke, Trout, Shawkey and Pennock, but not Tiant, Pierce, Luque, Harder and Rommel, who qualify with 180/2400. I’m partial to Tiant, so would like to see him in, Pierce is close but probably on the outside, but I don’t think too many would lobby hard for the last three. Just a thought.
It’s great to see Mike’s specific lists presented here, and I think the CAWS+ feature makes the figures very simple to understand – it could be used for a unified list as well, since the positional distinctions are all accounted for in that metric, like the Hall of Stats list rather than the JAWS lists.
I’d like to talk a little bit about ways we might conceptualize what a truly ideal Hall monitor would look like, and what realistic features we might actually be able to implement if we were, somehow, to design such a monitor for practical use. I don’t mean changes I’d suggest for CAWS specifically; I’m thinking of the underlying issues that may make all current systems (James’s Hall Monitor, JAWS, Hall of Stats, CAWS, James’s new HoF Value Standard, etc.) seem a little problematic.
Here is a short list of some issues I’m thinking of:
1. What is the ideal formula for the “longevity vs. quality” equation? When, if ever, can longevity degrade career quality measures?
2. What is the ideal way to calibrate career “peak?” JAWS uses 7 non-contiguous seasons, CAWS 10. There is a certain arbitrary nature to the choices (why not 8 or 9?), and the distinction between peak and non-peak is absolute, even though it actually differs greatly among players (some have truly long peaks, beyond 10 years; some have spectacular short peaks or play no seasons beyond the initial 10, meaning their worst seasons are part of their “peak”). Is there some way to bring nuance to the peak so the concept has good adaptive fit to different types of players, while producing results according to a uniform theory?
3. Can we quantify within theoretically justifiable formulas such things as the “catcher bonus” (HoS does do this), milestone achievements (e.g., 3000 hits; MVPs or MVP shares), the changing impact of segregation in the periods before and immediately after 1947, etc.?
4. Can we identify changes in the game that have significantly altered the way WS or WAR calculations award value credit? For instance, the HoS employs a discount on pitcher WAA/WAR prior to 1893, because the earlier role of the pitcher led to statistics fundamentally skewed to contemporary expectations of those metrics.
5. How much of a system should be “outsourced” to the choice of a base metric (WS, WSAB, bWAR, fWAR, WARP, etc.); which is the best metric to use, and what elements does each metric leave for a Hall monitor to supply (e.g., WS leaves positional adjustments while WAR does not). (Ideally, I suppose, it would be best to design a base system better than WS/WAR, but practically speaking that’s not going to happen, and in the case of WAR, that’s what people like Sean Foreman with bWAR are constantly doing anyway as they revise their systems.)
6. How many discontinuous or arbitrary cutoff points can be replaced by graded scales that are reasonably practical to implement? Point #2 above relates to this, but I think there are many points at which systems set cutoff points that have nothing to do with the reality of the smooth curves that stats represent. The only truly justifiable cutoff toggle I can think of is that we assess player value in quanta of “seasons.”
7. How far are we justified in designing a Hall monitor by working back from an intuitive sense of who belongs in the Hall. Obviously, if we design a “perfect” monitor and Babe Ruth doesn’t make the cut, we know that the monitor’s a dud. We have to use intuition to some degree to check the plausibility of any model, but to what degree? If we find Whitey Ford on the outside, is that our error, does the error lie in the base metric we chose, do we have to leave Ford out of our Hall, do we make arguments based on qualitative matters that override the figures on our list, or do we create a borderline-territory section on our monitor, that leaves it to others to make those arguments?
These thoughts were initially prompted by #1 and #2, which we’ve discussed here a number of times. When I started making my own stat lines for CoG debates, I used career rate stats (e.g., pWAR/162IP) and a five-year contiguous peak as elements. These reflected my own ideas about how quality could be measured in career terms (and underlying the answers to all the issues above are, in fact, our individual ideas of how Hall quality is expressed and measured). I abandoned the contiguity of the “peak,” then the five-year time period, and discovered a lot of pushback on using WAR rate stats, and all this taught me how disparate the ideas of career value and Hallworthiness were within the HHS community. I think it would be very interesting, in the context of thinking through the question of how an ideal Hall monitor should be constructed, to discuss those issues in a more focused way.
I looked at this again and I see I wrote: “Here is a short list of some issues I’m thinking of.” Instead I wrote the long list. I should learn that while my intentions may seem strong, brevity is pretty much beyond me.
I feel like Dr. Doom and I had pretty similar takes on this and the systems we were proposing did not have arbitrary “peak” definitions. We had some differences about consecutive vs non-consecutive season performance but I felt like that approach accomplished a lot of what Mike, the HOS, JAWS, and similar are trying to point out without being quite so arbitrary. Another thing we both embraced was using WAA+ when talking about the hall of fame. Although durability and longevity at a near-league average pace are somewhat discounted by this approach, it better balances out the excellence from the mundane. Also, I personally cannot stand to see so many players penalized for wanting to hold on to baseball as long as possible. A replacement level 40-year old future hall of famer struggling to hold onto a roster spot should in no way diminish his previous accomplishments. That drive that was so necessary to eclipse the field during their prime does not magically go away as their bodies age.
I can dig up some code if there’s interest, and I’d welcome a thread of discussion on it (though somebody else is going to have to run through several hundred relevant players to tabulate), but to summarize the basic principle it’s a yearly WAA+ number.
Doom’s take was more like:
The player’s best WAA+ season + (The player’s two best WAA+ seasons divided by two) + (The player’s three best WAA+ seasons divided by three) + … until you get to the longest relevant timeframe. I think the longest career timeframe between positive WAA+ seasons is Willie Mays who was a historically relevant player in 1951 and 1972 so the number of years to average is 22.
My version was similar but imposed a consecutive requirement on the seasons involved, say the two best consecutive WAA+ seasons, not just the two career best. For some players this made absolutely no difference, which is interesting in itself, but does tend to lower the stat a bit.
Interesting players to debate in this system are Koufax and Murray. Koufax puts up such a high peak he can eclipse many pitchers with substantially more WAR. Similarly Murray is hammered for consistently being slow at a poor defensive position and his sheer length of dominance with the stick is never quite reflected compared to stars with a more bell curve shape to their brilliance.
For anyone interested, I have updated the end of the post to provide a link to a spreadsheet containing career CAWS totals for every major league player.
Wow! Terrific tool, Doug. Was this an ongoing project or did you make it appear out of nowhere? If so, can you share the magic formula?
I just downloaded the Win Shares data from Baseball Gauge, did some major spreadsheet manipulation, and voila.
If you want to play around with the individual season data, it’s here.
Good magic even after the trick’s revealed!
Doug,
Very impressive. Thanks.
I just posted this for Voomo on the Part 2 string. Since we’ve moved on to Part 3 I’ll repeat it here; it’s the link to Mike’s book, Defining Greatness.
https://www.amazon.com/DEFINING-GREATNESS-Hall-Fame-Handbook/dp/1621412369.
For those who may have downloaded the CAWS spreadsheet that I prepared, I would ask that you do so again, as I have corrected a small error in my original calculation. The links can be found at the end of the post narrative.
Argh!
Fix one bug, and create another.
Hold off on downloading the spreadsheet. Still fixing things.
I’ve updated the corrected files. You can download them now, if you’d like to.
Thanks, Doug. I spot checked and the problems I saw before (after you flagged the issue) are gone, so I’m not the proud possessor of this extremely useful database.
not = now
I thought it might be a good exercise to observe the difference between a WS-based system like CAWS and a bWAR-based equivalent. So using a WAR formula precisely parallel to CAWS that I’m calling “CWAR”, I’ve prepared the rankings of Second Basemen below, using CAWS+ as an index. “CWAR” is produced by the formula: Best10 + (.25*(bWAR-Best10)), and I’ve created a “CWAR+” proxy for CAWS+ by setting Lou Whitaker as the baseline of 100. (In CAWS, Chase Utley is 100 and Whitaker 101, but Utley is well above Whitaker in CWAR, so choosing Whitaker seemed a better intuitive threshold/cutoff point. I’ve added Eddie Collins and Nap Lajoie, whom Mike included in his book, which considered Deadball Era stars.
CAWS+…CWAR+
164…………165……Eddie Collins
158…………186……Rogers Hornsby
148…………142……Joe Morgan
144…………149……Nap Lajoie
126…………..99……Craig Biggio
118…………121……Charlie Gehringer
116…………103……Roberto Alomar
116…………112……Robinson Cano
113…………106……Ryne Sandberg
111…………118……Rod Carew
109…………105……Frankie Frisch
105…………..84……Jeff Kent
105…………108……Bobby Grich
101…………100……Lou Whitaker
100…………107……Chase Utley
..99…………108……Jackie Robinson
All this comparison does is show how significantly the two systems, WS and bWAR, differ. My cutoff of 100 is entirely provisional: I chose a CWAR level, in raw numbers, of 57.0 because that was where Whitaker was (actually 56.9). I don’t mean this to be anything but an initial demonstration of what a CWAR+ list might look like. (Since position adjustments are already built in to WAR-based figures, all positions would need to be calculated first to see where a good cutoff line might actually be.)
What this shows is that the ranking of players varies pretty dramatically depending on which metric you select as your base. And in terms of Hallworthiness, there are difference even more profound. Biggio, for instance, is an absolute lock in WS/CAWS: the fifth most Hallworthy second baseman ever. But CWAR puts him right on the edge. Jeff Kent falls far off the list, with Joe Gordon (99) and Willie Randolph (93) significantly superior.
This is just a first pass at seeing how the base metric affects Mike’s specific CAWS list. I’m not arguing Mike’s list and figures are “wrong”: they’re not wrong, they’re just different from the way bWAR sees things.
Nice comparison, Bob.
I guess I’m as much surprised at how close the numbers are for most of the players, as I am at how different they are for a few. 12 of the 16 are within 10 points, and only Biggio and Hornsby are more than 25 points apart,
For their top 10 WAR seasons, Hornsby had 98.6 WAR compared to only 45.3 for Kent, more than a 2:1 advantage for Rajah. But their top 10 WS seasons were much closer, 381 to 252, only slightly better than 1.5:1 advantage. I presume that disparity is partly, or maybe mostly, attributable to their different baselines, a replacement level player for WAR vs. zero for CAWS, where every little bit helps and, even if it doesn’t, that doesn’t result in a negative contribution as happens in WAR.
That’s an interesting point, Doug. You’re right: most of the players hold close to the same quality level across systems, while a few change dramatically. I’d add Kent to Hornsby and Biggio.
Looking at Kent, there are some interesting disparities that seem to go beyond the differences in baselines, e.g., looking at the start of his career:
Year……WS……WAR
1992…..10………1.7
1993…..13………0.3
1994…..18………2.7
1995…..11………3.2
1996…..11………2.4
It’s a small sample, but the lack of correlation between the two systems seems a lot more profound than we might expect.
Bob, this is fascinating that some players seem to have wide divergences. Leads you to an interesting side discussion: We rely (whether we admit it or not) on things like WAR to help us rank players but, in theory, if we were properly valuing worth, all systems should, within a fairly small tolerance, end up in the same place, particularly in rating players in relation to each other. We’ve spent years talking about the COG, and, exclusive of the real greats, selecting one player over another when the differentials on WAR are maybe a total of 4 (about a 1./4 of a WAR per year) set over an entire career. But when two systems that should produce about the same values, and do produce them in the vast majority of cases, also spit out these, where’s the flaw?
My hunch as to why WAR and CAWS may end up in the same place in many cases is that, while CAWS gives players a leg up for their core value with its lower baseline than WAR, that “lead” goes away with WAR giving credit for 100% of a career while CAWS gives only 25% credit for the rest of the career outside of the core seasons.
Actually, though, my comparison of second basemen was between CAWS and “CWAR”, not CAWS and WAR, and the comparison in Jeff Kent’s case is between WS and bWAR.
Sorry if that was confusing. I was talking about WAR generally, not your CWAR stat.
I think you’re bang on in your remark below about defense; it does figure much more prominently in WAR than WS, and probably with good reason.
In the Jeff Kent example, I think we may be glimpsing two effects of WS vs. WAR, rather than a single underlying cause.
We know that 1) WS weights fielding vastly less than WAR. We also know that 2) WAR measures the quality of a player’s statistical record: the number of runs/wins it could be predicted to generate, while WS measures the share individual players deserve for actual wins, not predicted wins, and in doing so it pits each player against his teammates in assessing who on the team deserves what share of a limited number of wins. In other words — that is, other words from someone with a limited understand of both systems — WAR is basically calculated the way that Pythagorean wins are calculated: Runs Above Average/Replacement are calculated on the basis of the quality of the player’s statistical record and converted to Wins Above Average/Replacement, regardless of how many actual wins the player contributed towards.
Here are Kent’s figures from his three seaons entirely with the Mets (1993-95), with the Mets’ W-L% and Pythagorean figure added:
Year……WS……WAR…..W-L%……Pyth.
1993…..13………0.3……364……….451
1994…..18………2.7……534……….524
1995…..11………3.2……479……….528
In 1993, I think the discrepancy is largely attributable to fielding. Kent had -1.6 dWAR, a very high negative figure that WS simply won’t reflect. In 1994, where actual and predicted wins are very close, we may have sort of a baseline agreement (Kent’s fielding figures for ’94-’95 are slightly positive: 0.7, 0.8). In fact, Kent’s oWAR figures for ’93 and ’94 are identical. In 1995, we have a large discrepancy between the two W-L calculations, which will lead WS to rate Kent far lower than WAR. That last is true also of 1993, and so my initial assumption is that the discrepancy in fielding, given Kent’s very low figure, simply outweighed the wins issue.
This is just a speculative start to trying to see why the two systems may yield strongly different results in some cases.
I think it’s good to separate Mike’s work from the WS vs WAR debate (of which my opinions are well expressed already on here). It’s still an interesting division and relates better to what we’ve typically been working with on here. Nice job Bob, as always.
Sorry that I post random statistical things that have nothing to do with the topic, but frankly, this CAWS business is over my head.
I’m fascinated, and horrified by, this trend of home runs and low OBP.
Here is what Yasiel Puig is projected to do by the end of the year:
37 HR
99 RBI
24 SB
.282 OBP
… and the now normal 159 SO
Only season that looks like that, without the SB, is Dave Kingman in 1982.
https://www.baseball-reference.com/players/k/kingmda01.shtml
Voomo,
……and teammate Joey Votto has 20 RBI in 78 team games. He’s on pace for 42 in 162 team games. Here are 1B, fewest RBI, 1920-present, 600+ PA, 75% of games played at 1B:
………………………………RBI…..PA….YR……..AGE….TEAM
1 Gene Paulette 36 608 1920 29 PHI NL
2 Elbie Fletcher 38 606 1937 21 BSN NL
3 Mike Hargrove 40 616 1978 28 TEX AL
4 Eddie Waitkus 44 614 1948 28 CHC NL
5 Eddie Waitkus 44 702 1950 30 PHI NL
6 Rod Carew 44 612 1982 36 CAL AL
7 Lu Blue 45 681 1922 25 DET AL
8 Lu Blue 46 615 1923 26 DET AL
9 Buck Jordan 46 643 1933 26 BSN NL
10 Joe Kuhel 46 617 1943 37 CHW AL
11 Eddie Waitkus 46 664 1951 31 PHI NL
Votto is starting to look like a 35 year-old. 97 OPS+ this year, after never being under 125 previously. Pitchers have noticed; he was intentionally walked 50 times from 2015 to 2017, but only 8 times since then. But, don’t count him out just yet; historically, he’s been considerably better in the second half.
Doug,
He’s .299/.411/.508 historically for the 1st half which isn’t exactly, oy vey, chopped liver. About .920 vs. .993 1st vs 2nd halves….. It can’t be easy for anyone, except the Cooperstown inner sanctum guys, to perform at a previous career level at age 35. And even those greats (Aaron comes to mind) weren’t playing 162 of 162 and taking days off on a once/week basis.
Maybe these GM’s will hold off on the 10 year contracts? I have to believe Pujols (3rd greatest 1B of all-time?) would have been platooned or retired for a few years by now if Arte Moreno didn’t owe him a boatload ($59M) for the final two years. Votto is owed $107M for 2020-2023 including the 2024 buyout
Point taken. Somewhat better in second half may be closer to the mark.
Actually, it may just be a slow start. Votto was .208/.323/.340 thru May 19, but himself (.330/.400/.519) since then.
Someone, somewhere, maybe Baseball Prospectus, pointed out that, two years ago, Votto had really sold himself out, gotten even more selective and was trying to hit everything in the air- and hit it hard. But, I kind of believe his approach wasn’t all that much different prior to that with him never popping up in the infield with something like 5 years between foul pops to the 1B ? Pretty incredible hitter; a total on-base machine
Votto just reached safely 5 times and stole a base. Perhaps he reads this website and it lit a fire.
A few observations at the halfway point of the season…
Minnesota is on pace to hit 300 homeruns.
Five teams are on pace to break a homerun record set by the Yankees last year.
Pete Alonso is on pace to hit 54 homeruns as a rookie.
Gary Sanchez has 23 home runs in 60 games.
The record for homeruns by a catcher is 45, by Johnny bench.
Hunter Renfroe, Franmil Reyes, Eddie Rosario, and Jay Bruce are all on pace for more than 40 homeruns with more homeruns than walks. That has only been done 20 times previously.
There are seven players on pace for more than 200 hits.
Josh Bell is on pace for 60 doubles, and nearly 400 total bases..
Christian Yelich, 58 homeruns and 34 steals.
Domingo Santana and Brandon Lowe are both on pace for more than 200 strikeouts with an OPS+ over 125.
Hyun-Jin Ryu has nine sacrifice hits and three actual hits.
Dylan Bundy and Aaron Sanchez are both on pace to lose 20 games.
Marcus Stroman is on pace to lose 18 with an ERA+ of 145
That has been done 14 times before, but only twice in the live all era.
Ned Garver in 1950 and Dolf Luque in 1925.
Most likely, Stroman will spend the last two months of the season on a good team and avoid this anomaly.
The Dodgers have the top 3 In winning pct. Ryu, Butler, Keyshawn.
Brandon Workman has given up 12 hits, and walked 26. He also has an ERA plus of 277. And he leads the AL in both games pitched and winning percentage.
Nobody has ever given up twice as many walks as hits in a season of more than 18 IP.
Those Dodgers should read Buehler and Kershaw.
…
Ryne Stanek is on pace for 46 games started and 91 innings pitched.
Mike Leake and J.A. Happ are both on pace to give up more than 40 homeruns with more HR allowed than BB.
That has only been done twice before. Robin Roberts and Bronson Arroyo.
Josh Hader, 2.9 H/9, 17.2 SO/9.
Justin Verlander, 5.00 H/9. On pace to break the record.
Today’s London game was the first between New York and Boston with both teams scoring more than 12 runs. The total of 30 runs scored is second only to the Yankees’ 20-11 win on 8/21/2009.
It was also the 3rd longest 9-inning game at 4 hours 42 minutes. The two longer games (4:45 and 4:43) were also Yankee/Red Sox affairs. This is the 235th regular or post-season 9-inning game lasting 4 hours or more; 16 of them have matched the Yankees and Red Sox.
Early in this string I wrote a longish comment on the issues I thought needed to be considered in devising as good a Hall monitor as possible. The only comment that comment generated was my own, to the effect that it was too long. Someone, however, gave the comment an encouraging thumbs down so I thought I’d follow up.
I’ve been trying to devise a formula that responded to some, at least, of my own criteria. For example, I chose a base system (bWAR; Surprise!), and tried a new way of balancing quality and longevity. The formula includes four separate measures (thinking of position players only right now — perhaps pitchers will be comparable):
Total WAR
Best 10 seasons
Best 5 seasons
WAR/502PA
The basic formula that links all these is this: (WAR + (Best10 / 3) + (Best5 / 3) + ((WAR/502PA*20) / 3)) / 2
That is, to Total WAR, the next two are added, but with only one-third their value each, and then WAR rate is a qualifying season rate multiplied by 20, and also counted at one third value. The the major components — WAR at full value and the other three at one-third value each, are divided by two. The reason I multiply the WAR/502PA rate by twenty is because when I averaged the career lengths of the top 100 position players, according to WAR, the average rounded to 20 seasons. So the rate stat becomes a component representing a player’s average quality in terms of a “standard” Hall candidate career.
Putting it another way, WAR represents 50% of the weight, and the remaining three 16.7% each. I am so open to modifying these weights that I’m almost embarrassed to state what I settled on. It’s not arbitrary: I thought through the idea of the quantity measure of WAR being balanced by three different pictures of quality (true peak — how great could this guy be; sustained peak — Mike’s “Core Value”; and career value level — overall quality projected over a standard career length). (I divide by 2 because the result is in the neighborhood of 2*WAR, and halving it brings it to a familiar scale.) But even though it’s not arbitrary, it’s thoroughly arguable.
Appropriating an acronym I used before, I’m going to refer to this scale as WARQ (Q to indicate quality measures). I also normalized the results to a 100 scale, like CAWS+: WARQ+. My sample as I worked on this was, once again, second basemen, so I once again took Lou Whitaker’s result as representing a first shot at a borderline, 100 case.
I also built in some add-ons — none of the numbers here is immune from adjustment:
1) I came up with a numerical formula for the “Catcher Bonus,” which recognizes that apart from on-field positional adjustments, catchers need a career adjustment because of the physical toll the position takes. Since “career catchers” often convert to other positions at some point, the formula, based on a 20% bonus for a 100% full time catcher, and thus provides any player a 1% increment for every 5% of his career games played at catcher. Among second basemen, this applies to Craig Biggio, who played 15% of his games at catcher, and earned a 1.7 WARQ bonus on his raw WARQ score of 55.9.
2) I made adjustments for segregation. My thinking on this is that the “benefits” MLB players received from the exclusion of black players varied over time, based on how much talent was being developed by black communities in semi-pro and professional leagues outside the white structure. I exact a 1% penalty on players in the 19th century, 2% in the 1900s, 3% in the 1910s, 4% in the 1920s, 5% in the 1930s and 1940s (there being so few black players in the initial two or three years of integration that the effect on competition was small), and a 2% penalty in the 1950s. This is tedious to calculate because the players of the segregated era whom we’d consider for the Hall all played in multiple decades, so the penalty has to be calculated in pieces: the formula I used was the average percent penalty exacted on the whole WARQ score. Oddly, this resulted in Jackie Robinson being penalized for playing during an era when segregation’s effects were still strong, but, logically, in 1947-49, Robinson did “benefit” from having to face almost no black competition, just like white players. Penalties in the low single-digit percentages may not seem like much, but the issue is most live when it comes to borderline players, and apparently small adjustments down can actually knock players below benchmarks.
3) Because there are no leading second basemen who played in the War years (apart from a handful of games in Gehringer’s case), I didn’t develop a numerical formula to handle that. But I think the best solution will be this: For players who served in the military in war, or had their careers interrupted in peacetime, there should be a bracketed WARQ score that shows a projection of total score, assuming an average in the missing years equal to the average of the years just before and after service. For players who played through World War II, when MLB quality was lower, there should be ascending discounts of their WAR number for those years, ascending from a low discount in 1942, to a higher one in ’43, and then a maximum one in 1944-45. I haven’t yet experimented with what those figures should be.
4) For players whose careers fall in the span of 1901-60, I multiplied WAR figures by 1.05, adding 5% to bring them to parity with players whose annual WAR is compiled over a 162-game schedule. (The Hall of Stats does this sort of thing for early players.)
5) Because of my own views, I elected not to build in numerical premiums for milestone achievements (3000 H; 500 HR, etc.) or awards, such as the MVP and CYA.
It’s now too late at night for me to do what I’d initially planned: give detailed examples of how this works out with two or three second basemen, and then compare the results for CAWS+ and WARQ+ (and also perhaps CWAR+) for the entire list. I’ve done the math, and the bottom line is that WARQ+ isn’t too different from CWAR+, so it may not be worth the trouble — but WARQ+ likes Whitaker, so a number of other second basemen fall out of Hall range; the benchmark raw WARQ score may need adjustment. In any case, I’ll post examples and the full list tomorrow, unless the world ends and I’m saved the trouble.
So far this orning the world has not ended, so, following up on last night’s comment, here is how a “WARQ” calculation that included Total bWAR (50%), Best 10 (16.7%), Peak 5 (16.7%), and WAR/502PA (16.7%) would play out for some second basemen.
To get a raw WARQ score for Craig Biggio, we take:
WAR: 65.5
Best10: 53.7
Peak5: 32.8
Rate: 2.63 WAR/502PA . . . x 20 = 52.6
Apply the formula: (WAR + (Best10 / 3) + (Best5 / 3) + ((WAR/502PA*20) / 3)) / 2 and the result is a raw score of 55.9. Biggio spent 15% of his career games at catcher, so we add 3% (1.68, or 1.7) to his raw score, giving him 57.6 WARQ.
Let’s look at Jackie Robinson. Robinson played during the era of 154-game seasons, so he’s going to have his WAR counting stats inflated by 5%, to put him on a par with later players, who played 162-game seasons.
WAR: 61.4 –> 64.5
Best10: 61.4 –> 64.5
Peak5: 42.1 –> 44.2
Rate: 5.31 x 20 = 106.2
Raw WARQ: 68.0
Robinson played in an era affected by segregation. Although he was himself black, he still “benefited” from the initially virtually total exclusion of black competition (he faced none until mid-1949), and then from the underrepresentation of black players through the end of his career, in 1956 (at that point, black players represented about 10% of MLB players, on the way towards a stable level of 25%). So we apply a segregation penalty even to Robinson: 5% for the years 1947-49, which comprise 35% of his career PA, and 2% for 1950-56. Altogether, Robinson loses 1.80 points for a WARQ score of 67.2.
Biggio is the only player who earns a catcher bonus among leading second basemen, but there are a number of others who are assessed segregation penalties: Eddie Collins (-3.4 on a Raw WARQ score of 104.3); Rogers Hornsby (-4.5 from 115.7); Nap Lajoie (-1.8 from 94.9); Charlie Gehringer (-3.1 from 73.6); Frankie Frisch (-2.4 from 64.7). A player like Gehringer is penalized at a higher rate than one like Lajoie because Charlie played in an era where segregation excluded many MLB-ready players in well-developed Negro Leagues, whereas Lajoie, whose career begins in the 19th century, played at a time when there were likely few black players ready to succeed on the MLB level.
These WARQ scores (57.6 for Biggio, 67.2 for Robinson) don’t allow easy comparison with CAWS, Hall of Stats, etc., so I’ve normalized them, just as CAWS was normalized by CAWS+, where 100 represents a perfect borderline-Hall player, modeling the idea on the Hall of Stats. I chose – as a very provisional tactic – Lou Whitaker, whose WARQ score is 63.4, to represent the threshold of the Hall, and made WARQ 63.4=100 WARQ+. On this basis, Biggio falls short, with 91 WARQ+, while Robinson is in, with 106 WARQ+. That doesn’t mean Biggio isn’t Hallworthy (perhaps we should use him, rather than Whitaker, as our benchmark player, as I’ll suggest below). No stable benchmark can become visible until we look at many more players than second basemen, anyway. I believe WARQ+. like CAWS+, can’t stray far from our intuitions, and intuitively I think Biggio is worthy of the Hall induction he actually received.
We (or perhaps, I) also need to consider how reweighting the numbers in the WARQ formula might bring the system closer to intuitive credibility. For example, Robinson outscores Biggio, in part, because I’ve used a 20-year multiplier for WAR/502PA; Biggio, who had a career WAR rate less than half of Robinson’s, obviously suffers in that component. If I were to use a 10-year multiplier, his position would improve. However, because that component represents only 1/6 of the total WARQ score, his gains would still be limited: Robinson’s total would still be significantly higher. This is because WARQ builds in high quality seasons multiple times: Peak5 is represented in Total WAR, Best10, and Peak5. Robinson’s peak was far higher than Biggio’s, and that’s the main reason his scores are higher. I’m not much of a mathematician, but I believe that among the three counting stats categories, Peak5 accounts for 47% of the value and Best10 for 33%, with 20% coming from remaining seasons. That 80/20 proportion for “core value” seasons is the same as CAWS, but the weight is concentrated in Peak5 (where Robinson outshines Biggio even more than in Best10), and then the 16.7% of WARQ represented by the WAR rate stat add a further difference.
To finish up, I’m going to list the second basement whom CAWS finds Hallworthy, ranked instead by WARQ+, with a comparison both to CAWS+ and to CWAR+ (which is the exact translation of CAWS into WAR). It will be clear from this list that more than anything else, the WS/WAR choice determines which players will tend to do best. I’ve added Hall of Stats as a control.
WARQ+………CAWS+……..CWAR+…….HoS
175……………..158…………..186………..289…..Rogers Hornsby
159……………..164…………..165………..253…..Eddie Collins
147……………..144…………..149………..227…..Nap Lajoie
135……………..148…………..143………..203…..Joe Morgan
111……………..118…………..121………..159…..Charlie Gehringer
111……………..111…………..118………..158…..Rod Carew
106……………….99…………..108………..125…..Jackie Robinson
103……………..105…………..108………..141…..Bobby Grich
100……………..101…………..100………..145…..Lou Whitaker
100……………..100…………..107………..136…..Chase Utley
..99……………..116*………….111……….135*….Robinson Cano
..98……………..113…………..106………..130…..Ryne Sandberg
..98……………..109…………..105………..138…..Frankie Frisch
..93……………..103…………..103………..127…..Roberto Alomar
..91……………..126…………….99……….127…..Craig Biggio
..78……………..105…………….84……….103…..Jeff Kent
*Cano’s still active and having a poor season; CAWS+ and HoS figures are through 2018.
The Hall of Stats sets its benchmark on the basis of the number of players actually in the Hall. Jeff Kent clears the barrier, even if WARQ+ and CWAR+ don’t see him that way. This is because the latter systems use Lou Whitaker as the benchmark, which is what CAWS+ suggests, and the HoS also sees Whitaker as far superior to Kent. If we normalize WARQ+ to Jeff Kent, following HoS Hall size standards, we get something much closer to HoS:
WARQ+………CAWS+……..CWAR+…….HoS
224……………..158…………..186………..289…..Rogers Hornsby
203……………..164…………..165………..253…..Eddie Collins
188……………..144…………..149………..227…..Nap Lajoie
173……………..148…………..143………..203…..Joe Morgan
142……………..118…………..121………..159…..Charlie Gehringer
142……………..111…………..118………..158…..Rod Carew
136……………….99…………..108………..125…..Jackie Robinson
132……………..105…………..108………..141…..Bobby Grich
128……………..101…………..100………..145…..Lou Whitaker
127……………..100…………..107………..136…..Chase Utley
127……………..116.………….111………..135…..Robinson Cano
125……………..113…………..106………..130…..Ryne Sandberg
126……………..109…………..105………..138…..Frankie Frisch
119……………..103…………..103………..127…..Roberto Alomar
116……………..126…………….99…….….127…..Craig Biggio
100……………..105…………….84…….….103…..Jeff Kent
Robinson still benefits most from WARQ, principally due to its rate component, but perhaps normalizing to Kent’s level within this pool of players makes most intuitive sense. I’m a small Hall guy, and Kent would not get my vote. But Biggio would, and perhaps his level is closer to where I’d draw the line; obviously, a “Small Hall” will draw the border at a point higher than a “Current Hall” model like the HoS.
To sum up, I think the biggest discrepancies from CAWS and HoS that this calculation involves, represented here by the cases of Robinson and Biggio, are the relative weights given to peak quality and longevity. Robinson was a dynamite player for a short career, with a terrific WAR rate; Biggio had a more modest peak and then stretched his career to meet the 3000-hit benchmark, lowering his career WAR rate. Since I assign no numerical credit for benchmarks, Biggio’s career stretch gets only negative credit here – the benchmark issue would need to be brought in as part of the narrative that goes beyond the single-figure ranking. Basically, Robinson represents the type of player this system is designed to favor, and Biggio the opposite. CAWS, which does not measure a true peak, will understate Robinson’s value because it makes his entire career, including its decline, his core value – and the fact that CAWS understates Robinson’s value is something Mike recognizes too: it’s why players like Robinson are invited in through a loophole. This WARQy system more or less builds that loophole in through its rate stat, turning an arbitrary cutoff point into a curve based on a formula.
On reflection, I think that I should eliminate the 5% boost to Total WAR for pre-1961 players, who played a 5% shorter schedule. In theory, while the shorter seasons may have limited annual WAR, it may have prolonged longevity. I think the boost is still appropriate for Best10 and Peak5 figures.
— As the politicians say, I want to make one thing perfectly clear (but I don’t plan to follow that statement with gobbledygook, as they generally do): I’m posting comments of this semi-baked WARQ idea because in this preliminary state, I’m hoping it will invite ideas for making it better or different, and arguments over interesting points on issues relating to Mike Hoban’s own Hall project of CAWS, the subject of this series.
I think it would neat and good for this site if out of discussions like these, we ultimately formulated a consensus Hall monitor linked to HHS, one that, like the CoG, could be a reference source to enhance statistical conversations generally.
Dinelson Lamet is about to return from TJ surgery.
He had an inspiring but odd rookie season in 2017.
4.57 ERA while allowing only 6.9 H/9.
Highest ERA in a season of 100+ IP, and a H/9 under 7:
5.31 … Eric Plunk
4.71 … Herb Score
4.57 … Lamet
4.41 … Rex Barney
4.10 … Sam Jones
4.08 … Juan Nieves
3.98 … Randy Johnson
That was also a rookie season for Plunk, and one of 18 seasons of 100+ IP with more Walks allowed than Hits.
And it was done twice in 1986, by Plunk and fellow rookie Bobby Witt.
Unless I totally missed it, I’ve seen no mention of Mike Trout. According to Baseball Gauge, he’s compiled 289 Win Share, all in his first (only) 9 years. So that’d put his CAWS score at…289. Correct? That’d seem to slot him in right in the middle of the Hall of Fame CFers. Which is insane. Am I looking at that correctly?
Why is that insane? Mike Trout has already posted HOF numbers and there is no telling (if he remains healthy) where he will eventually rank among the greatest players ever. Albert Pujols, for example, is among the top 12 position players since 1920.
Sorry… insane in a “Holy moley he’s insanely good!” Obviously he is going to rank high in rate stats but this is a (modified) counting stat and he’s already in elite territory with what amounts to half a career. Surprised he wasn’t mentioned.
Mike Trout was not mentioned in the CAWS rankings because a player must have completed 10 major league seasons to be considered.