Monthly Archives: November 2012

Is Barry Zito among the most or least reliable starters?

We are now in the tenth decade of the live-ball era, generally acknowledged to have begun in 1920. Offensive and defensive periods have come and gone within this era, even to extremes like the 1960s, sometimes referred to as the second dead-ball era, and the homer-happy 1990s and 2000s.

With those changes, the use of starting pitchers has also changed. This post will explore those changes and look at the pitchers who have most frequently exceeded and most frequently fallen short of the changing performance standards expected of starting pitchers.

Continue reading

Pitchers Who Help Themselves

The highest WPA-rated hitting performance by a pitcher in 2012 was this game by Anthony Bass, the only pitcher with a game WPA score above 0.3.

Rk Player Age Date Tm Opp Rslt PA AB R H 2B 3B HR RBI BB SO WPA RE24 aLI
1 Anthony Bass 24.185 2012-05-04 SDP MIA L  8-9 3 3 1 2 0 1 0 3 0 0 0.345 2.634 1.463

After allowing 5 runs on 4 hits (incl. 2 HR)  in the opening frame, Bass redeemed himself with a two-out bases-loaded triple in the 3rd inning to put the Padres ahead 6-5 and chase opposing starter Josh Johnson. Bass left after 6 innings with a lead that the bullpen promptly surrendered en route to San Diego’s loss in 12 innings.

The last pitcher with a WPA score above 0.4 was in this game.

Rk Player Age Date Tm Opp Rslt PA AB R H 2B 3B HR RBI BB SO WPA RE24 aLI
1 Mike Stanton 26.342 1994-05-10 ATL PHI W  9-8 2 2 0 2 0 0 0 1 0 0 0.433 1.326 3.635

Stanton was the Braves’ seventh pitcher of the game, entering in the 12th inning and pitching four scoreless frames. He singled leading off the 14th but was stranded. In the 15th, Stanton came up with two out and runners at 1st and 2nd. After Deion Sanders stole 3rd, Stanton delivered a walk-off bunt single on the next pitch.

Neither of these games, though, makes the top 10 of pitchers’ WPA games for the available data, which are mostly complete since 1950 with some games as early as 1948. After the jump, I’ll take a closer look at those top 10 games, and also at changes in how pitchers have batted in past 60 years or so.

Continue reading

Introducing the Hall of Stats: An alternate Hall of Fame populated by a mathematical formula

The Hall of Stats

I’ve been in a bit of a baseball-writing hibernation lately. Today I’m happy to show you why.

Over the last couple years, I’ve been obsessed with the idea of a Hall of Fame populated by a single statistic. I whipped up a little stat called wWAR and built a small site called The Hall of wWAR. But I wasn’t done yet. The formula needed tweaking. The site could be better.

I enlisted the help of a couple dear friends who happen to be the best software developers I’ve ever seen—Jeffrey Chupp and Michael Berkowitz. We’ve been hard at work and have a little something to share with you.

The Hall of Stats

There are so many things here that I’m proud of, so I’ll just share a few in some bullets…

  • Like the Hall of wWAR, the Hall of Stats kicks everybody out of the Hall of Fame and re-populates it based on a formula.
  • That formula is expressed as “Hall Rating” and uses WAR and WAA (from Baseball-Reference) as the main inputs.
  • A Hall Rating of 100 represents the Hall of Fame borderline. Over 100? You’re in. Under 100? You’re out.
  • The site features every player in history, from Babe Ruth to Bill Bergen.
  • Every player page features visualizations of the player’s career run values and year by year WAR and WAA stats.
  • Some players (just a few so far) feature a short bio and (around 400) a photo.
  • Perhaps my favorite part of the project is our value-based similarity scores. While Bill James’ scores are based on raw statistics, these are based on WAR run value components.
  • There are a bunch of other articles so far, too.
  • If you’re into the nitty gritty, there About page is super-detailed.

I invite you to take a look, poke around, and let me know what you think. Thanks!

Baseball and Presidents

www.wikipedia.org

For a frivolous interlude, some random musings on baseball’s connections to presidents.

Of course, presidents have been known to throw out ceremonial first pitches on Opening Day and, more recently, at All-Star games. And, one president has been credited with inadvertently instituting the tradition of the seventh-inning stretch. But, there are more connections than that.

Some musings after the jump.

Continue reading

Quiz – all-time greats … and one other guy

Here is a list of all-time greats, plus one player who presumably doesn’t belong with this group. Except that he does belong.

These are the only players since 1901 to accomplish what feat.

Hint: the feat is in multiple parts.

I have managed to stump our esteemed panel here (a pretty rare feat). The answer is that the above players are the only ones with a season since 1901 of 120 runs, .600 slugging, and HRs of less than one-third of extra-base hits.

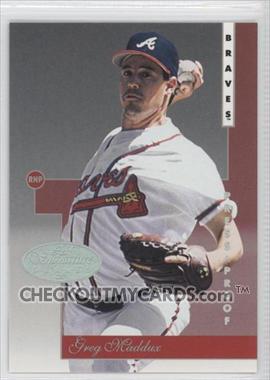
Greg Maddux and 5/20 Pitchers

This past spring, birtelcom wrote a piece about Greg Maddux, looking at his pitching efficiency in terms of pitches thrown per inning. As pitch count data are consistently available only since the late 1980s, his analysis was limited to the period of the past 25 seasons or so. That being said, Maddux was clearly in a class of his own in terms of minimizing pitches thrown per inning pitched.

In this post, I will approach the same topic a bit differently to extend the analysis through the entire history of professional baseball. Perhaps unsurprisingly, the name Greg Maddux again figures very prominently.

Continue reading

Left-Wing Leadership

For the 2012 season, Baseball-reference.com’s formula for pitching Wins Above Replacement (bWAR) makes Tampa’s David Price the pitcher with the most bWAR among all left-handed pitchers in the majors, by a small margin over Clayton Kershaw of the Dodgers and Matt Harrison of the Rangers (Harrison’s 6.2 pitching bWAR was the highest season total ever for a lefty pitching for the Rangers franchise, breaking Jon Matlack’s record from 1978).  Over the past five seasons, the bWAR formula has produced six different major league season leaders in the category of most pitching bWAR among lefty pitchers:

2012 David Price
2011 Cliff Lee
2010 Clayton Kershaw
2009 tie, C.C. Sabathia and John Lester
2008 Johan Santana

Over major league history, there have been several eras of this kind of extended multi-year diversity when looking at the top bWAR lefty in the majors each season, but there have also been periods of dominance by a single pitcher.  A full table of each season’s top lefty by pitching bWAR, going back to 1901, is after the jump, along with some notes on the list.   Continue reading

Anti-Freese: Cliff Bolton, Historic Post-Season Goat

Win Probability Added (WPA) is a stat that estimates how much the outcome of each plate appearance has changed the chances of each team’s winning the game, as compared to how those chances stood just before the plate appearance took place.  WPA assigns to the hitter the amount of that change as it affects the hitter’s team, and to the pitcher the amount of the effect on the pitcher’s team.    So, for example, just as Jayson Werth stepped to the plate for the Nationals in the ninth inning of Game 4 of the NLDS this season, Washington’s chances of winning the game were estimated (based on the score, the inning, the outs, and the man-on-base situation) at 67%.  After Werth hit his walk-off homer, those chances, obviously, rose to 100%, so Werth is awarded a +.33 amount of WPA for that plate appearance, while Lance Lynn, who threw the home run pitch, has a -.33 WPA applied to his account.  If you add up a player’s WPA for each of his plate appearances in a game you get his total WPA for that game.  Any player with more than a few games played in his career will have some games in which his WPA comes out positive and some where it comes out negative.

David Freese’s +.97 WPA in the sixth game of the 2011 World Series was the highest one-game WPA for any hitter in the history of the major league post-season, breaking the record previously set by Kirk Gibson’s limping, pinch-hit walk-off home run in Game 1 of the 1988 World Series.  But what about the Anti-Freese, the hitter with the absolute worst, the most negative, WPA over a single post-season game?  More about that after the jump. Continue reading

Vida Blue and 1971 attendance, revisited

In for a dime, in for a dollar….

In a recent post, I debunked a published quote by Vida Blue complaining that his 1971 home starts had been juggled so as to coincide with Monday’s Family Night promotion. Now I’m reading Dan Epstein’s joyous Big Hair and Plastic Grass: A Funky Ride Through Baseball and America in the Swinging ’70s. Touching on Blue’s 1972 contract holdout, Epstein writes that Blue in ’71 had been drawing thousands of extra fans, at home or on the road, whenever he pitched.”

Continue reading