
Earned Run Average (ERA) and its derivative, ERA+ are, unquestionably, the go to stats for evaluating pitcher performance. Seldom mentioned is Run Average, or RA. Yet, when the runs are tallied at the end of the game, it doesn’t matter whether some are earned and some not; they all count the same.
So, why don’t we pay more attention to Run Average? The conventional answer to this question is that so-called unearned runs are not the pitcher’s fault. All the blame rests solely on the defense. But, is this really true? Let’s find out!
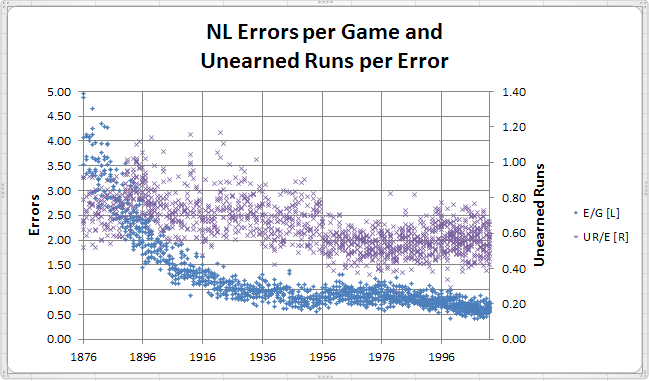
Let’s start with trends in errors and unearned runs. Here are the AL and NL results, with each plot point in the scatter diagram representing a singles team’s result for a given season.
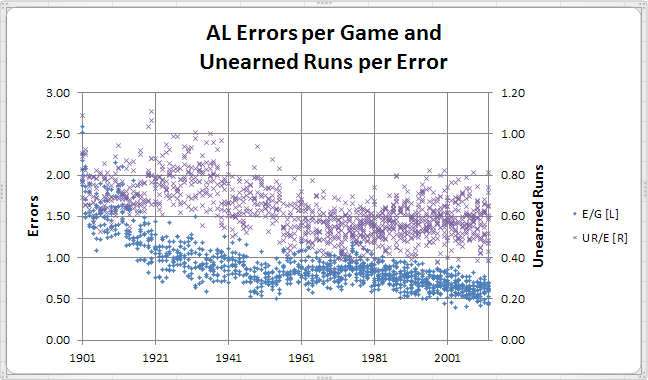
 So, as we would expect, errors and the runs supposedly resulting from them have both declined over the years as improvements have occurred in equipment and playing conditions.
However, since about the 1960s, these factors have been pretty constant with most teams in the range of 0.5 to 1 error per game, and 0.4 to 0.8 unearned runs per error.
So that’s unearned runs. What about the rest of the runs, the so-called earned ones?
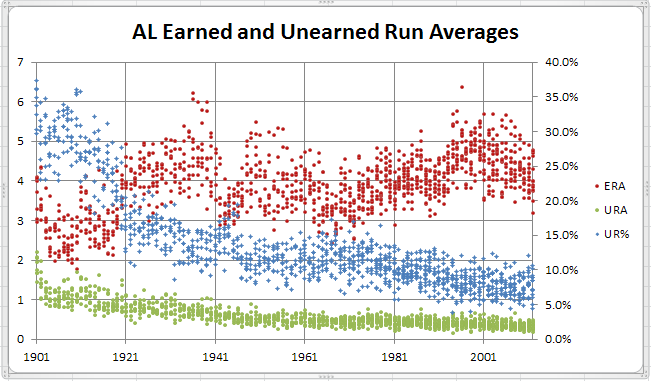
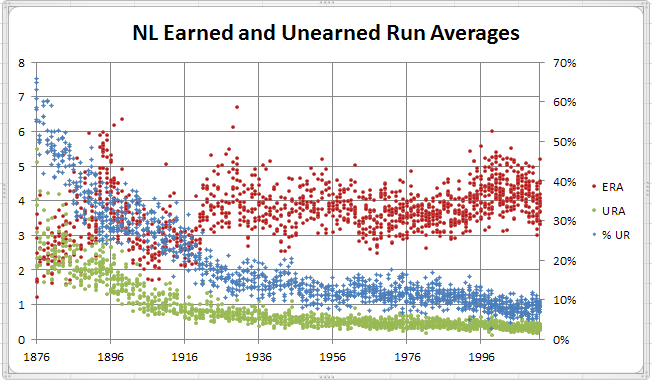
So, while ERA has bounced around over time, URA and UR% (% of all runs allowed that are unearned) have both declined steadily, albeit at very slow rate since the 1960s.
Probably nothing too unexpected up to this point. So, let’s look a bit closer at Unearned Runs per Game (UR/G), and per Error (UR/E), and see to what degree these may be related to pitching or to defense. I will use data since 1961 since most of the game improvements resulting in reduced errors have been in place since that time.
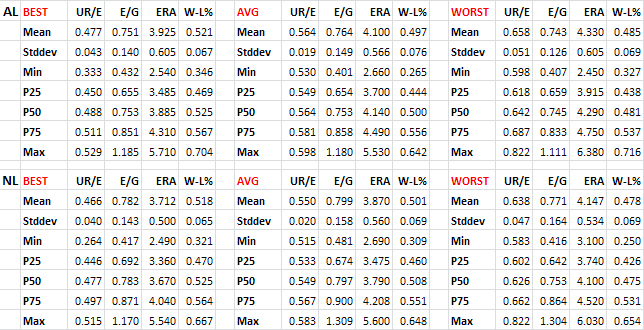
To do this, I’m grouping the team data for both UR/G and UR/E into Best, Average and Worst. In essence, I’m just sorting the team data points from lowest to highest by these variables and then splitting into 3 equal-sized groups.
Let’s start with UR/G. The three groups look like this.
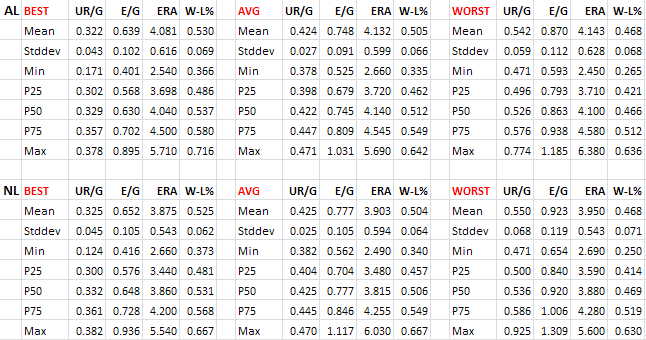
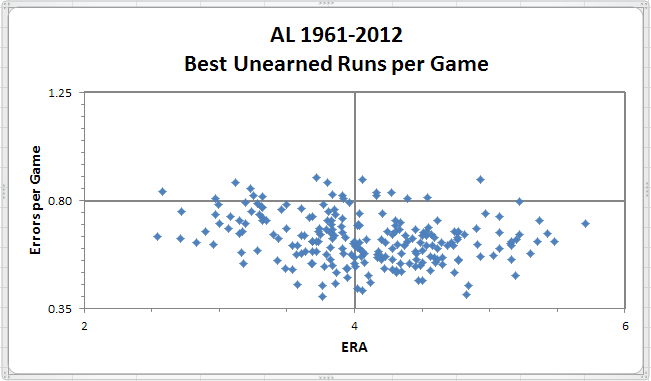
So, as we might expect, as teams allow more unearned runs per game, their W-L% declines (just as it would if more earned runs per game were allowed). But are more unearned runs allowed because of defense or pitching (or both)? Probably much easier to see visually. First the AL data.
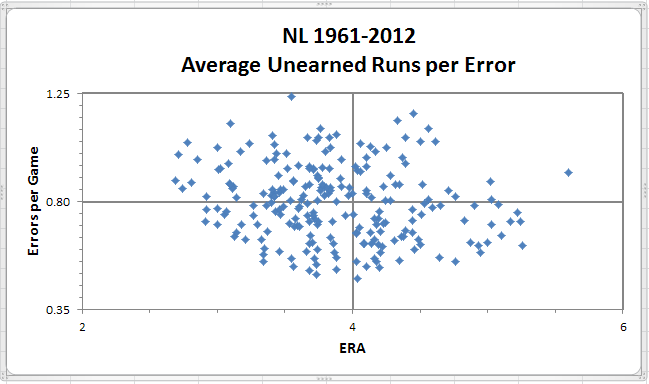
Now for the NL.
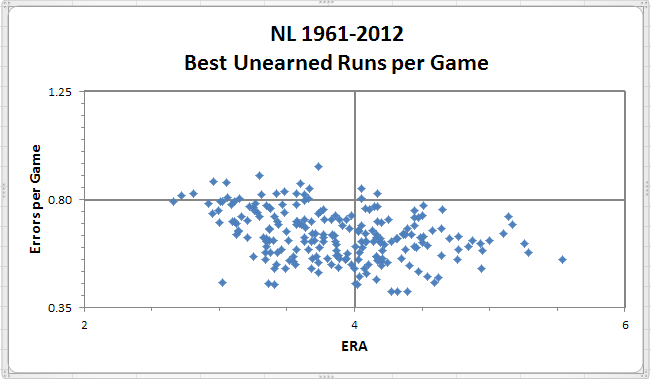
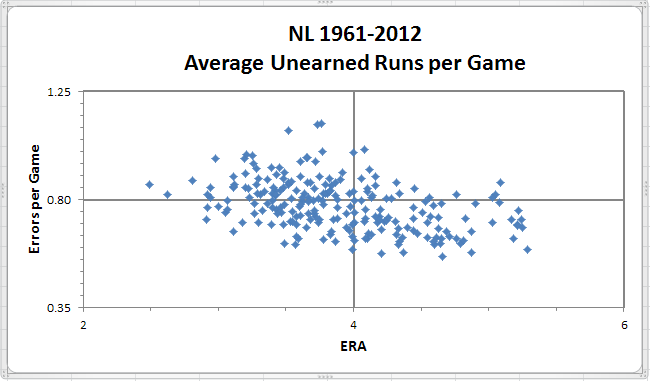
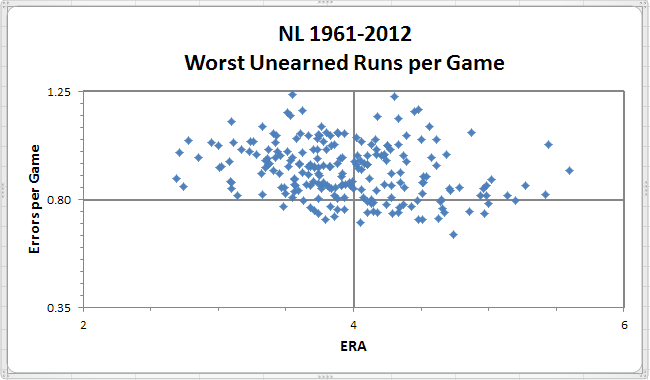
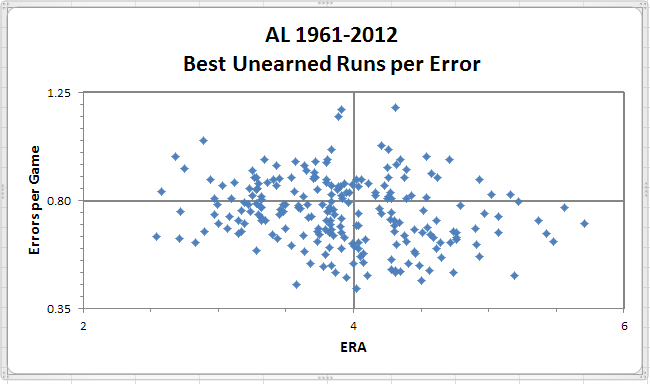
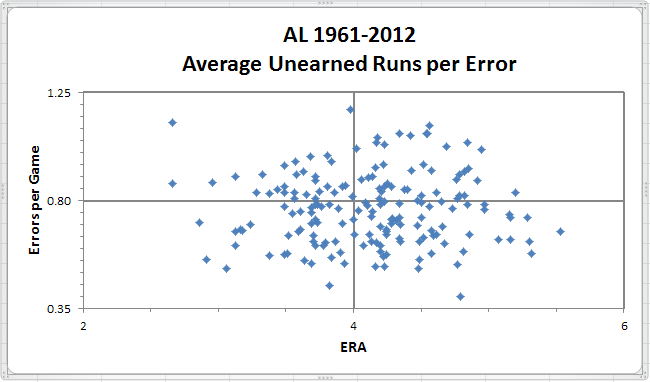
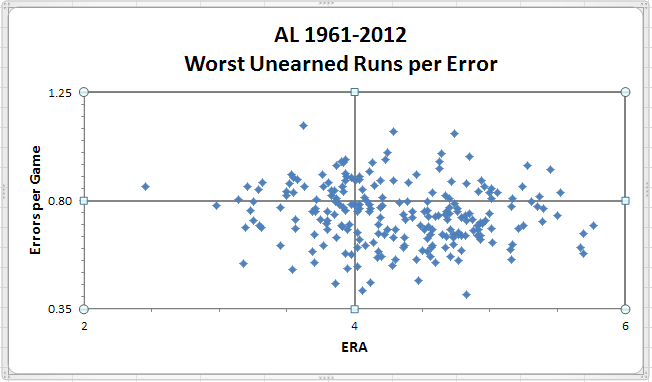
These are team data, one data point for each team/season since 1961. The coordinates of each data point are team ERA for the horizontal x-axis and errors per game for the vertical y-axis. Thus, better pitching teams will be found on the left side of the chart and better fielding teams on the lower portion. The best teams should be in the bottom left quadrant and the worst in the top right, with the split personality teams in the other two quadrants.
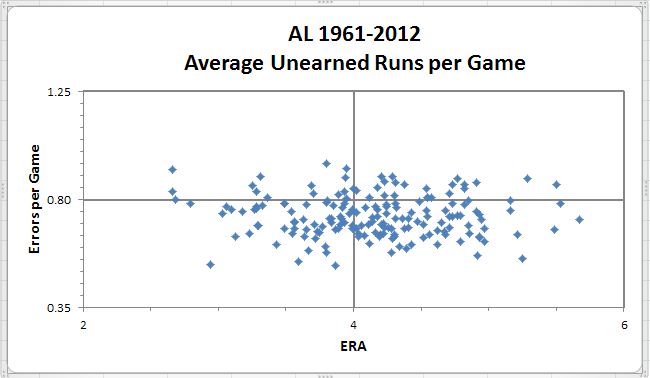
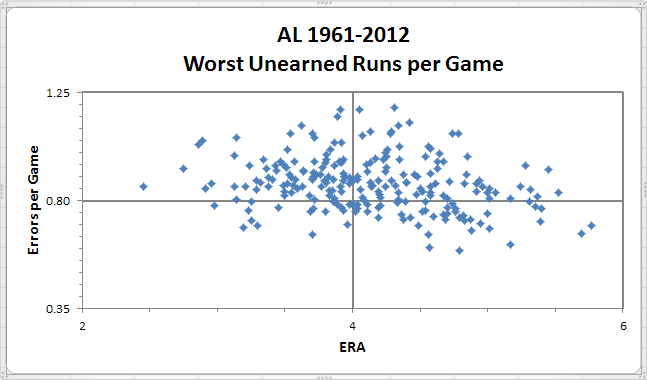
So, what are we seeing? These charts seems to be telling us that pitching has absolutely nothing to do with allowing unearned runs. Why? Well, the swarm of bees that comprise our data points is moving up the chart from bottom to top as we look at the best, average and worst teams in allowing unearned runs per game. There is very little discernible left-to-right (or right-to-left) movement in the swarm that would indicate dependence on pitching quality. But, is that a valid conclusion?
No, it’s probably not a valid conclusion that pitching has nothing to do with a team’s capabilities in preventing unearned runs from scoring. Why these data appear to suggest that that might be the case is likely due to the dependence of unearned runs on errors. That is, regardless of how good or bad a team’s pitching is, if the defense doesn’t make any errors, there won’t be any unearned runs scoring.
So, perhaps, instead of looking at unearned runs per game, we should really focus in on just the games where errors are committed. Here are the data for unearned runs per error (UR/E) split into Best, Average and Worst groups.
As expected, winning percentage improves as fewer unearned runs per error are allowed, but not by as much as was the case for unearned runs per game. What does this look like visually? First, for the AL.
And, for the NL.
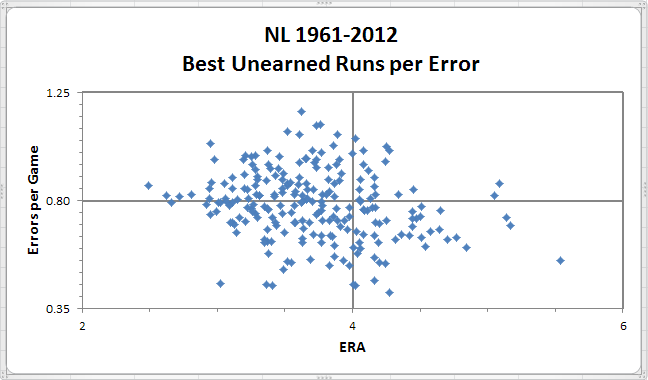
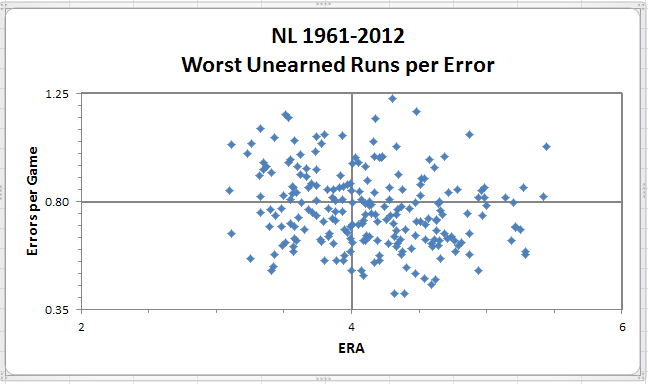
First off, the bee swarm is clearly more dispersed than with UR/G. Why is that? Mainly, it’s because not all errors are created equally. Errors may result in extra bases, extra outs, neither or both. Thus:
1. no extra outs, no extra bases. Example: dropped foul fly with bases empty and batter later retired
2. no extra outs, extra bases. Example: catcher throws ball into CF on stolen base attempt
3. extra out, no extra bases (other than batter). Example: booted grounder with bases empty
4. extra out and extra bases. Example: shortstop fields routine grounder and throws into dugout
In addition, the last 3 types have variants with runs scoring or not scoring on the play, such runs being (or becoming, based on future events) earned or unearned, but which cannot be defensed owing to their concurrence with the error event. Similarly, other runs (which, again, may be earned or unearned) may result subsequent to the play on which an error occurred, these being runs which could be defensed because they resulted indirectly from the error being committed.
But, I digress. The foregoing is an explanation for greater dispersion of these data compared to the UR/G data. However, the basic relationship of more errors = more unearned runs still holds.
So, what do these bee swarms tell us. Interestingly, they tell us pretty much the opposite story from the UR/G data. The movement of the swarm is primarily on the horizontal axis indicating that teams that have better pitching will allow fewer unearned runs per error, regardless of the defense behind them. That too makes sense since pitchers who are better at preventing earned runs from scoring will probably also do well at preventing unearned runs from scoring.
So what have we learned? Essentially, preventing runs from scoring, whether earned or unearned, is about good defense and good pitching (sorry if you read all this way expecting some totally non-intuitive conclusion). That being said, more focus on a pitcher’s run average is definitely warranted, particularly in view of the UR/E data.
While fun, this macro-level analysis has been just that:
- very high-level and visually based;
- using imperfect data (ERA, Errors) without context adjustment;
- and hoping that some general relationships can be inferred despite the limitations of the data and the analysis approach
In future installments, I hope to move on to identifying pitchers who perform better than others at preventing unearned runs. Just the other day, Adam identified one such pitcher in his post on Rick Reuschel.
In closing, here are the games with the most unearned runs scoring when no earned runs are allowed.
| Rk | Date | Tm | Opp | Rslt | IP | H | R | ER | BB | SO | HR | WP | BF |
|---|---|---|---|---|---|---|---|---|---|---|---|---|---|
| 1 | 1985-07-27 (1) | HOU | NYM | L 4-16 | 8.0 | 15 | 16 | 0 | 3 | 4 | 1 | 1 | 45 |
| 2 | 1990-07-22 | MIN | NYY | L 6-10 | 9.0 | 10 | 10 | 0 | 3 | 2 | 1 | 0 | 40 |
| 3 | 1945-09-10 (1) | CHW | WSH | L 4-10 | 8.0 | 11 | 10 | 0 | 4 | 1 | 0 | 0 | 41 |
| 4 | 1945-06-07 | BRO | NYG | L 5-10 | 8.0 | 7 | 10 | 0 | 7 | 4 | 0 | 3 | 44 |
| 5 | 1985-08-11 | OAK | SEA | L 6-9 | 8.0 | 13 | 9 | 0 | 3 | 2 | 0 | 3 | 42 |
| 6 | 1945-08-19 (2) | WSH | CLE | L 3-9 | 8.0 | 8 | 9 | 0 | 6 | 6 | 0 | 0 | 40 |
| 7 | 1932-06-07 | DET | NYY | L 2-9 | 9.0 | 8 | 9 | 0 | 6 | 5 | 0 | 1 | 43 |
| 8 | 1917-05-07 | PHA | NYY | L 4-9 | 9.0 | 7 | 9 | 0 | 5 | 4 | 1 | 0 | 41 |
| 9 | 2009-05-25 | HOU | CIN | L 5-8 | 8.0 | 13 | 8 | 0 | 5 | 8 | 0 | 0 | 43 |
| 10 | 2002-06-01 | CHW | CLE | L 4-8 | 8.0 | 6 | 8 | 0 | 4 | 5 | 1 | 1 | 35 |
| 11 | 1981-05-30 | HOU | SFG | W 9-8 | 14.0 | 11 | 8 | 0 | 2 | 8 | 1 | 2 | 59 |
| 12 | 1943-08-24 (2) | CHW | PHA | L 1-8 | 9.0 | 9 | 8 | 0 | 2 | 2 | 0 | 0 | 41 |
| 13 | 1941-07-25 | CHW | NYY | L 0-8 | 8.0 | 13 | 8 | 0 | 5 | 1 | 2 | 0 | 44 |
| 14 | 1940-08-22 | DET | BOS | W 9-8 | 10.0 | 10 | 8 | 0 | 4 | 5 | 2 | 0 | 45 |
| 15 | 1931-05-18 | NYY | DET | W 20-8 | 9.0 | 12 | 8 | 0 | 1 | 3 | 2 | 0 | 41 |
| 16 | 1928-07-25 | STL | BRO | L 1-8 | 8.0 | 10 | 8 | 0 | 3 | 3 | 0 | 1 | 36 |
| 17 | 1923-09-10 | CIN | PIT | L 0-8 | 9.0 | 7 | 8 | 0 | 6 | 2 | 0 | 0 | 41 |
| 18 | 1922-09-08 | SLB | DET | L 3-8 | 9.0 | 13 | 8 | 0 | 2 | 5 | 2 | 0 | 42 |
| 19 | 1922-08-02 | SLB | PHA | L 4-8 | 9.0 | 13 | 8 | 0 | 2 | 10 | 3 | 0 | 41 |
| 20 | 1920-05-20 | SLB | NYY | L 3-8 | 8.0 | 10 | 8 | 0 | 3 | 4 | 0 | 1 | 41 |
Pretty neat trick that the Astros pulled off in game 1. Allow 16 runs and all your pitchers lower their ERAs.
Doug:
Did you get a government grant for this study? Eating More Makes People Fatter. Pollution in Lakes Contaminates Fish.
Bad Fielding Causes More Unearned Runs.
Seriously—meaning that the above paragraph was a joke—although you probably won’t get very much response for your hard work here, I think this is one of the best and certainly the most incontrovertible posts of its type ever on HHS. It shows how raw stats should be presented.
But, of course, I’m no statistician.
Thanks, nsb.
I’ve been stewing on this piece for a while. Not sure where to go next with it, if anywhere.
But, Adam’s piece on Rick Reuschel gave me an idea or two, so thought I’d just post what I had to see if other readers might also provide an idea or two.
In that May 18th, 1931 game between NY and Detroit, both teams gave up 8 unearned runs. The Yankees also scored 12 earned runs so they obviously won the game.
So is the 16 unearned runs combined the most ever in which each team gave up at least one unearned run?
I checked the 8-25-22 game won by the Cubs over the Phils 26-23. The Phils gave up 12 unearned runs and the Cubs gave up 7, making a total of 19. I don’t know if that is the most ever. I haven’t figured out a way to use the PI to determine the most unearned runs given up in a game by both games.
“by both teams” not both games.
And on 4-14-25 the Browns and Indians combined for 17 unearned runs.
Thanks Richard! I looked through some high scoring games but couldn’t find anything that beat those two.
And several weeks later on 7-2-25 the Braves and Robins combined for 17 unearned runs.
In that 20-8 Yankees win on 5-18-31, former Yankee shortstop Mark Koenig pitched an inning against his former club. Alas, it did not turn out well for Mark, allowing 5 runs on 2 hits and 5 walks. But he did strike out one!
And unfortunately all of the runs Koenig gave up were earned. One of his fielders should have had the decency to commit an error behind him. 🙂
A bit more on Koenig’s pitching career.
He first pitched in a game on September 18, 1930, throwing two scoreless innings. This led to him getting a start 9 days later! I guess the Tigers figured why not? It was the next-to-last day of the season and they were 27 games out of first. Koenig gave up 6 runs in the first inning, held the White Sox scoreless for the next 5 innings, then gave up 4 more runs in the 7th. He finished with a line of 7 innings, 10 hits, 10 runs (all earned!), 6 walks and 6 srikeouts.
The next game he pitched in is the one Doug referenced above. He pitched again on July 27, 1931, holding the Red Sox scoreless for 2 innings. He finished his pitching career on Sept. 22nd, 1931, throwing 4 scoreless innings. Pretty impressive given that he gave up 3 hits, walked 6 batters, and only struck out one, in those four innings.
Here’s a couple more extreme UR games.
7-7-1923, Indians 27, Red Sox 3 – 18 unearned runs, all by Cleveland
8-8-1954, Dodgers 20, Reds 7 – 12 unearned runs for Brooklyn on one Cincinnati error, all scored after an intentional walk with two out and nobody on base
Doug, if I understand you correctly, then you are saying RA can basically be used to confirm what we think we know from ERA. That is to say, a pitcher with a low ERA would also have a decent RA if he truly is a good pitcher and not just “lucky” somehow. I’d be interested to see what you find not just with pitchers who excel at preventing unearned runs, but also those whose RA significantly exceeds their ERA.
The answer, RJ, is I don’t know. That will be part two. I am encouraged, though, that the UR/E data, while having a fair degree of dispersion, is not a completely random collection of data points – a pattern is discernible (at least to me) that suggests there’s more than luck involved.
Adam’s piece on Rick Reuschel suggests the answer is yes, and he also used a method which, with some work (sigh!), ought to be do-able generally (i.e. not just for a specific pitcher).
So, borrowing shamelessly (thanks Adam), I think that’s where I’ll probably head next with this.
I think Doug you can be a little more conclusive given your work. It looks that ERA and RA are almost directly proportional. Both are affected by defense relatively equally. Using either should give similar results. That said, the sampling size of a pitcher’s career is too small a sampling size. They just don’t have enough errors behind them over the course of their career to have the data even out. I would imagine guys who pitch longer careers it’s easier to see but they will most certainly have a better ERA and RA than your average pitcher as well.
So I would be more of the “ERA or RA, as long as you’re consistent it doesn’t matter terribly which you use. Both need to be adjusted for defense” side of things.
I think that this was important to lay the groundwork for what you’re talking about doing- which seems to me is establishing wether or not there is such a thing as a “clutch” pitcher.
Right, Hartvig.
Nothing earth shattering here in terms of conclusions. But, there may be enough evidence here to suggest that some pitchers may be better than others at overcoming misfortune rather than being victimized by it.
But, we’ll have to see after the next instalment.
I would approach that more on an RE24 based strategy, looking at pitchers who routinely pitch well out of higher run scoring probability RE24 situations. That would be “clutch” run prevention, not to be confused with “clutch” win percentage pitching (a la Jack Morris) which is an entirely different equation.
I am embarrassed to even comment here after that wonderful post. Thanks for the effort. I wish I had an actual contribution.
All I have to say is that is has always bothered me (and everyone else I am sure) when a pitcher would have bad luck with a 2-out error behind him but then give up 5 Unearned Runs after that. I always wished there was a way to count some of that against him.
Thanks for reading.
The thought I have for the situation you describe (runs scoring with two outs, after extra-out error), is to use expected future runs in inning from the initial two-out state (this would be a fraction of one run for all bases-occupied states). If the pitcher escapes unscathed, he earns those expected runs as “error runs saved”. If the floodgates open, all the runs (other than those resulting directly from subsequent errors) in excess of the expected runs are charged to him as negative error runs saved. If there are subsequent errors, then the “errors runs saved” are reset based on the new bases-occupied state, and the pitcher can earn or be charged with additional “error runs saved” starting from that point.
Note that this would only apply to runs scoring AFTER the initial two-out state in an extended inning. Any unearned runs scoring prior to or on the play where the second out was made are not included in the “error runs saved” count.
Will have to check and see if there have been amendments to the rules of scoring since 1985, because it’s pretty clear some of the Mets’ runs in that game are earned.
Do you think so?
Here’s my take.
– 3rd inning: runner advanced one base on error, at third with one out & scores on single, followed by double-play to end inning. Explanation: scorer ruled runner would not have scored from second on the hit
– 5th inning: leadoff hitter ROE and scores; two following runs score after two out
– 7th inning: second hitter ROE; first run scores on 2nd out play (what should have been 3rd out), 5 more runs score after two out
– 8th inning: leadoff hitter ROE; 6 runs score after two out
Scoring looks okay to me.
I agree Doug. The only run that confused me was Backman scoring on a wild pitch. Then I realized that there “should” have been 3 outs in the inning already; therefore, Backman’s run was considered unearned.
The “all runs after an error” only applies if the error is made on a play which would have resulted in the third out of the inning.
Before two outs, only the run(s) which scored as a direct result of the error are unearned.
Before two outs, only the run(s) which scored as a direct result of the error are unearned.
Not exactly sure what you mean by “direct”, but I don’t think that’s the case, Chuck.
Here’s a game from last year. Look at the top of the first inning.
http://www.baseball-reference.com/boxes/PIT/PIT201209070.shtml
– runner on first with one out
– batter hits a grounder to second baseman, who commits an error, and everybody is safe
– next batter singles and the lead runner scores from second
– two more groundouts end the inning
Run was ruled unearned. But, the runner scoring did not reach via an error and there was only one out. So why was his run unearned?
I don’t know. I’m supposing that the error on the second baseman was in attempting to retire the lead runner at second, though there is no throw mentioned in the PBP. Perhaps, he was clearly intending to throw there and the ball slipped out of his hand.
In any event, there were less than two out, the scoring runner had not reached base via an error, and no runs scored directly as a result of the error. But, it was still unearned.
Incidentally, the one-out single that scored the runner from second was an infield hit. More curious still.
“Run was ruled unearned. But, the runner scoring did not reach via an error and there was only one out. So why was his run unearned?”
Without the error, he wouldn’t have scored.
@28 “Without the error, he wouldn’t have scored”.
I don’t think that is necessarily true.
Theoretically…
The run would be “earned” (could have reasonably scored anyway) if the 2B could not have gotten the lead runner (i.e. hit and run, or ball hit deep into the 1B hole) and the runner would have been on second base with OR without the error. He would have then scored on the ensuing single.
But it would have been “unearned” (probably would not have scored) if the runner could have been retired at 2B.
The reason I use quotes around “earned” and “unearned” is because I am not sure if the official scorer makes that judgement call (if the fielder could have gotten the runner at 2B or not).
Here are the scoring rules for unearned runs. I believe the case cited by Doug in #27, is covered by the second bullet.
http://en.wikipedia.org/wiki/Earned_run#Unearned_run
Is there some latitude with scoring decisions?
Yes.
But not much, how the play unfolds still makes 99% of any decision.
If the error was made by the 2B on an attempted force play, then there is no question.
If the error was made by the 2B on a fielding play, then there is no question.
If the error was made by the 2B on an attempted play at first base, then there MAY be room for question, which would be determined how the play unfolded.
There are a number of different scenarios that could play out, certainly too many to list here, but the rule of thumb to follow would be the intent of the defensive player.
If he chose to make a play at first, or if his only play would have been to first, then the error would have resulted in his making a “fielder’s choice”, which is how the runner reached second.
The runner then would be determined to have reached second not by the error, but by the decision of the fielder, and a subsequent run would then be earned.
Doug assumed in his post the 2B was making a play at second, which I concur with, and which would clearly make “reaching” a direct result of the error.
And, thus, his run is unearned.
Just thought of something else.
If the error by the 2nd baseman was in attempting (or intending) to retire the lead runner at 2nd, then surely the batter would have reached on a FC.
But, the PBP says the batter reached 1st on the error and the runner moved up to second. Which makes it sound like a muffed fly ball (popped up bunt, soft liner) that gets away to allow the advance to 2nd. So, if that play is made, runner stays at first, and does not score on the following single or subsequent groundout.
Must have been something like that.
Very nice work, Doug!
To your first two graphs, it’s interesting that UR/E did not rise during the ‘90s; if anything, it fell. All else being equal, I would expect that an error committed in a high offense environment would translate to a higher probability of unearned runs being scored. But not all else is equal. Is it possible that the increasing strike out rate is responsible for the falling UR/E trend?
To your last six graphs, I’m confused. If you’re considering only games in which errors were committed, how do you have E/G rates less than 1? Am I misinterpreting?
Thanks Brendan,
My remark about looking only at games with errors committed was meant to convey the idea of looking at such games implicitly. Thus, UR/E over a season is implicitly only counting games in which errors were committed. Thus, the games with no errors committed are not relevant to UR/E the way they were relevant for UR/G.
Hope that’s clearer.
As to the effect on unearned runs from a high strikeout environment, I would be inclined to think there would be an effect in that runs will not score via a strikeout they way they might via other outs. Similarly, strikeouts will also not result in errors committed fielding balls in play. So, probably both the numerator and denominator are reducing and, from the trend line, it would seem the numerator is reducing more.
Doug — Great post on an important subject. The pitcher’s job is to prevent runs, period, and as you have shown , there is a lot that a pitcher can do ,usually , to minimize the impact of errors. Of course there is a large element of luck involved, since an outfielder dropping a fly ball with a man on third will result in an unearned run, no matter who is on the mound ; still, over periods as long as a career, there are notable differences between pitchers .
for some anecdotal evidence supporting your conjecture @25, I divided the Champion Tigers into high-strikeout and low strike out pitchers by ranking them by SO/9, and then including approximately 50% of IP in each group. The tigers as a team allowed 74 UER , with the high-strikeout guys allowing 26 of them in 722 innings, while the low strikeout guys allowed 48 in 708 innings, pitching in front of the same defense. Just one data point, and of course the Tiger’s top two high-strikeout guys, (Verlander, Scherzer) are just good.
my conjecture
UR/Error varies by the skill of the pitcher , given enough time for the luck to even out
better pitchers allow fewer UER
If two pitchers are equal in ability , the high strikeout guy will tend to allow fewer UER
therefore RA9 is a more reliable indicator of pitching ability than ERA (WAR agrees with this )
The Mets Astros game box score is disgusting. The Astros scored 4 runs while committing 5 errors. Yet Randy Bass did get an OF assist.
Pingback: Masters and Victims: Pitchers and Unearned Runs – Part 2 |