
In Part 1, we saw that whatever correlation had existed between no-hitters and strikeout rates was broken in the last 20 to 30 years. But why?
I can’t study that question in depth, but we can dip a toe in the water by starting with a simpler question: What basic measure would we expect to show the strongest correlation to no-hit rates?
It has to be batting average, right? Both are measuring the same things: how many hits, out of how many chances. No-hitters are subsets of the events that make up batting average.
And, no surprise, we do see such a correlation. The next graph is essentially the same as the last one in Part 1, with the bars again showing no-hitter rates in rolling 5-year averages — but now the red line shows batting average, instead of strikeouts. The BA is graphed against the right axis, with the values inverted, to show the inverse correlation: When batting average goes up, no-hitters go down.
No-Hitter Rates and Batting Averages (Inverted), Rolling 5-Year Avg., 1920-2012
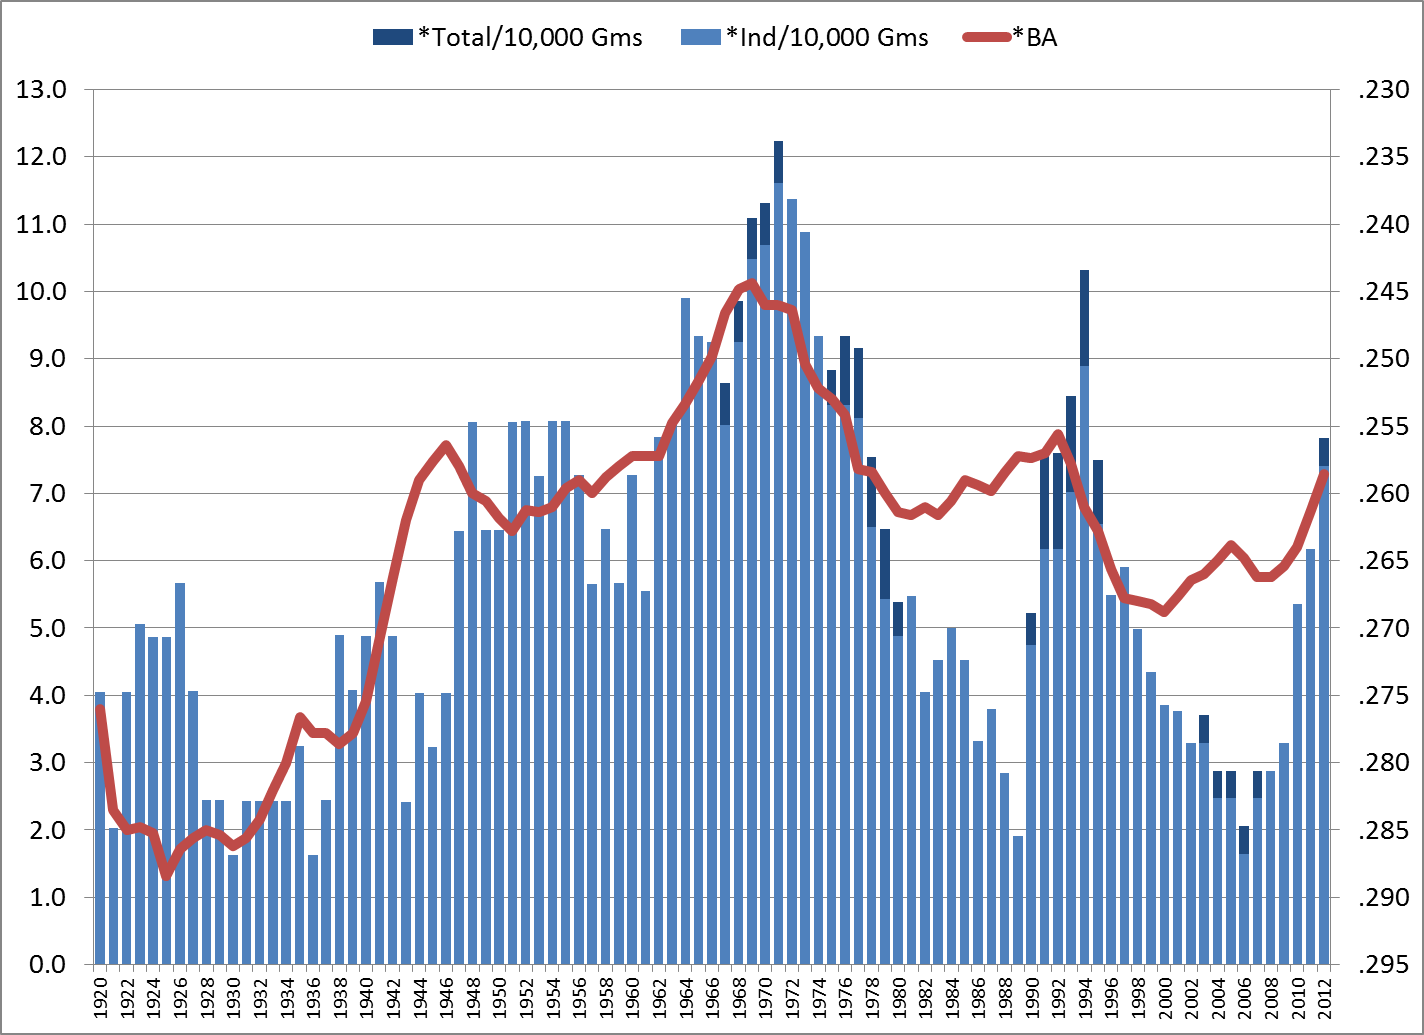
This starts out a lot like the no-hit/K-rate graph. But while the K-rate correlation crashed somewhere in the 1980s/’90s, the BA correlation staggers but stays on its feet.
And this brings up the unstated assumption behind the original theory that no-hitters correlate with K rates:
- “Strikeout rates inversely correlate with batting averages.”
It’s a natural assumption, and it was true for most of the live-ball era, at least. But a dramatic change occurred for several years in the 1990s: While K rates went up and up, batting averages also went up and up. The next graph tracks batting averages (still the red line, with values inverted) and strikeout rates (now the blue bars):
Strikeout Rates and Batting Averages (Inverted), Rolling 5-Year Avg., 1920-2012
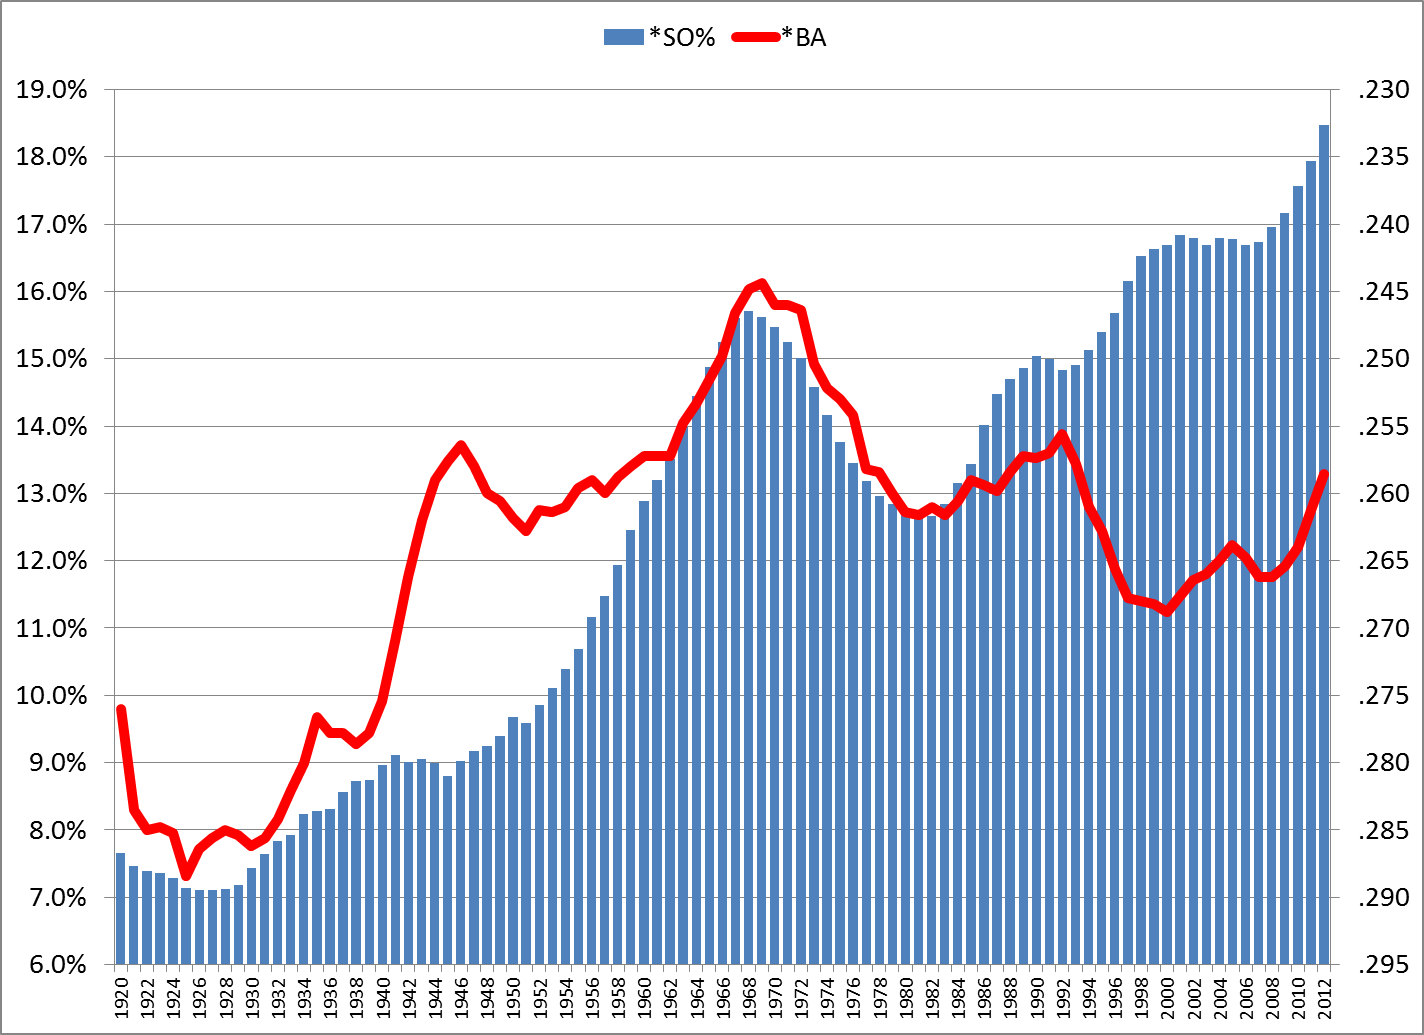
That’s a clear correlation from about 1920-90, especially strong from the late ’50s onward. But there’s a huge divergence in the ’90s.
Now, if we focus the graph on the later period, adjust the scale, and use the yearly data instead of 5-year averages, it seems possible that batting average and strikeouts have linked up again, just at a different level:
1991-2012, Strikeout Rates and Batting Averages (Inverted), By Year
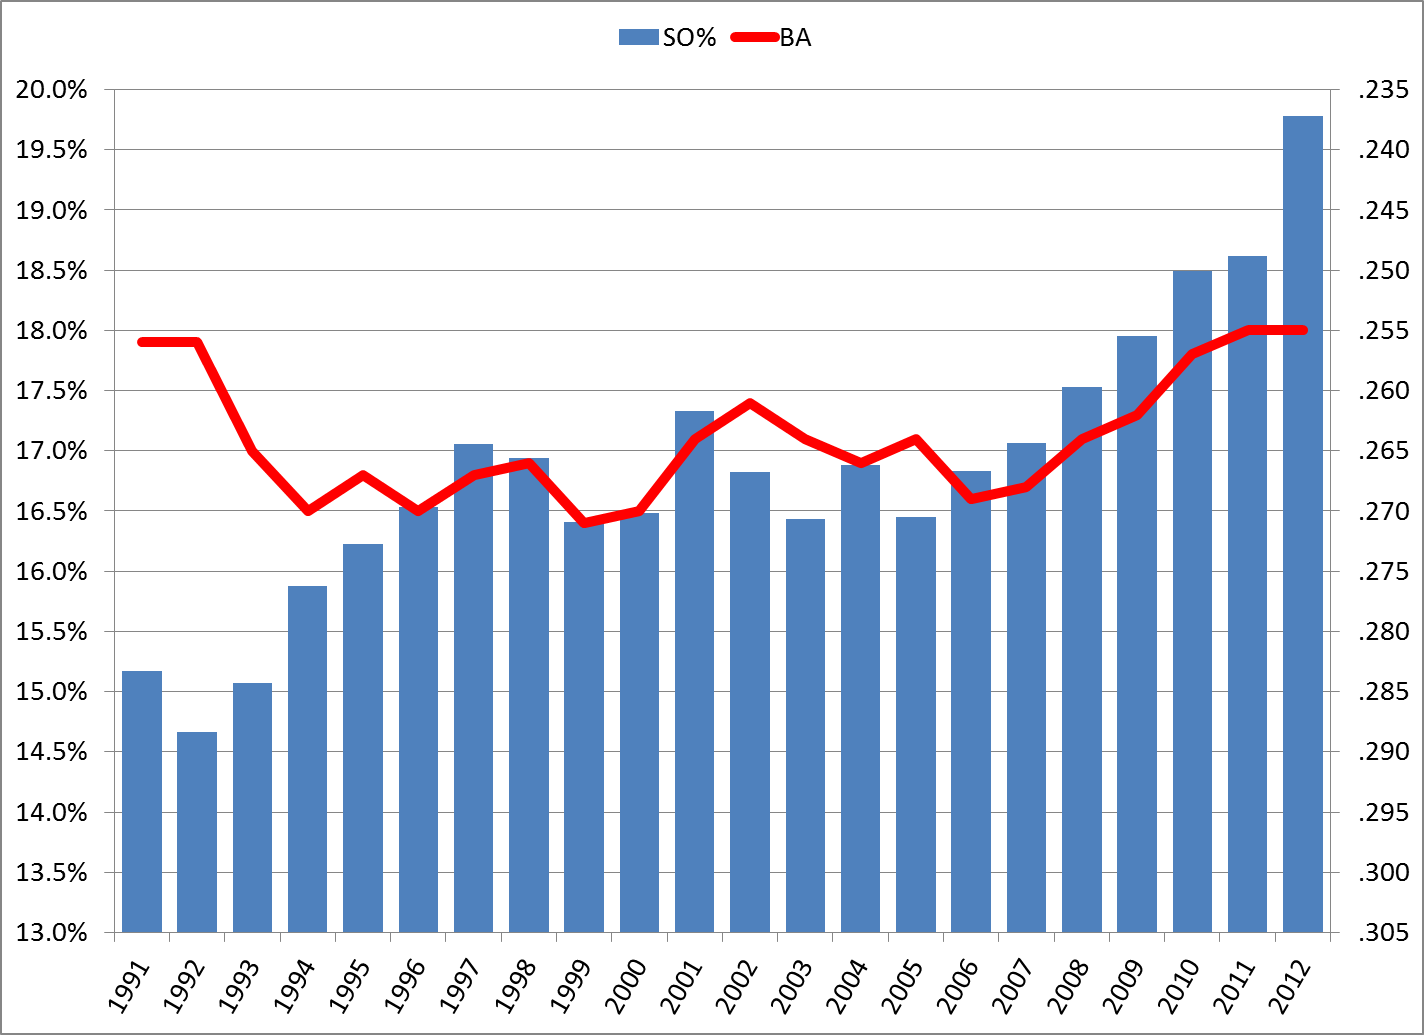
There are suggestions here, but beware of overanalyzing small changes in small samples:
- In each year from 2007-11, BA and K rates show the expected inverse correlation. But in 2012, despite one of the biggest yearly changes in K rate, BA remained flat.
- Most of the years since 1999 showed the expected correlation.
The recent data are open to interpretation. I think more time is needed to conclude a return to correlation.
But let that play out on its own. What I find most interesting is this: We now have historically normal batting averages, despite unprecedented strikeout rates:
- From 1946 through 1992, the average K rate was 13.3%, the average BA was .256.
- From 2010 through 2013/5/25, the average K rate soared to 19.2%, but the average BA was .255,
That’s a 45% increase in strikeouts, with virtually no change in batting average.
“Swing hard, in case you hit it”
If strikeouts are up, why is BA flat? Obviously, more batted balls are getting through the infield and falling in the outfield.
Consider batting average on batted balls (BAbb) — that is, for all at-bats except strikeouts. (So this is not BAbip, which also removes home runs from the equation.) From 1946 through 1992, BAbb was between .289 and .312 every year but one, averaging .301. In 1993 it shot up to .319, and has not dipped below that since, averaging .328. Last year’s BAbb was .327.
The only logical explanation for the rise in BAbb is harder hitting — unless you think this is a golden age of hit-and-runs and place-hitting, or that the data-driven changes in defensive positioning have somehow backfired.
Anyway, it seems clear that they’re swinging harder, on average, based on the swing-and-miss rate and on eyeball observation. And they’re swinging harder because of broad changes in playing conditions, compared to historic norms, that increase the relative value of hard hitting versus contact hitting. The central changes are:
- Improvements in defensive conditions (individual ability, strategic positioning, the quality of playing fields and fielders’ gloves), which reduce the value of soft contact; and
- The shape of modern bats, which concentrate weight in the barrel and thus reward hard swings. Increasing swing velocity with these bats produces a larger gain in momentum at the point of impact, compared to a similar change in swing velocity with a conventional bat.
This “swing hard” approach also includes taking more pitches that are outside the power zone, and all of it together naturally produces more strikeouts, which tends to reduce batting average. But the harder-hit balls are more likely to become hits, which roughly offsets the effect of the strikeouts.
Conclusion
Only time will tell where the relationship of strikeouts, batting average and no-hitters will go. Conditions are always changing, and there are more factors than were mentioned here.
But in simple terms, the sharp rise in strikeouts has not brought a rise in no-hitters mainly because it has not lowered the batting average. The average BA for the high-strikeout era of 1986-2012 is .263. The average BA for the rest of the live-ball era (1920-85) is .264. And it is hits, not strikeouts, that have the biggest impact on no-hitters.
Now, if you have any theory why no-hitters have actually declined in this era, let’s hear it!
Postscript
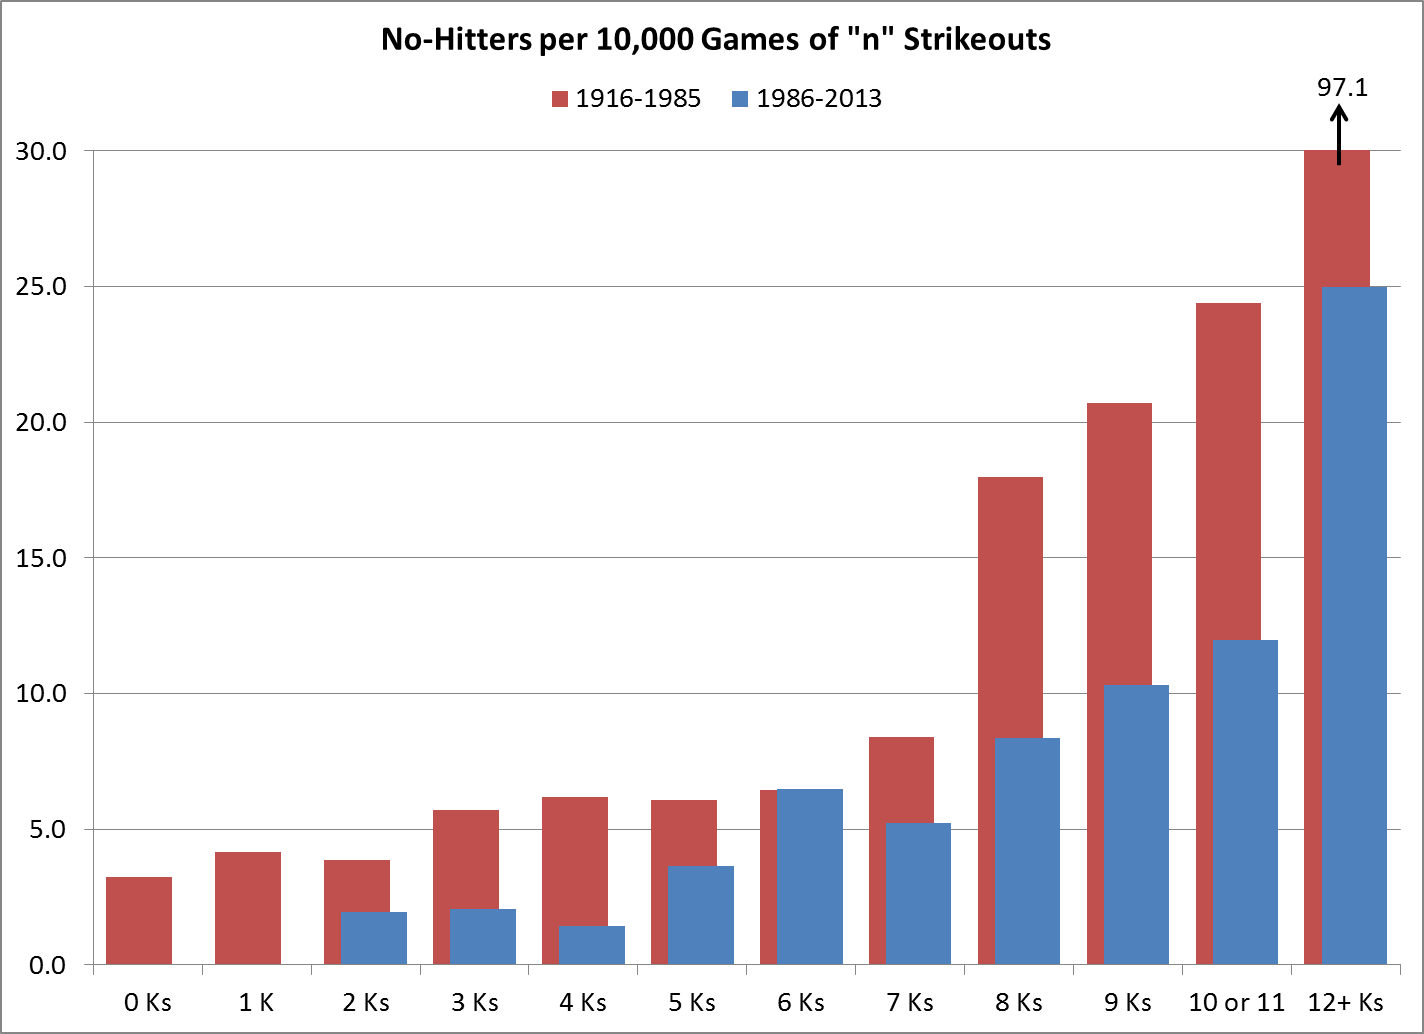
For our friend “nsb”, I’ll post this one more graph that’s on a tangent from the main subject, focusing on the game level. This shows the no-hitter rates for each strikeout total — e.g., out of all games with 5 strikeouts, how many were no-hitters? I broke it down for 1920-85 and 1986-2012, and again the rates are per 10,000 games. One thing I find interesting here is that very-high K games, 12+ strikeouts, were far more likely to be no hitters in the previous era than they are now. I’ll leave the interpretation to you.
One comment. “The only logical explanation for the rise in BAbb is harder hitting — unless you think this is a golden age of hit-and-runs and place-hitting, or that the data-driven changes in defensive positioning have somehow backfired.”
I don’t think this is the ONLY logical conclusion. I think it’s the right one. But if someone were to argue that the high-scoring era of the 1990s brought more bat-first fielders, and therefore those fielders were consequently worse at turning what (relatively few) batted balls there have been into outs, I wouldn’t necessarily begrudge them that opinion. For example, Mark McGwire is not exactly Keith Hernandez. Yes, I understand that’s a false dichotomy. But I haven’t studied the issue enough (nor would I know HOW to do such a thing) to see whether the defensive range of players has really changed in any significant way since a bygone era. So that may be a partial cause, though I doubt it. Still, it at least presents one possible alternative to your theory which is at least, to some extent, plausible.
Dr. Doom – Good criticism there. Definitely a plausible alternative.
Just a side note: Astros batters are now averaging 1.16 strikeouts per hit, and the Mets are averaging 1.14 strikeouts per hit. The highest full season strikeout per hit ratio (at least since 1916) for a team’s batters is Arizona’s 1.12 in 2010. Nine teams since 1916 have had more Ks than hits by their batters over a full season: the Brewers in 2001, the D’backs in 2010, three teams in 2011, and four teams last season. Currently there are five teams with more Ks than hits by their batters over the 2013 season.
I thought it might be interesting to look at all the perfect games thrown since the beginning of the 20th Century. It’s obviously too small a sample size to be particularly meaningful, but since I’d always heard “conveniently wild” growing up, I wanted to check. Clearly, there’s more than one way route towards perfection, although K’s certainly don’t hurt. The overall average is slightly higher than 9 per game.
Name Date Strikeouts
Cy Young (5/5/1904) 8
Addie Joss 10/3/1908 3
Chas Robertson 4/30/1922 6
Don Larsen 10/8/1956 7
Catfish Hunter 5/8/1968 11
Len Barker 5/15/1981 11
Mike Witt 9/30/1984 10
Kenny Rogers 7/28/1994 8
David Wells 5/17/1998 11
David Cone 7/19/1999 10
Mark Buehrie 7/23/1999 6
Dallas Braden 5/9/2012 6
Phil Humber 4/21/2012 9
Felix Hernandez 8/15/2012 12
Jim Bunning 6/21/1964 10
Sandy Koufax 9/9/1965 14
Tom Browning 9/16/1988 7
Dennis Martinez 7/28/1991 5
Randy Johnson 5/18/2004 13
Roy Halladay 5/29/2010 11
Matt Cain 6/13/2012 14
Mike L, that is an interesting list. I played around a bit with the “Ks in no-hitters” angle while I was drafting, but I couldn’t fit it with the larger theme. I am curious whether there’s any difference in average Ks between no-hitters and perfectos, but the latter’s a very small sample. Maybe I’ll come back to it.
P.S. Seeing Mike Witt’s 10 Ks, I discovered that I’d forgotten what a strikeout pitcher he was in his prime, averaging over 190 for a 4-year span.
From 1916-2013 there have been 20 perfect games (including Larsen’s) with a total of 181 SO, or 9.05 SO/G. In that time span there have been 183 no-hitters, exclusive of perfect games, with a total of 1218 SO or 6.66 SO/G. I hope I got those numbers right.
JA:
A third central change in playing conditions leading to hard swinging might simply be that far more of the pitches are thrown at greater velocity. The nanoseconds to react are fewer and the response is, possibly has to be, greater bat velocity. This is no theory, just a thought.
Thanks, by the way, for the mention. It goes on my resume.
nsb — Excellent suggestion. I don’t know how far back the velocity stats go; I haven’t really paid attention to pitch/FX stuff, though I guess I should. Anyway, your theory (thought) could well be true.
Somewhere- and whether it was the 1st or 2nd HBA or one of the yearly editions I have no idea- Bill James made the argument that because of the re-emmergence of the stolen base in the 60’s a lot of pitchers were taught to significantly tone down their wind up or to nearly eliminate it altogether and thus the speed with which pitchers are throwing now could not have been as fast as it was in the 30’s, 40’s, 50’s & early 60’s.
And I think it’s certainly true that you no longer see many pitchers using the big windmill motion or huge leg kicks that they many were doing when I first started watching baseball in the early 60’s but whether that translates into slower pitches I can’t really say.
Not questioning the idea, but why wouldn’t athletic ability improve linearly across the scale; you can throw harder but reaction time is faster as well?
Mike L — I’m no expert on physiology, but I think that reaction time would have a lower ceiling of improvement, being partly dependent on the optic and nervous systems. Seems like the factors in throwing (including mechanics) would have more room for growth.
When someone tries to get me to be part of a community, I move.
Timmy, I can neither (a) figure out what this is a reply to, or (b) stop laughing. 🙂
Timmy: You are now a member of the HHS top commenters, moving into 15th place. Welcome aboard.
John, This is a wonderful piece of research and reasoning. I actually read the first part before any comments had appeared and felt utterly unworthy to try to formulate an initial response – happily, since Doug did such a good job of it.
The conclusion you’ve reached concerning BAbb bears, I think, on an overworn discussion we had last summer about “luck,” when Jim Bouldin was contributing and leading a small anti-luck contingent that wore out its welcome. It seemed in that discussion that most contributors held the belief that the hit/out outcomes of balls in play were, in most cases, better described as matters of luck than as a residue of skill differentials among pitcher, batter, and fielder (I’m simplifying a range of views, but they appeared to me to lean in the direction of “three-true-outcome“ conclusions about fair measures of pure skill). The conclusion I’m drawing from your new analysis is that the adoption of a slightly different skill set by batters may be changing the balance of outcomes on routine balls in play – or, adopting the Devil’s advocate argument of Dr. Doom, the changed balance may be due to different skill mixes among fielders. In either case, skill change has affected “luck,” which suggests that “luck” may have not have been the best explanatory concept, at least to that degree.
Interestingly, although the outcomes of BAbb and K’s are comparable in impact on your model, the K’s that balance the increase in BAbb would probably not be ascribed to luck on any account, since K’s are generally viewed as hitter/pitcher skill contest “true-outcomes” – so the rise in BAbb really means a net decrease in baseball “luck,” for those who believe in any but the most parsimonious theories of luck.
Thanks, epm. And kudos for finding an original angle on the data; I had not thought of it in that way, and now I will.
Excellent piece(s) John. Coherently and convincingly argued as always.
It’s almost like cheating using batting average to correlate against no-hitters. It’s pretty clear they are directly correlated. Substantial changes in the league average would directly relate to changes in the rate of no-hitters.
I also think you are completely accurate in your discussion of how hitting has changed. Batting average and strikeouts are not correlated any longer, though the once were.
I don’t think fielders are worse than they used to be. I think they are far better than they used to be on average.