
No, not that Shrek. This one is catcher Ossee Schrecongost (I ran into Ossee in my last quiz, by dint of his 3 qualifying seasons with matching HR and triples: one with deuces; and two with singletons). Ossee played around the turn of the 20th century (and happily also went by the shorter “Schreck”). As I scrolled down his player page, I was struck by this:
So, six straight seasons leading AL catchers in putouts (i.e. mostly catching his pitchers’ strikeouts) despite ranking mostly in the middle of the pack in games caught (excepting his one season leading the AL, Schreck played between 16 and 29 games fewer than the catcher placing first in games caught).
More on strikeout-dominant pitching staffs after the jump.
Schreck played those seasons for Connie Mack’s Athletics, who indeed sported some outstanding pitching staffs, led by HOFers Rube Waddell, Eddie Plank and Chief Bender. The Athletics led the AL in strikeouts for 9 consecutive seasons, starting in 1902. Note, though, that it wasn’t just their HOFers putting up the high strikeout totals, as can be seen from the list below (success does breed imitation, it would seem).
| Rk | Player | IP | From | To | Age | G | GS | CG | SHO | GF | W | L | BB | SO | ||||||
|---|---|---|---|---|---|---|---|---|---|---|---|---|---|---|---|---|---|---|---|---|
| 1 | Eddie Plank | 2655.2 | 4.66 | 1.99 | 1.096 | 1902 | 1910 | 26-34 | 339 | 314 | 257 | 36 | 20 | 185 | 118 | .611 | 586 | 1375 | 2.29 | 120 |
| 2 | Rube Waddell | 1869.1 | 7.59 | 2.38 | 1.062 | 1902 | 1907 | 25-30 | 251 | 212 | 168 | 37 | 29 | 131 | 82 | .615 | 495 | 1576 | 1.97 | 146 |
| 3 | Chief Bender | 1799.0 | 5.45 | 2.05 | 1.056 | 1903 | 1910 | 19-26 | 251 | 201 | 172 | 24 | 47 | 125 | 76 | .622 | 409 | 1090 | 2.32 | 114 |
| 4 | Jack Coombs | 1017.1 | 4.99 | 3.40 | 1.151 | 1906 | 1910 | 23-27 | 147 | 115 | 86 | 26 | 25 | 66 | 44 | .600 | 384 | 564 | 2.05 | 122 |
| 5 | Jimmy Dygert | 986.0 | 5.32 | 3.50 | 1.198 | 1905 | 1910 | 20-25 | 175 | 105 | 62 | 16 | 49 | 57 | 49 | .538 | 383 | 583 | 2.65 | 97 |
| 6 | Weldon Henley | 665.2 | 4.03 | 2.84 | 1.196 | 1903 | 1905 | 22-24 | 90 | 74 | 57 | 7 | 15 | 31 | 38 | .449 | 210 | 298 | 2.93 | 95 |
| 7 | Andy Coakley | 530.2 | 4.51 | 2.71 | 1.229 | 1902 | 1906 | 19-23 | 74 | 61 | 43 | 5 | 12 | 31 | 23 | .574 | 160 | 266 | 2.51 | 110 |
| 8 | Cy Morgan | 519.1 | 3.73 | 3.26 | 1.067 | 1909 | 1910 | 30-31 | 64 | 60 | 44 | 8 | 2 | 34 | 23 | .596 | 188 | 215 | 1.59 | 150 |
| 9 | Rube Vickers | 423.0 | 4.30 | 2.17 | 1.111 | 1907 | 1909 | 29-31 | 81 | 41 | 25 | 7 | 31 | 22 | 23 | .489 | 102 | 202 | 2.51 | 101 |
| 10 | Harry Krause | 346.1 | 5.43 | 2.47 | 1.054 | 1908 | 1910 | 19-21 | 52 | 34 | 27 | 9 | 12 | 25 | 15 | .625 | 95 | 209 | 1.95 | 124 |
Philadelphia logged three pennants (incl. one WS title) and three 2nd place finishes in those 9 seasons, plus a 2nd WS title in 1911 when the As finished just a handful of strikeouts behind the White Sox staff.
How often has a team led its league in strikeouts for 5 or more consecutive seasons? Possibly more than you might think. Here’s the list.
[table id=171 /]
.
As with the Athletics at the beginning of the 20th century, a good number of the teams on this list were league champions. But, long streaks leading the league have become much less common, obviously because there are more teams, but also because of free agency and the ability of just about every team to be buyers in that market when they want to.
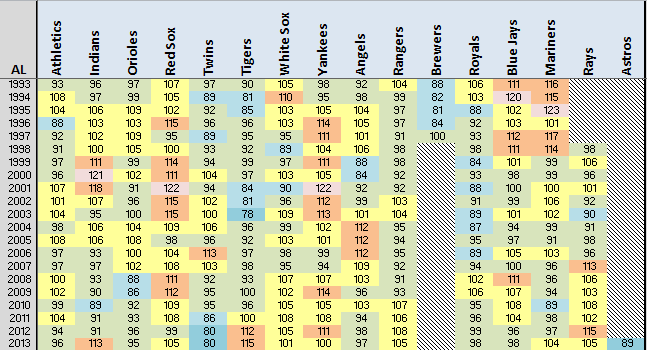
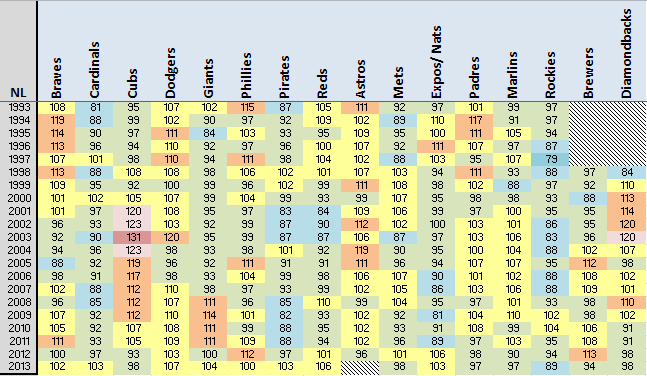
How has your team fared? Here are the rankings by season, since 1901.
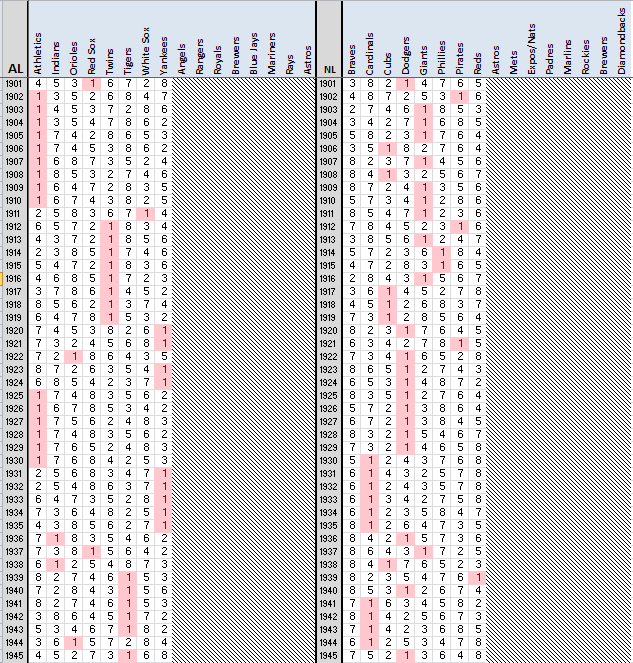
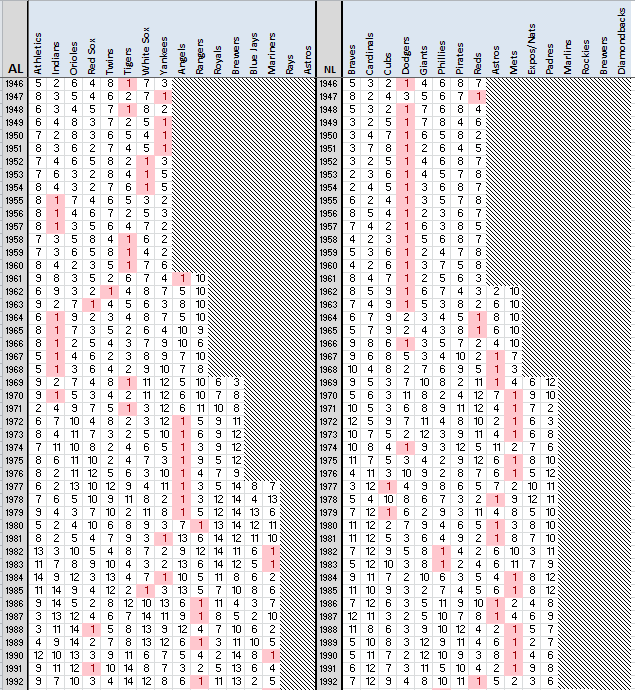
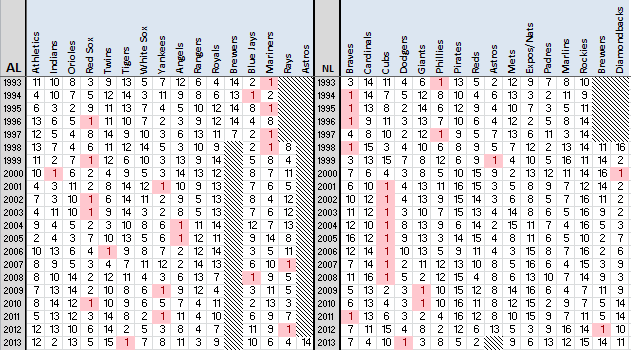 But rankings can be deceptive. They don’t tell you by how much a team led its league. To look at that question, I’ve calculated K/9+ for each team and season, being 100 * (team K/9 divided by league K/9). Those results are color-coded from lowest to highest ratings in blue-green-yellow-orange-pink-red order.
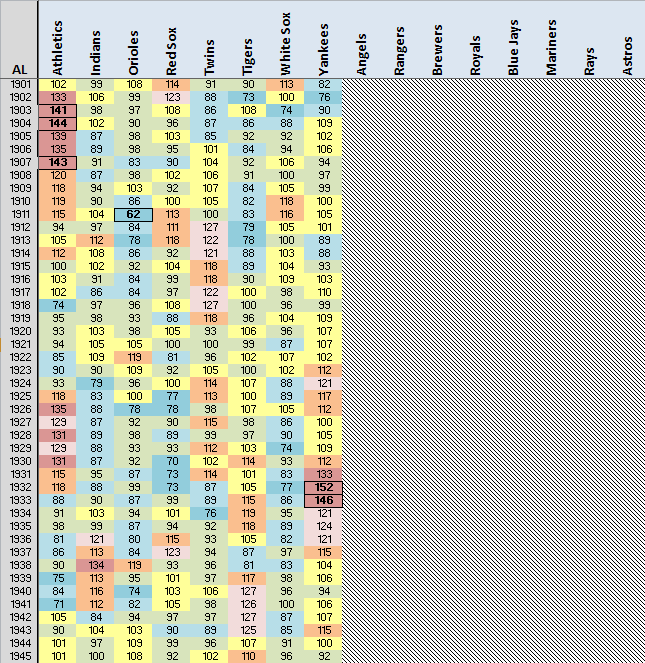
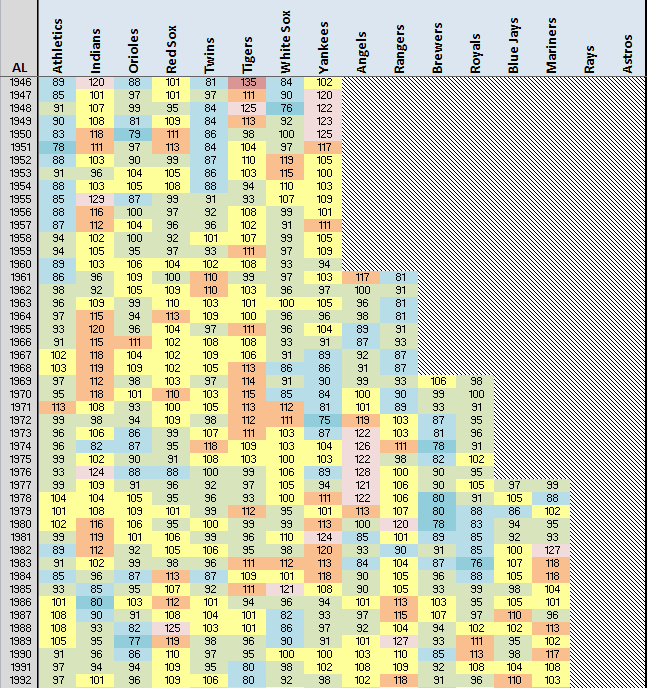
 It’s not for nothing that old Schreck led the league in putouts every year. His Athletics dominated the league in strikeouts as no other AL team has since. But, how do those Athletics compare to the post-war Dodgers and their 16-year run leading the senior circuit.
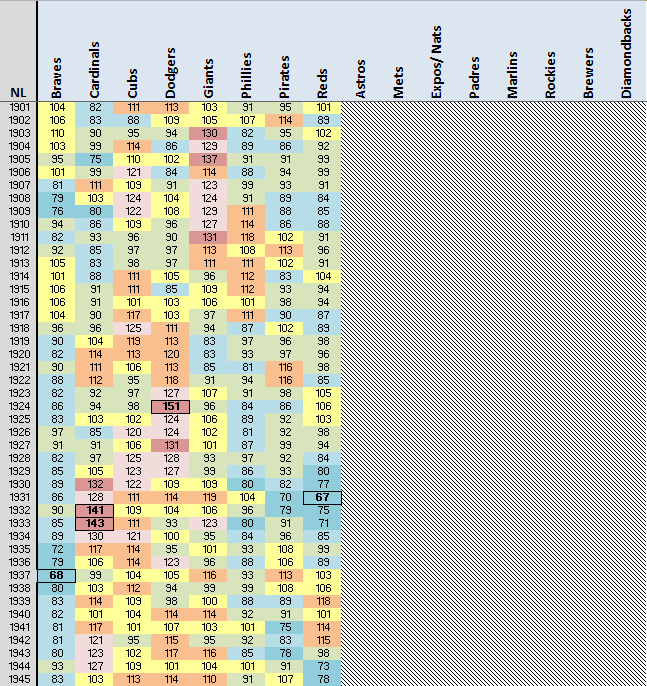
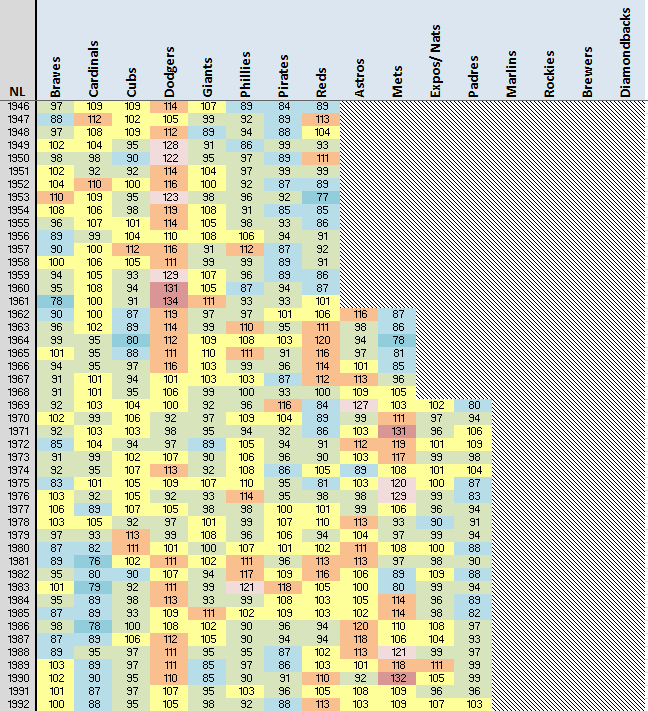
 Actually, those early Athletics teams compare very favorably. Despite 16 years leading the NL, the Dodgers look quite pedestrian in comparison.
Incidentally, if you’re wondering what happened to the red that stood out in the early years but has all but disappeared now, more teams will tend to limit the influence of outliers (high or low) on league averages. As well, the higher that strikeout rates go, the harder it will be for a team to be 20% or 30% higher still. Plus, with players changing teams today as frequently as they do, the likelihood diminishes for a team to keep the same pitchers or the same type of pitchers for long stretches.
Will we have another team that will post strikeout rates 40% higher than league average and do it for several years running? It would seem not. In fact, we’re waiting for a team to do that in even one season – no team has reached a 135 score since the 1946 Tigers.
Fantastic work, Doug.
So in addition to all the other ‘this is the first time the Pirates have done this since…’ that we heard in 2013, it was the first time that they scored as high as 103 in K/9+ since 1985, when they lost 104 games.
And they haven’t led the NL in strikeouts since 1921.
Slight correction Doug. Schreck had one season of 2 3B and 2 HR. You read his partial values for 1899. There is an error in his BR home page. For 1899 it shows 115 G, 427 AB and a league-leading 738 PA which, of course, did not happen. It should be TOB/OBP = 148/.328 = 451. Schreck’s name came up on the old B-R blog but I don’t remember in what context.
Right you are, Richard.
Ossee’s .313 BA and 117 OPS+ was tops on the 1899 Spiders (min. 150 PA). With Schreck, the Spiders were 8-29. Without him, 12-105.
I found where Shreck’s name came up on the old B-R blog. In a blog written by John Autin on 8-6-11 entitled “Bill Bergen Still Stands Alone”, it was noted that Schreck is one of a small number of catchers who played in at least 75 games as a catcher and had an OPS+ of 40 or less. In 1904 his OPS+ was 33.
Interesting that the Dodgers led the NL in Ks from 1948-63, all but 2 of those years coming before Dodger Stadium. My first thought was, good work by the front office to build a high-K staff to offset (what I thought was) hitter-friendly Ebbets Field.
But actually, the park factors in that era show Ebbets mostly neutral. The pitching park factor was between 98 and 102 from 1941-55, then rose to 106 in their last 2 years in Brooklyn.
Thinking that maybe post-war Ebbets was at least a high-HR park, even if neutral overall, I checked the home/road HR splits for 1946-57. Brooklyn was 4th in percentage of total HRs hit at home (54.8%), and 5th in pct. of HRs allowed at home (53.9%). The Giants and Tigers were #1-2 in both measures.
Five of the six Dodgers who hit 50+ HRs in that era hit from 56-58% of their HRs at home, but none were among the most extreme “homers” in MLB for that span; 35 players with 50+ HRs had higher home percentages than any Dodger of 1946-57.
Stimulating as always, Doug.
Good stuff, John.
Seldom unrewarding to challenge one’s preconceptions now and then.
“Interesting that the Dodgers led the NL in Ks from 1948-63, all but 2 of those years coming before Dodger Stadium”
Not to mention ending just as Sandy Koufax was hitting his peak.
LA did lead the league in Ks again during Sandy’s final year, 1966. Incidentally, their 1,084 Ks would have ranked next-to-last in the 2013 NL.
Those charts are awesome! Especially the ones with K/9+ for each team and season and the color coding. I was thinking there was a site that did a similar thing for players in various categories, but couldn’t find it. Perhaps I’m thinking of the Lee Sinins Sabermetric Encyclopedia.
Glad you liked it, Ken.
To me the revealing thing here is the lack of correlation between leading the league in SOs and winning the pennant. The Dodgers’ run from 1946 to 1966 is something of an exception, since they won 10 pennants and lost in a three game playoff three times, while leading in strikeouts 11 of those seasons, but otherwise pennant winners are all over the place in terms of strikeout ranking. I’m not up to checking on W-L records of the SO leaders, but it would be interesting to see how much of a positive correlation there is between a winning record and whiffing the opposition.
Looks like the last time the league strikeout leaders met in the World Series was 1949. Also happened in 1944, 1930 and 1905, but I think that may be all.
Pingback: BBA Linkfest – General snow drifts | The Flagrant Fan
Great stuff Doug. The league-leaders chart throws up all sorts of interesting stuff. The Braves never led the league until 1994. The Orioles have only done it twice. They and the Cardinals haven’t done it since 1944, the Pirates not since 1921.
Analysing that table, I believe the following teams hold the record for consecutive last placed finishes in the strikeout table for a given number of teams in the league:
8 team league: Braves, 1935-40 (six seasons)
10 team league: Mets, 1962-66 (five seasons)
12 team league: Cardinals,1979-83 (five seasons)
14 team league: Brewers, 1977-80 (four seasons)
16 team league: Rockies, 2002-04 (three seasons)
Leading the league in Ks may not correlate with winning championships but coming last in Ks looks to give you a good shot of also finishing last in the standings.
Or does it? Yeah, the Braves and Mets were awful, and the Rockies were bad. But the Cardinals had a WS title (and had the best overall record in NL in ’81). And the Brewers twice won 93+ games.