
Here’s a simple plot showing, by year, the percentage of all plate appearances given each year to any non-starter, as well as the percentage given to pinch-hitters specifically.
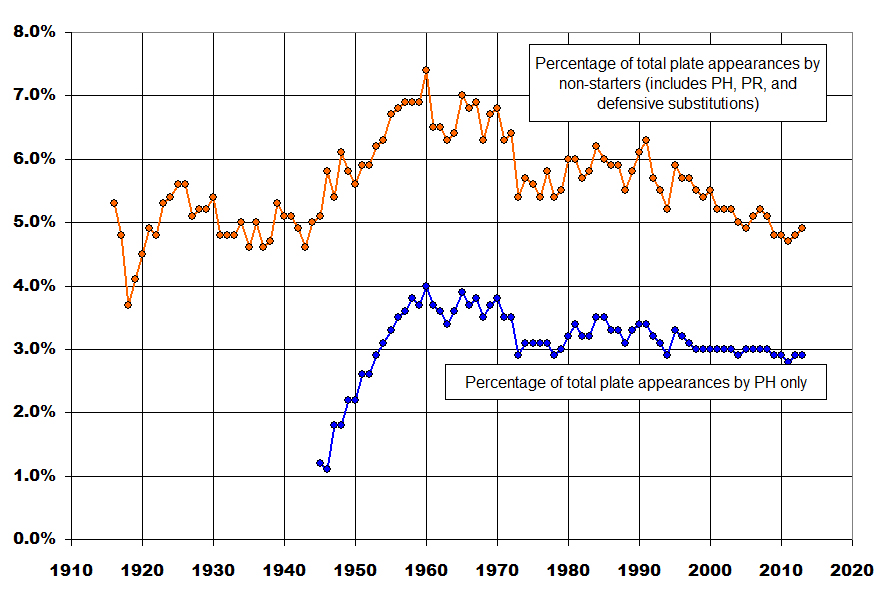
The pinch-hitter data goes back only to 1945 (the limit of full play-by-play availability) and happens to coincide with a dramatic increase in the use of the pinch-hitter in baseball. From 1945 until 1960, nearly 3% more of all plate appearances went to pinch-hitters, singlehandedly accounting for the same increase among all non-starters.
Since that time, pinch-hitter use has tapered off slowly, falling about 1 percentage point over the 50 or so intervening years, while overall non-starter plate appearances have dropped by more than double that amount. The reason is likely a drop in defensive substitutions. It’s clear that defense is better now than ever and fewer teams carry defensive specialists, instead opting in most cases to keep good reserve bats on the bench. The effect may also be due to the overall emphasis on offense, with teams seemingly more likely to keep a good player in the game because of his bat, rather than removing him for a better glove man.
I think this needs a correction based on the number of available bench players. Basically you have to deduct off your pitching staff, DH if you got one, to know how many actual guys on the bench are getting utilized. I think if you do that, we’re using just as much bench players as we always did. There’s just less people on the bench to choose from so as a total of the team’s production they get used less.
I’m not following the glove man thing. I mean I guess the order may come around but rarely are you so far ahead that you are pulling bats for gloves with projectable AB’s still on the table.
Sorry if I’m being thick, but I don’t understand either of your points.
I’m saying 1) that when you carry more pitchers, you have fewer bench players to choose from and there are less bench ab’s to go around and 2) defensive replacements generally don’t get many AB’s. Used effectively, you try to minimize their AB’s while maximizing their innings in the field. Platoon players are typically the ones that come off the bench and take over significant AB’s from the starter.
Also, the dip in pinch-hitting in 1973 is due to the DH, where AL teams stopped pinch-hitting for the pitcher. Since then, pinch-hitting has been largely constant at 3% of all plate appearances.
Welcome back Andy. Mosc @1+4 I think one of your points is that because there are fewer position players on the bench than, say, thirty years ago, managers are less likely to replace starters because they worry they might have an extra inning game, or an injury, with no one left on the bench. One of those bench players has to be a catcher. So, they have to keep in their starters, just to be sure. Second, Andy’s thesis about the relationship of higher scoring to the necessity of keeping your better bats in the lineup makes sense. If I recall, in 1964, when the Phillies collapsed and blew it, Mauch supposedly would bring his glove men early in the game when he had a lead. I checked the stats for that year and, imperfect though this might be, it looks like he gave over 1600 PA’s to his utility players, even though every “starter” appeared in at least 125 games. He had three first basemen.
There is a dropoff from 1972 to 1973 in the total plate appearances, and the best year since does not get back up to 1972 levels.
Also, relief pitchers don’t bat as often anymore, either.
The downward trend since about ’91 marks the change in a typical roster from 15 hitters/10 pitchers to the current 13/12.
Interesting sidebar, though: While in-game bench use has declined in this period, overall playing time for non-regulars has actually increased. I’ll be posting soon on that subject.
BTW, classic Andy work — right to the point.
A while back on the B-R blog, I had posted something similar to what you’re describing, although at that time the main effect was tht the starters were getting increasingly more PAs as scoring peaked around 2000. I had attributed it to shifts in managerial thinking for various reasons–I failed to see the more fitting (and more likely correct) theory you just put forth about roster spots being snapped up by relievers.
One that that popped into my head concerning the increase from the mid-40’s thru the 1950’s: could it have something to do with an expanding talent pool because of desegregation and an increased population in general coupled with a static number of positions available?
Basically did teams have better options for bench players during that era? Were guys who might have been acceptable in a starting role being used as 4th outfielders or utility infielders and thus managers were using them differently?
I have no idea if that’s actually the case or not but it seems like it might be a factor although I’m certain that the increased number of pitchers on current rosters has had a much larger role in the current decline in usage.
Is there way to correlate this with the rapid increase in salaries? That is, if you’re paying someone $10 million a season, you’re less likely to pinch hit for them?
You can’t correlate it with salary because high-salary free agents (who also deserve to be pinch-hit for) would not constitute a useful sample.
The statements about the increase in pitchers on the roster is valid though. My own initial observation was that there is a spike in the 50s and throughout the 60s and I attribute that to the influx of talent of non-white players. “Overnight” the league was drawing from a larger and better pool of talent than previously and thus had better bench options.
Andy, Forgive me if I state obvious, the root cause , I think, is the success of live arms. In any competitive activity ,a successful strategy will be copied. If the last 40 years in baseball, the maters with “quick hooks” as it used to be called, outperformed their peers. Pitchers work harder than any other position, and spreading the work led to more success, which led to imitation, which led to carrying more pitchers, which led to carrying fewer position players, which led to fewer PAs by non-starters . If defensive substitutions had had the same success, the reverse would have happened , but it didn’t . Your data is fascinating in that it shows that Defensive substitutions absorbed all of the increase in the pitching staffs, it could have been pinch hits, or a combination of both, but. It seems that it was defensive specialists that had to make way. Logically the direction of causality runs from
More relief innings > starters throwing harder for fewer innings > more strikeouts > better chance to hide bad defenders .
I think pride in CG among the best starters likely slowed the transition. I would like to meet the manager who could walk out to Bob Gibson in his prime and as for the ball with a 3-1 lead and a man on 1st . Once rate stats like WHIP came into sharper focus, pitchers were much more willing to protect those numbers and head for the showers.
Yes! My original post had cause and effect reversed. You and JA point out the actual cause, and as you explain, it’s defensive specialists who have paid the price. A logical reworking of my argument is that the perceived gain in defensive quality by using the replacement is less than the perceived gain in using additional pitchers. GMs and managers aren’t likely making this exact conscious choice, but the prevailing mentality is affecting roster composition and game use.
“Ask” for the ball
Pingback: High Heat Stats » 13 Hitters Instead of 15: Where Did the PAs Go?