
What to make of Kyle Gibson’s pattern of good and bad outings?
Game Scores aren’t a great measure of Gibson’s performance, because he isn’t a strikeout pitcher (which could be a factor in the pattern). But I’ll show that picture, then move on to my main point:
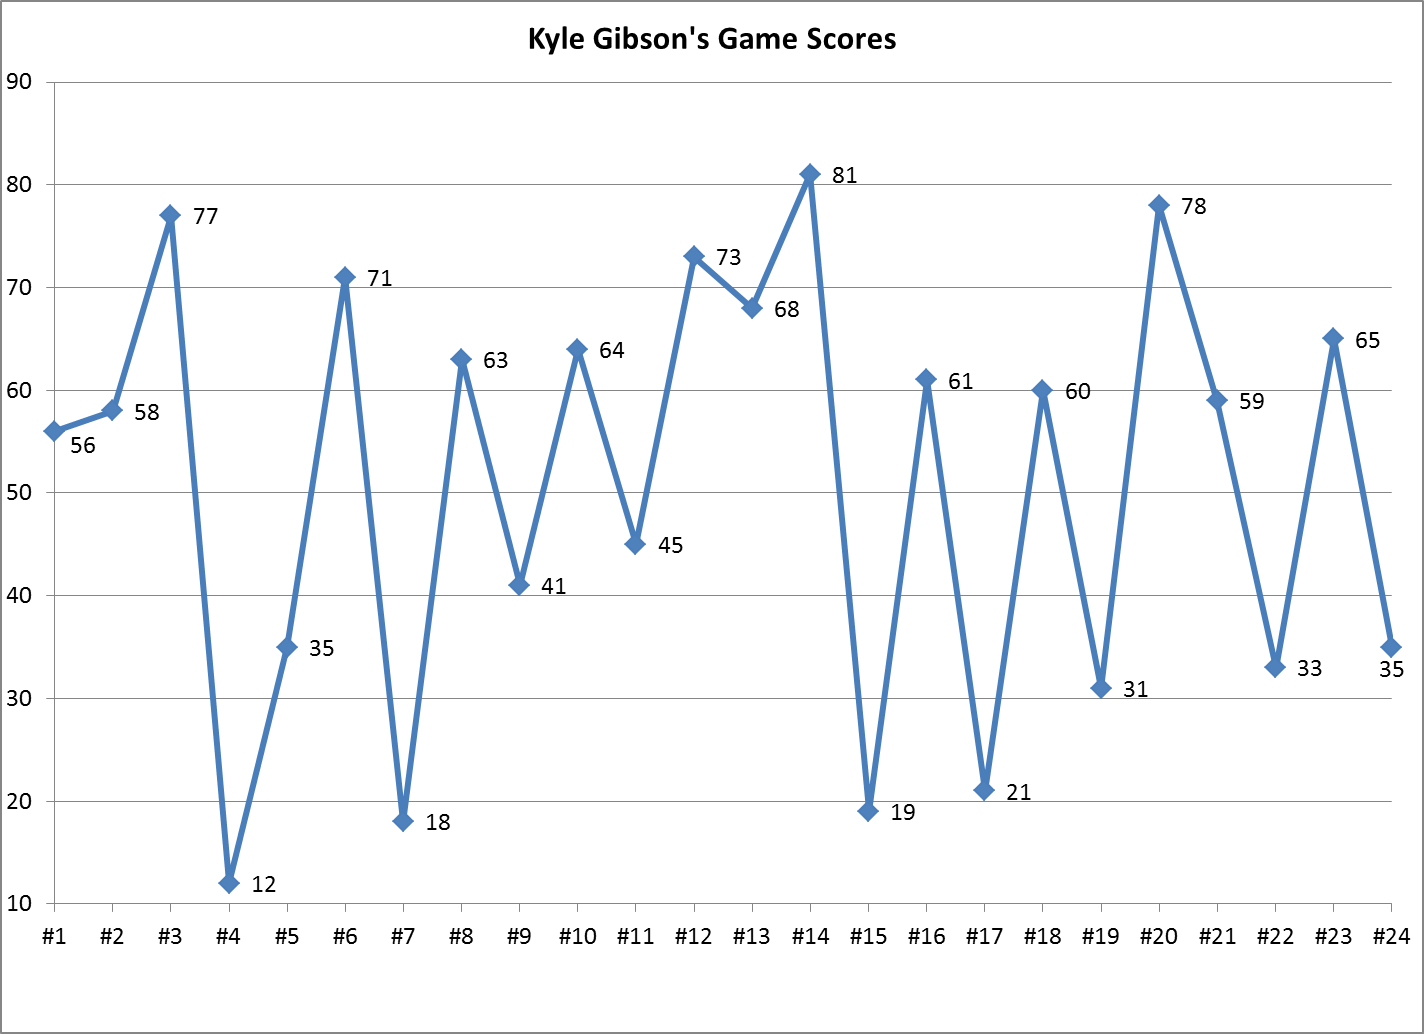
Out of 24 starts this year, Gibson has allowed:
- 0 or 1 run 12 times — tied for 3rd in MLB, one behind Kershaw and Wainwright.
- 5 runs or more 9 times — also tied for 3rd, but in completely different company.
- 2, 3 or 4 runs just once each.
(For a Minnesota Twin, those 12 excellent starts really stand out. From 2007-13, 135 MLB pitchers had at least 12 such starts in a year — but no Twin had done so since Johan Santana in 2006, and only two had reached 10 such starts.)
Getting back to this season:
- The 12 others with 11 to 13 starts of 0-1 run have season ERAs from 1.86 to 3.32, median 2.57. Gibson is at 4.13.
- The nine others with 8 to 11 starts of 5+ runs have season ERAs from 4.24 to 5.99, median 4.99.
And Gibson isn’t just in both groups; he’s at the extreme end of each. For the good games only, his 0.44 ERA is 2nd-best of that group (median 0.68); his eight scoreless starts stand alone at #2, trailing only Wainwright. For the bad games only, Gibson’s 12.29 ERA is the worst of the group (median 10.20).
Measuring the groups’ degree of crossover:
- The other 12 in the “good” group average 2.6 of the “bad” starts, led by Tyson Ross’s five.
- The other nine in the “bad” group average 4.3 of the “good” starts, led by Drew Hutchison’s eight.
For a deeper perspective … At these rates and with about seven starts left, Gibson would finish with 15 or 16 starts of 0-1 runs, and 11 or 12 starts of 5+ runs. In the past 10 years, no one reached both 15 of 0-1 and 11 of 5+:
- None with at least 15 at 0-1 runs had more than nine at 5+ (King Felix, 2012, 3.06 ERA).
- None with at least 10 at 5+ runs had more than 14 at 0-1 (Mark Buehrle, 2005, 3.12 ERA, and Carlos Zambrano, 2007, 3.95 ERA).
- The 23 pitchers with 15 or 16 starts at 0-1 runs had season ERAs ranging from 1.83 to 3.48, with a 2.79 median and 2.71 average. Again, Gibson’s ERA is 4.13.
Compiling these data for large groups of years would be too tedious, but we can get a similar gauge by using the Split Finder for ERA in wins and losses.
Gibson’s ERA is 1.07 in 11 wins, 11.84 in 9 losses. If I’ve done my work right, that 11.1 ratio of Loss ERA to Win ERA would be the second-highest since 1914 of any pitcher with at least 8 starts won and 8 starts lost. The seven with ratios of 10 or higher:
- 12.0 — Tom Cheney, 1963 — wins 0.51 ERA, losses 6.10 … season 8-9, 2.71 in 136 IP (21 GS, 2 GR)
- 11.1 — Kyle Gibson, 2014 — wins 1.07 ERA, losses 11.84 … season 11-9, 4.13 in 139 IP (24 GS)
- 11.1 — Omar Daal, 2002 — wins 1.06 ERA, losses 11.81 … season 11-9, 3.90 in 161 IP (23 GS, 16 GR)
- 11.0 — Sam McDowell, 1966 — wins 0.59 ERA, losses 6.47 … season 9-8, 2.87 in 194 IP (28 GS, 7 GR)
- 11.0 — Rube Foster,* 1914 — wins 0.36 ERA, losses 3.95 … season 14-8, 1.70 in 212 IP (27 GS, 5 GR)
- 10.3 — Rudy May, 1972 — wins 0.79 ERA, losses 8.12 … season 12-11, 2.94 in 205 IP (30 GS, 5 GR)
- 10.1 — Mike Garcia, 1956 — wins 0.80 ERA, losses 8.05 … season 11-12, 3.78 in 198 IP (30 GS, 5 GR)
If you follow those links to their game logs, I think you’ll agree that almost all the others were more streaky than Gibson. Hot streaks:
- Cheney opened with four CGs that totaled 1 ER, then had four straight yielding 5 runs or more.
- Daal had eight straight starts of 2 runs or less.
- McDowell had a 4-game span that totaled 2 runs in 39 IP.
- Foster tossed four straight shutouts.
- May won 7 of his last 8, yielding one run or less in each win.
Gibson’ monthly ERAs are all between 3.16 and 4.64 for completed months. The other six on this list all had bigger spreads from best to worst month.
Gibson’s longest streak of 0-1 runs is three starts, in April and in June, with no others consecutive. Just two of his 5+ games were back-to-back, those right after a streak of three good ones. In half his starts, a 0-1 game followed one of 5+, or vice versa. A monthly tally of 0-1 games and 5+ games: three and two in April, same in May, three and one in June, two and two in July, one and two in August.
Of the other six on this list, the pattern closest to Gibson’s seems to be Mike Garcia. Except for two games in April, Garcia’s monthly ERAs were all between 3.19 and 4.60. He had four shutouts and four more starts yielding one run, but none of them were consecutive. Each shutout was followed by a bad game.
By the way, Gibson is on pace for 26 decisions, three more than the next-most on this list. As decisions rise, an extreme ratio of ERA splits becomes more unlikely. But unlikely is normal for Gibson this year. Here’s another wacky split for him, unrelated(?) to our main topic:
| Kyle Gibson | G | PA | AB | R | H | 2B | 3B | HR | SB | CS | BB | SO | TB | GDP | HBP | SH | SF | IBB | ROE | tOPS+ | sOPS+ | ||||||
|---|---|---|---|---|---|---|---|---|---|---|---|---|---|---|---|---|---|---|---|---|---|---|---|---|---|---|---|
| Pitch 1-25 | 24 | 156 | 142 | 15 | 40 | 8 | 1 | 2 | 0 | 0 | 12 | 27 | 2.25 | .282 | .340 | .394 | .734 | 56 | 1 | 1 | 0 | 1 | 0 | 1 | .333 | 121 | 113 |
| Pitch 26-50 | 24 | 159 | 149 | 21 | 34 | 7 | 2 | 3 | 0 | 0 | 9 | 19 | 2.11 | .228 | .270 | .362 | .633 | 54 | 4 | 0 | 0 | 1 | 0 | 3 | .242 | 89 | 82 |
| Pitch 51-75 | 22 | 144 | 130 | 17 | 35 | 7 | 1 | 4 | 0 | 0 | 11 | 17 | 1.55 | .269 | .326 | .431 | .757 | 56 | 5 | 0 | 3 | 0 | 0 | 2 | .284 | 127 | 108 |
| Pitch 76-100 | 20 | 110 | 101 | 0 | 20 | 0 | 0 | 0 | 0 | 1 | 8 | 15 | 1.88 | .198 | .257 | .198 | .455 | 20 | 6 | 0 | 1 | 0 | 0 | 2 | .233 | 40 | 28 |
| Pitch 101+ | 8 | 13 | 13 | 2 | 5 | 2 | 0 | 0 | 0 | 0 | 0 | 0 | .385 | .385 | .538 | .923 | 7 | 1 | 0 | 0 | 0 | 0 | 0 | .385 | 176 | 172 |
No extra-base hits in pitches #76-100?! We have pitch data back to 1988. No pitcher facing at least 100 batters in that pitch range has put up a zero in extra-base hits. Gibson’s .455 OPS in that split would be 9th-best by raw numbers, 6th-best by percentage of overall mark.
(As for his “0 Runs” for pitch 76-100 … For what it’s worth, no one’s ever had zero runs in this split, either. But I don’t know exactly what’s captured in that tally. The runs in this table total 55, but he’s allowed 66 runs. I thought the gap might be “bequeathed runners scored,” but his 8 BQS would only bring this total to 63. I don’t want to focus on a number that could be in error.)
Splits for pitch 101+ are generally the best, because a modern pitcher isn’t allowed to go much past 100 pitches unless he’s having a good day. But the MLB splits for pitch 76-100 are almost the same as for 51-75.
Can you tie this split of Gibson’s to his up-and-down outings? Or find meaning in any data presented here? I suspect it’s just some weird stuff that happened. Sure is weird, though.