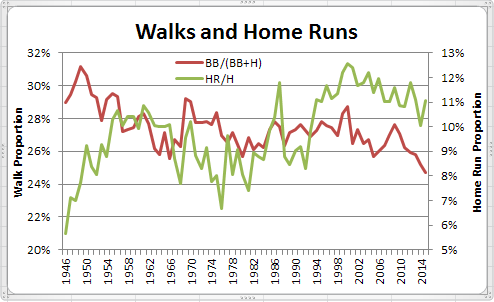
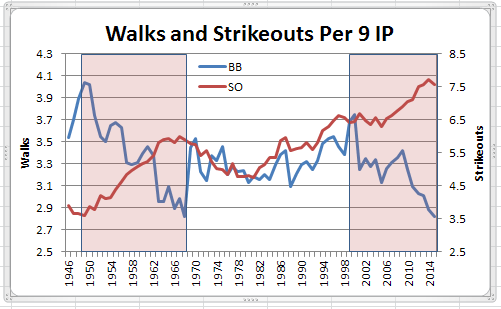
While much attention has focused on the inexorable increase in strikeouts, the accompanying decline in walk rate seems to have slid under the radar. Half-way into this season, strikeouts remain at or near historical highs but walks continue to slide, down almost a full walk per team per game from the levels of 2000. In fact, if you look at the chart below, you’ll see that the trend of increasing strikeouts and declining walks that we’ve seen over the past 15 years is something last seen about 50 years ago.
After the jump, more on similarities between the game today and a half century ago.
So, why are walks declining? One reason is that pitchers are increasingly getting the upper hand against batters, so are less inclined to pitch more cautiously. That is evidenced by the chart below, showing declining per game rates for hits, home runs and errors, all indicators of pitcher dominance.
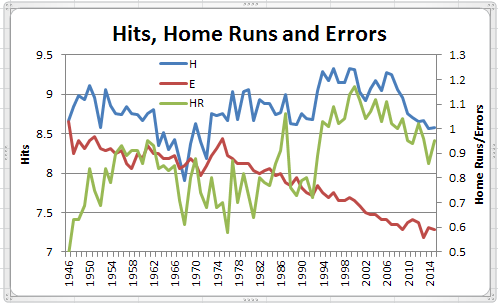
As was the case with the first chart, the early to mid 1960s is the last time Hits and Home Runs have been moving downwards at the same time. Errors have declined continuously because of a combination of factors including better athletes, equipment and tactical defensive positioning, the last a result of the wealth of statistical data once unknown but now readily available to all.
The trend in fewer hits, home runs and errors have been enhanced in the most recent period by the walk and strikeout trends shown in the first chart to produce the result show below.
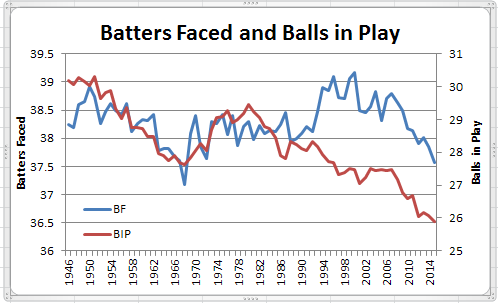
Fewer hits and walks mean fewer batters, and more strikeouts mean fewer balls in play. As in the first two charts, the current trend in these two results was last seen in the 1960s.
Fewer balls in play mean fewer baserunners and less scoring as shown below.
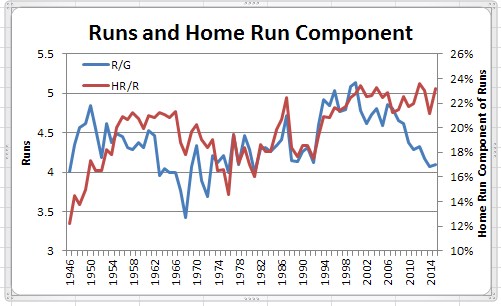
While the recent decline in scoring is intuitive and predictable given the other trends we’ve witnessed, a more subtle relationship is also evident in the chart above, a sort of diminishing returns relationship between home runs and scoring.
As shown above, scoring is clearly on the wane, down a run per team per game since 2000, and by three-quarters of a run since 2005. That decline is, in part, due to a declining home run rate. Yet, the proportion of runs that are home runs (just the home run itself, not the baserunners driven in by home runs) has been fairly constant over that period, a notable departure from the 30 or so preceding years when these two quantities moved in virtual lock step. The current situation, again last witnessed in the 1960s, presents an apparent paradox of a sustained high dependence on home runs for scoring, despite declining numbers of both runs and home runs.
Further diminishing returns relationships are indicated in the chart below, showing BABIP and runs (with and without home runs) as a proportion of baserunners.
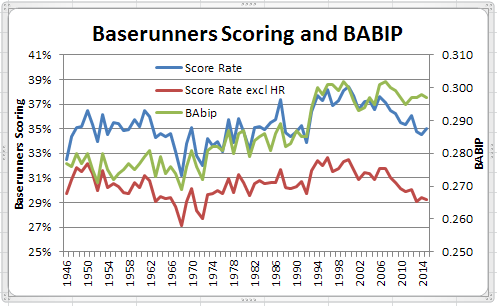
BABIP has risen steadily throughout the period, the result of increasing strikeouts, declining balls in play, and a hit rate that, while declining since 2000, was still at typical levels witnessed for most of the preceding 50 years. As BABIP rose starting in the late 1960s, so too did the proportion of baserunners scoring, as measured by Runs divided by the sum of hits, walks and HBPs (subtracting home runs from both the numerator and denominator yields the second score rate line). However, that relationship has weakened over the past decade with a steady BABIP but a declining scoring rate, a phenomenon last seen … you guessed it, in the 1960s.
So, what lies ahead? One can only speculate as to how the game might have evolved without the rule changes of 1969 that had the intended, and immediate, effect of arresting the escalating dominance of pitchers over the preceding decade. Is it time to redefine the strike zone again (more especially with the return of the high strike call, an unintended effect of the technological wizardry that judges every umpire’s call against the rule book strike zone)? Or, should roster sizes increase or limits on relief pitcher usage be established to try to level the batter vs. pitcher playing field, especially in the late innings? Or, should we just leave things as they are and see how the game evolves through “natural” forces?