
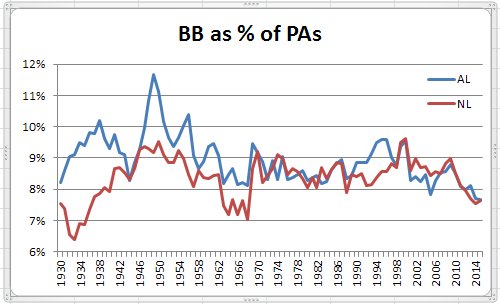
MLB walk rates are at historic lows, another artifact of a declining run scoring environment. Rates below 8% of PAs have been recorded in both leagues for the past two seasons, levels not seen since the 1960s in the NL, and not seen previously in the AL in the live ball era.
More after the jump.
As shown on the chart to the left, walk rates for both the NL and AL, after remaining for most of a 40 year period in a tight range between 8% and 9% of PAs, have dropped below 8% in the past 5 years, a rate not seen in the NL in the past 50 years, and not seen for at least 85 years in the AL. This decline is similar to one seen in the 1960s that also coincided with a reduction in run scoring.
The implication would appear to be that pitchers are more confident of retiring batters and thus more inclined to challenge hitters with pitches in or near the strike zone. And, with hitters continuing to swing and miss at record rates, an aggressive approach by pitchers only makes sense.
With pitchers being more aggressive, one would naturally expect fewer intentional walks to be issued, a trend illustrated below.
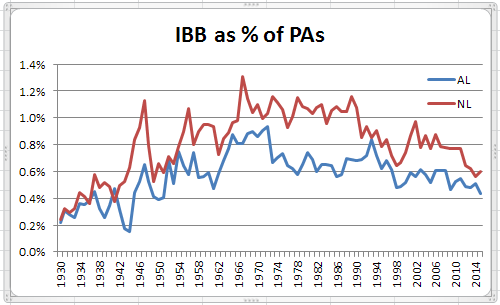
IBBs are being issued at rates not seen in the AL or NL in more than 60 years, and far below the rates of the 1970s and 1980s.
However, while overall walks declined in the lower run scoring environment of the 1960s, intentional walk rates ballooned in that period, apparently an indication that managers were confident that runners put on base intentionally had a low chance of scoring. The different approach by managers in the current run scoring decline may be a reflection of the influence of sabermetrics on the game. As an example, in “The Book” by Tango, Lichtman and Dolphin, their analysis indicated that there were few situations where it made sense to walk a batter to face the pitcher coming up next, usually the most obvious IBB scenario.
That divergence in in-game strategy between the current day and the 1960s is emphasized in the chart below that shows that declines in IBB rates are even more pronounced than the decline in overall walks.
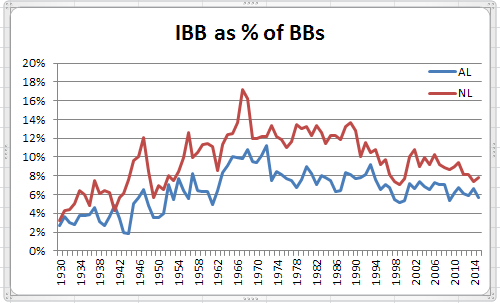 As a proportion of overall walks, IBBs have declined in recent years to levels that, with the exception of a brief dip in the late 1990s, have not been seen since the early 1960s in the AL or NL.
I have major league stat totals by month since 1973 in a spreadsheet. Here are the lowest 12 walks per game in that time period.
Year Month BB/G
2014 Sept 2.68
2015 June 2.72
2015 July 2.74
2014 July 2.75
2012 Aug 2.80
2014 Aug 2.81
2015 May 2.82
2013 June 2.82
2014 June 2.83
1988 July 2.87
2011 Aug 2.90
2015 Aug 2.92
From 1915-1941, there were an average of 4219 walks in the AL and 3381 in the NL. That is just a HUGE difference, about 105 per team average over 27 years. Does anyone know the reasons for this?
That’s pretty telling.
Reminds me of climate change, and the n hottest years on record all in the last n+very few years.
As to the disparity in league walk rates in the 1920s and 1930s, my hypothesis would be that that is related to the biggest power hitters of those years being disproportionately concentrated in the AL. Probably AL pitchers would be giving those batters a pretty wide berth.
The other, related factor that I recall reading somewhere is that, because of all those mashers, AL ball tended to be more static with baserunners waiting for those extra-base hits to drive them in. Knowing that AL baserunners would be inclined to “stay put” and not drive your defense to distraction, pitchers could concentrate on getting the key out to end the inning, and wouldn’t be quite so concerned about putting another runner on. In contrast, baserunners were more in motion in the NL, knowing they had to get themselves in position to score on singles, rather than doubles and home runs. Baserunners being a more disruptive force would tend to give pitchers and managers pause when considering whether to put another one on.
A quick glance through the yearly top 10s doesn’t give much of an indication of the fall-off your chart indicates. Some batters are still drawing walks at levels consistent with the past, in other words, so my conclusion is that the cause is probably impatient batters as well as confident pitchers. In the late 1940s through the early 1950s, waiting out the pitcher and looking for a particular pitch got to be arts practiced by many. Currently they appears to be the province of the few.
Also, there might be a correlation between this phenomenon and the marked declined by pitchers in innings per start—which is also the marked increase in the use of middle relievers and specialists. Fresh arms, new deliveries to confront—are there any figures re starters vs. relievers concerning the decline in walks?
I’m guessing impatient hitters can encourage more confident pitchers.
Good suggestion for inquiry on reduced workloads and starters vs. relievers. Certainly, it makes sense that more walks are likely with tired pitchers who lose their release point, or don’t follow through as completely with their delivery, often resulting in wildness high.
I was going to suggest that one possible reason for the much higher peak in IBB in the NL during the second half of the 60’s was largely due to the fact that they had better players- position players at least- at least in part because they had done a better job of integrating. Mays, Aaron, Stargell, McCovey, Banks, Allen, B Williams, Brock, Clemente…
Usually when you think of Clemente & walks it tends to be in terms of fewer rather than more but for almost the entire decade of the 60’s at least 25% of the time that he did walk it was intentional and at least once it was well over half of the time.
When I checked Frank Robinson however it does appear that was probably not the only factor in play. Robinson led the NL in IBB 4 years in a row from 61 to 64 (23,16,20,20) and was 3rd the next year with 18.
Then in 66 he gets traded to the AL & wins the Triple Crown and yet his IBB fall to 11 and he falls out of the top 10 entirely.
That does suggest a difference in approach between the 2 leagues.
The spike in IBB in the NL during the early 00’s of course brought to mind Barry Bonds. If anything it’s a little surprising that his astonishingly high IBB totals didn’t have a larger impact than they did.
Interesting stuff Doug! I did some analysis, comparing 2015 to 2000 (which appears to be the peak year on your chart).
Here’s what I found:
Relievers are more likely to walk batters than starters are. That surprised me. I would expect a pitcher who knows he’s only going to be facing a few batters (and often with the platoon advantage) to walk less batters. That’s at least suggestive that NSB’s “tired arm hypothesis” isn’t correct though more analysis would be needed for a definitive answer.
Beyond that’s here the other interesting information that I found:
1) Batters are more likely to swing at a first pitch. (30.2% in 2015, 29.2% in 2000).
2) Even though they’re swinging at more first pitches, they’re putting fewer first pitches into play (11.4% in 2015, 13.0% in 2000).
3) Putting #1 and #2 together (swinging at more first pitches but putting fewer into play) adds up to more batters falling behind in the count.
4) What about when batters take the first pitch? In 2015, 45% of taken first pitches were strikes vs only 38% in 2000. Again, more batters falling behind in the count.
5) That suggests a few possible explanations: 1) pitchers are being more aggressive because they no longer fear batters, 2) pitchers simply are higher quality, 3) pitchers have finally accepted the importance of throwing a first pitch strike, 4) some combination of the above.
6) Batters are also less likely to draw a walk when they reach 3 balls. In 2015 40.9% of 3 ball counts resulted in walks whereas in 2000 it was 45.5%.
So it seems that part of the dropoff in walks, at least between 2000 and 2015, is that more batters are falling behind in the count, starting with the very first pitch. And as we know, once a batter is behind, it’s hard to get back ahead.
Point #6 above though is interesting and I’m not sure how to account for it. Though again, it could be things like pitchers not being afraid of batters, higher quality pitchers, etc.
Here’s the breakdown of pitches for recent seasons. So, there’s been about a 7% increase in foul strike rate since 2009.
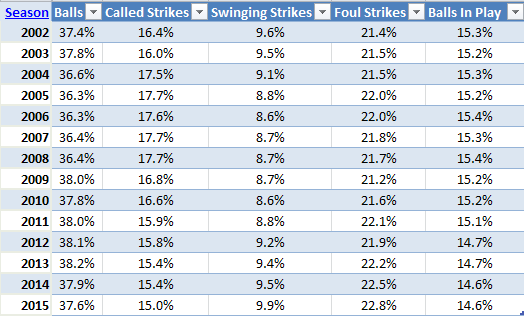
But, look at these numbers, which really show the effects of undisciplined hitting.
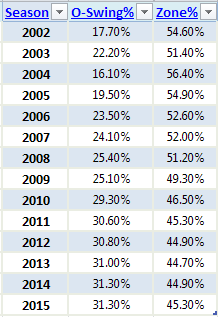
The proportion of pitches outside the zone that batters swing at has almost doubled since 2004. The result is that pitchers are throwing 20% fewer pitches in the zone, and still reducing their walk rates.
It’s interesting that though pitchers are reducing their walk rates, they’re not reducing their ball rates. If there’s a significant decrease in Ball Fours, there must be a corresponding increase in Balls 1-3.
Looking at the zone figures, pitchers seem pretty sensitive to whether batters tend to be reaching or taking. Pitchers seem to be willing to invest some balls early in the count, perhaps to see whether they can lure batters. I wonder whether they aren’t being told to waste a pitch well out of the zone early, so that they can make an in/outside pitch seem within reach afterwards, since batters seem to be broadening their swing zones.
I also wonder whether the detailed information on individual batter hot/cold zones it not contributing to the changes in BB/K dynamics. It would seem odd if it didn’t.
Part of the reason for similar ball rates is what happens on an 0-2 pitch. More often than not, you’ll see a pitcher throw a couple low and away, supposedly to entice the batter to chase, but usually too far outside for that purpose.
Personally, I just don’t get the logic of a pitcher giving up his advantage in the AB so easily. Of course, you don’t want to give the batter something hittable, but throw something that will at least make the batter think about swinging, and that will force him to foul it off if he does.
That’s true, Doug, but this has been the normal 0-2 strategy for as long as I can remember. But you wrote “throw a couple low and away”: perhaps you’re saying that there’s been a change in the 1-2 strategy. That would be what I suspect, and that really is gambling in a way that gives up the advantage when the batter lays off. (Perhaps the change in strategy actually applies to the 0-1 pitch.)
I agree that not too much should be read into the increase in foul strikes (although there has been year-over-year increases in 5 of the last 6 years). I just mentioned the increase because NSB’s original comment #8 speculated that foul strikes might be on the decline.
As to a change in 1-2 strategy, apparently so, because after failing to get the batter to chase 0-2, too often the pitcher will try again, and usually with the same pitch. That just doesn’t make much sense to me; like doing the same thing over again and expecting a different result.
Doug =
Here’s an interesting article on plate discipline, using the data from Fangraphs. The study covers the 2002-2013 time period.
The 20 best plate discipline seasons all occurred between 2002-2004. The 20 worst plate discipline seasons all occurred between 2009-2013.
http://fivethirtyeight.com/datalab/the-most-disciplined-mlb-batters/
The charts in this article don’t seem to correlate directly to bases on balls or even good hitting, not necessarily. Good batters, Moises Alou, Jones, Jeter, Garciaparra, and Bonds account for the majority of the good individual seasons, but only Bonds drew outstanding numbers of walks, and a large portion of them because of the fear factor.
At the opposite end, Dan Uggla gets credit for plate discipline in 2012-13, even though he batted .220 and .179 while drawing enough walks, 94, to lead the NL the first of those years.
In sum I think the premise of the analytical approach used here is kind of naive, especially in comparison to Doug’s statistical breakdown @ #10 above.
Although, Doug, I’m not sure the 7% increase in foul strikes means as much as you imply, since 2009 was an anomalously low year.
Wouldn’t you need to eliminate IBBs to make this comparison, since they were so much higher early in the period, and those pitches will always show perfect plate discipline? I can identify 480 pitches that Barry Bonds showed absolutely perfect discipline on in 2004 – amazing! But I also would have been perfect on them – and a whole lot cheaper – although I’m not really as good a hitter as Bonds, even when I remember to take my PEDs.
It may not be as high as 480: Only ball four of an intentional walk needs to be intentional to credit an IBB.
Situation: Runner on second, one out, heavy hitter at the plate. Pitcher tries to get batter to swing at a bad ball; eventually, he falls behind 3-1. They then decide to intentionally walk the batter, so they throw a pitchout to a standing catcher for ball four, yet only one was intentionally way outside. The walk is considered intentional.
Point taken, Oneblankspace. My impression is that this is much rarer than a pure 4-0 IBB. Would that be yours?
I would suspect that it would still be over 450 intentional balls.
Then again, not all intentional balls are part of a walk (pitchout in a steal situation).
Here are the 1915-1941 raw increases of walks for AL over NL by batting order position, and increases in BB/PA percentage.
Batting 1st__4212__2.55%
Batting 2nd__2224__1.33%
Batting 3rd__3561__2.26%
Batting 4th__2027__1.25%
Batting 5th__1848__1.17%
Batting 6th__2282__1.52%
Batting 7th__2264__1.56%
Batting 8th__2281__1.60%
Batting 9th__1901__1.40%
So the biggest differences were in the leadoff and 3rd positions, with the rest being fairly consistent. I imagine Babe Ruth was a big part of the 3rd position increase. Intentional walks were not a factor; they were actually higher in the NL (2292 vs 1950) at least for the data BB Ref has.
A subject that hasn’t been addressed but that might be relevant—two subjects, possibly—concerns foul strikes. I suspect that there has been a decline in them, owing to the increase in the number of players who swing hard at every opportunity. Further, David P’s discovery that—in two contrasting years, at least—there was a near 5% decline in batters getting a walk after a three-ball count suggests a decline in the desire, even at that point, to abandon power for contact, to work the pitcher instead of being worked by him.
NSB – As I was digging into the numbers, I was wondering about foul strikes as well. Though as far as I know that data doesn’t exist.
Pitch result data (i.e. ball and type of strike) are on FanGraphs, going back to 2002.
See my comment #10 above for those results.