
The two front-runners in the AL Central faced off in home and away series on consecutive weekends. The defending AL champions from Cleveland have yet to hit their stride this season, while the upstart young Minnesotans continue to surprise, leaving pundits still waiting for the Twins’ Cinderella start to reach midnight. More after the jump.
The Twins took a two game lead into the first series at home, where Minnesota has struggled with just 14 wins in their first 34 home games. The Indians had held their own on the road, with a 17-14 record heading into the series. Neither team was streaking heading into this set, with Minnesota at 5-5 over their last 10, and Cleveland at 4-6.
Game 1 matched Carlos Carrasco for the Indians against Nik Turley for the home side. Turley is a 27 year-old rookie southpaw making the second appearance of his career after getting an ND against the Giants in his debut of 4 IP, allowing 4 runs on 8 hits. In his ninth major league season, all with the Indians, Carrasco started off the campaign strongly with 6 quality starts in his first 7 outings, but had had only one QS over his last 5 before this assignment. In this contest, the Indians would get to Turley early, scoring eight times over 4.2 IP, the big blow a three run home run by Edwin Encarnacion in the third, with catcher Yan Gomes also collecting three RBI on a pair of run-scoring singles. Carrasco pitched into the 7th with his only blemish a home run by left-fielder Eddie Rosario leading off the 6th inning. Final score: Indians 8, Twins 1
Carrasco in his next start will become the 15th Indian pitcher of the expansion era with 125 starts through his age 30 season. Carrasco’s 3.29 ERA since 2014 ranks 5th best in the AL among pitchers with 500+ IP. Turley is the third lefty starter aged 27 or older to debut for the Twins in the past 5 seasons; there had been only one such pitcher for Minnesota (Tom Klawitter in 1985) in the 57 seasons before that.
Game 2 was the first end of a Saturday double-header and, like the previous evening’s contest, saw Cleveland jump to an early lead, getting to Twin starter, lefty Adam Wilk, for three first inning runs. All the damage came after Wilk retired his first two batters in just 5 pitches, with the Indians extending Wilk for another 36 pitches before he was able to record the final out. Cleveland would send Wilk to the showers after tagging him for three more runs in the 3rd and 4th innings, but the Twins hung around with three runs of their own in those frames. The Indians would put the game away in the 6th with a Jose Ramirez home run, his second of the game, and a Bradley Zimmer RBI groundout, for both their third run-scoring ABs of the contest. Final score: Indians 9, Twins 3
Ramirez’s two home runs gave him 11 for the season, matching his total for all of 2016. His four RBI pushed him past 150 for his career to become the fourth Indian third baseman to do so through his age 24 season. Quiz: who were the first three Tribe third sackers with this accomplishment?
Though still with rookie status, Wilk is pitching for his fourth franchise in his four major league seasons, and is still looking for his first win; if he doesn’t get one this season, he would join Mike Fyhrie as the only two pitchers (out of 89) without a win after 5+ starts for four or more teams over their first four seasons.
In the second game of the twinbill, the Game 3 starters were rookie southpaw Adalberto Mejia for the Twins going against second year right-hander Mike Clevinger for the Tribe. Neither starter would last 5 innings though both acquitted themselves reasonably well with Clevenger allowing only a run-scoring double and Mejia just a pair of solo blasts. So, this game was put in the hands of both bullpens with the outcome still very much in play. Alas, it didn’t take long for the Twin relievers to crack, with Tyler Duffey relieving Mejia and yielding a three run homer to his fifth batter, Indian outfielder Lonnie Chisenhall. Final score: Indians 6, Twins 2
This is the 14th team in Twins/Senators history to have three rookie left-handers with a start, but it’s the first time in franchise history that different rookie left-handers have started three consecutive games. Chisenhall had a pair of home runs in this game, good for four RBI that pushed his season totals to 10 home runs and 35 RBI in just 43 games games played. Brian Dozier homered for the Twins, his 12th long ball of the season; after his 42 HR/99 RBI campaign last year, Dozier looks to be tracking to the form he displayed in the two prior seasons, with OPS in the .750 to .800 range, still very respectable results for any middle infielder.
The Tribe went for the sweep in Game 4 with Trevor Bauer on the hill to face Twin right-hander Kyle Gibson. This game was all about Cleveland free agent signee Edwin Encarnacion who staked the Indians to a 4-0 lead with home runs in the 3rd and 6th innings and an RBI single in the 7th, and then added an insurance sac fly in the 9th after the Twins had cut the lead in half with a pair of two out RBI hits in the home 7th. Final score: Indians 5, Twins 2
Encarnacion and Chris Davis are neck and neck for most home runs since 2012, with Double-E closing a four home run gap at the start of the season to just one as of June 26th. Nelson Cruz stands third, 18 behind Encarnacion. Driving in all of a team’s 5+ runs with 3 or more hits doesn’t happen too often – by my count, this was just the 126th time since 1913, by 121 different players, including pitcher Wes Ferrell (Aug 12, 1936). This is the 8th straight season with at least one such game, tied with 1966-73 for the most such consecutive seasons. The most times in one season was 5 in 2004, all in the back half of schedule, including three in 5 days and two on the same day (Aug 18). Mike Greenwell has the most RBI in such a game, with 9 on Sep 2, 1996, followed by Bob Johnson (Jun 12, 1938) and High Pockets Kelly (Jun 14, 1924) with 8 RBI.
After getting skunked in this series, the Twins’ home record stood at 14-24 (.368). That’s the 5th worst home winning percentage after 67 games in franchise history; the four worse teams posted a collective .375 winning percentage (equivalent to 61-101) in those seasons (1981, 1982, 1995, 2016).
After the first series, the Twins stayed at home and took 2 out of 3 from the White Sox, while the Indians traveled to Baltimore and won 3 out of 4 against the Orioles, extending their road record to 24-15, a .615 clip that is the franchise’s 9th best mark since 1913 after 71 games. Those results left the Tribe with a 2½ game lead when the second series got underway in Cleveland.
Game 1 at Progressive Field matched Trevor Bauer against Adalberto Mejia. Minnesota got to Bauer for four second inning runs, including a two run blast by shortstop Jorge Polanco. Mejia was steady again this night, holding Cleveland scoreless through 5 innings of 2 hit ball, totals matched by the Twin bullpen over the final four frames. Final score: Twins 5, Indians 0
This was Mejia’s 10th major league start as he became the 43rd Twin to reach that milestone in his first 15 career games. Of that group, Mejia is (so far) just the 6th to allow more walks than earned runs in those starts, but he’s in good company with the likes of Dave Boswell and Scott Erickson. As in the first series, Mejia was relieved by Tyler Duffey who this night turned in two hitless frames, his 10th multi-inning appearance of the season, eight of them scoreless; Tyler’s success in these extended outings is reflected in his pitch counts, exceeding 30 just once in those 10 games. Polanco hails from San Pedro de Macoris in the Dominican Republic (pop. 195,000), and is the fifth shortstop from that city (but first since Jose Offerman more more than 25 years ago) to record 500+ PA before his age 25 season.
Trevor Bauer has had a rocky start to his season, with a 5.53 ERA over 15 starts. Bauer’s 4.56 ERA since 2012 is 9th worst among 94 pitchers with 100 starts over that stretch, but his 22.1% strikeout rate ranks in the top 25 of the group and is the best among those with the 30 worst ERA scores.
Kyle Gibson got the call for the Twins in Game 2, going up against Indian ace Corey Kluber. Minnesota got the early jump with a pair of unearned runs in the first frame, but Kluber shut the door over the next 6 innings, leaving the game with the score knotted at two. With the top of the Twins order due in the 8th, Terry Francona went to closer Cody Allen, who lost a 7 pitch duel with leadoff man Brian Dozier whose solo shot provided the margin of victory. Final score: Twins 4, Indians 2
Francona’s move to his closer in a tie game at home is in keeping with recent practice when a save opportunity is unlikely or impossible. But, anecdotal observation suggests that closers aren’t the same in non-save situations and Cody Allen is no exception. Although his career ERA (2.60 in save situations, 2.56 otherwise) is essentially identical, Allen’s SO/BB ratio in save situations (4.77) is almost double his mark in other games (2.61) with most of that difference due to a walk rate that balloons from 2.73 in save situations to 4.05 otherwise.
Since returning from a month on the DL, Kluber has been his old self, with 5 straight quality starts, including his second shutout of the season. While 200 IP for the fourth straight season is probably not in the cards, 225 strikeouts could be. Kluber is already the first Indian since Sam McDowell with three straight 225 strikeout seasons; a fourth would put Kluber in the exclusive company of Max Scherzer and Clayton Kershaw, among active pitchers, .
This time it was the Twins going for the sweep and they had the right man on the hill for Game 3 with ace Ervin Santana getting the call against Josh Tomlin for the home side. Santana did not have his best stuff, allowing 9 hits over 6 innings, but still held the Tribe off the scoresheet as Cleveland left runners on base in each of those frames. Minnesota also left runners on base in each of their 6 cracks against Tomlin, but still managed four runs, on one run-scoring hit with RISP, and two without RISP. With the starters departed, the bullpens took over, yielding nary a run or hit by either team. Final score: Twins 4, Indians 0
How unusual is a starter posting a goose egg when allowing 9 hits or more in an outing of 6 innings or less? Actually, this was just the 3rd such game by a Twin or Senator since at least 1913, including just one before this century. This was the first time in the past 5 seasons that the Indians have been shutout twice in the same home series, but the first time the Twins have turned that trick against Cleveland since winning both ends of a July 24, 1963 double-header. Minnesota also had a 1-0 win in Cleveland earlier this season, making this the first season since 1945 with three shutout road wins by the Senators/Twins over the Tribe.
After 7 games and 7 wins by the visitors, Minnesota had regained the division lead, but just barely, by only a ½ game. The Twins can thank their 23-9 record in road games, a .719 winning percentage that is a franchise best after 73 games since at least 1913. That’s a good omen for Minnesota as the three of the franchise’s next four best road winning percentages after 73 games all belong to playoff teams, in 1933, 1970 and 1925.
Staying in the AL Central, and continuing a previous discussion about putrid OPS rates, the Royals’ Alcides Escobar has played all 75 team games so far, with 304 plate appearances. He has an OPS of .513 (.233 OBP + .279 SLG) and a measly 34 OPS+.
There have only been 12 player-seasons with at least 550 PA and an OPS+ of 50 or below. The lowest of the low was 24, by Jim Levey of the 1933 St. Louis Browns.
Honourable mention goes to Hal Lanier, who somehow had three consecutive seasons (1967-69) with more than 500 plate appearances and a sub-50 OPS+ while playing for (against?) the Giants.
Re Hal Lanier, I believe the easiest way to getting a reputation as a great fielder is to be a lousy hitter. Dal Maxville? Larry Bowa? Obviously, these guys could field bated balls but did they belong on a major league field trying to hit major league pitching?
I’m a little puzzled by this discussion. Lanier was, in fact, an excellent fielder, and he, Maxville, and Bowa were all positive WAR guys — Bowa even came in third on the ’78 MVP vote, with his WAR among position players justifying that ranking, and he had a terrific Series in ’80 (.375 BA), to help the Phillies win their first ever.
None of these guys was positive in WAA, but they filled roles in ways that provided value on successful teams — Lanier’s Giants came in 2nd for four consecutive years in a ten-team league, and won a divisional championship in ’71; Maxville was on the ’67-’68 Cards; Bowa played short on the strongest teams the Phillies fielded in the 20th century.
I’ve always been a fan of players like that. (If I’d had fielding skills, I would have been a good-field no-hit player too.) The most extraordinary example is Bill Bergen, of the early 20th century Brooklyn teams. Although he was a catcher and didn’t get a full share of PAs, his 372 PAs with an OPS+ of 1 is an outstanding accomplishment. (For those unfamiliar with Bergen, there is no digit missing in that OPS+ figure, but his lifetime figure was 21 times as robust.) As Bill James pointed out in one of his abstracts (which I no longer seem to have), despite the fact that 100% of Bergen’s value was in defense (not only couldn’t he hit, he couldn’t take a walk or steal a base either, and no pitcher was ever fool enough to hit him with a pitch), at some point when an informal MVP vote was taken among league players, Bergen placed in the top ten (I think he was fifth). He brought something important to his team, and even though his teams were lousy, that something was important enough that his contemporaries rated him higher than almost everyone who played on good teams. (I do sometimes wonder, though, whether those voters just had a keen sense of humor.)
E, I am not denigrating Lanier personally, or saying that he didn’t belong in the majors. In fact, I too lament the lack of “good-field, no-hit” players in today’s game, since home run power and walks seem to be the only prized commodities for a batter these days, as opposed to those who can play “small ball” and contribute in those other intangible ways that you mention. This is why I enjoy watching players like Billy Hamilton and Trea Turner, who can transform a game in multiple ways, especially with their speed, positional flexibility and/or defence. This stands in stark contrast to players such as Chris Carter, who seem to possess only one valuable skill (though having finally been optioned to Triple-A, even that singular talent wasn’t enough to save him from demotion).
In short, this research was simply a case of identifying the extreme end of the spectrum, where the 12 players on my list were objectively harming their teams from an offensive standpoint. Escobar’s half-season jumped out at me for this reason.
It’s fascinating to me how the Royals are one of the few remaining teams where a player’s defensive contributions are enough to keep them in the starting lineup. Of course, a lot of that has to do with playing in Kauffman Stadium, which has dictated their personnel choices since they came into existence.
Seems like a high proportion of the “good field, no-hit” types played in the 60s and 70s. At least those that had long careers. Just a quick search using 6,000+ PAs and OPS+ of 80 or less gives 21 players.
Of those 21, nearly half played a significant part of their career in the 60s or 70s: Don Kessinger, Larry Bowa, Mark Belanger, Alfredo Griffin, Tim Foli, Fredie Patek, Ed Brinkman, Roy McMillan, Julian Javier, Aurelio Rodriguez.
Obviously a fair number played in the dead ball era as well. Not so many in the 30s, 40s, or 50s, though that may be because of shortened careers due to the wars.
Three players who played this century make the list: Royce Clayton, Brad Ausmus, and Alex Gonzalez.
Actually Lanier’s career WAR is negative though he did have some positive seasons. (His father, on the other hand was a pretty good pitcher with 29.8 career WAR).
You’re right — I messed up on Lanier’s lifetime WAR. And thanks for noting his father was Max. I’d never realized it. Max was the player most hurt by the Mexican League fiasco, and without it, his career WAR would likely have been over 40.
Among players with 2,000 games played since 1920, Larry Bowa is second worst all-time in ISO. He’s trailing only Don Kessinger (.05999 to .05960). I saw him struggle to such an extent batting left-handed that it appeared he could barely get the ball out of the infield. He probably should have just batted RH his whole career but some scout probably insisted it was necessary to get to anywhere or to play every day.
There was a legion of these guys during that era and they made Fregosi and Templeton look like Wagner and Vaughan.
I’ll always make the argument that a team of poor fielders that can hit will always win out versus teams with great fielders who can’t hit. But, please don’t ask me to prove it.
Pete Rose got an awful lot out of his talent but Bowa might have achieved more than anybody.
sorry, it’s Belanger, Kessinger, and Bowa as THE worst in that order for ISO
There would be a certain irony if the Twins managed to continue this home/road split trend and go all the way.
One of the most disappointing seasons for me was 1987, when the Twins played in the awful “Hubie Dome,” where the noise levels were uncomfortably high, unsettling opponents. Although the Twins were a truly terrible team away (.358), they dominated at home (.691), which allowed them to prevail in a weak division, although the AL East had four teams with better records. After legitimately tripping up a much strong Tiger team in the ALCS, the Twins became champions in the first-ever Series with home teams winning every game. The 4-3 outcome seemed determined solely by the luck of which league was due home field advantage that year. That result had been approached before, with home teams winning the first six games in 1955, 1956, 1965 (the Twins’ only prior Series), and 1971, but losing the seventh (a remarkable pattern that marked that 17-year stretch — it had never happened in the 51 Series’ before 1955, and has never happened in the 45 Series’ since 1971). The Twins repeated an all-home team Series win four years later (the Diamondbacks matched that in 2001), but with a more normal home/away split and a league-leading overall record during the regular season.
This year’s surprising Twins are so far a mirror image of their predecessors three decades ago (.390 home / .676 away). It would be neat indeed if they somehow managed to prevail in a league dominated by stronger teams and wind up, after an NL All-Star win, pulling off the first all-away team winning Series.
Judging by the previous “Marquee Matchup” string, I think Doug may have found a very good format for creating an arena of mixed topical/general discussion forums at about ten-day intervals. With the added mix of headline/stat articles, like Doug’s Bunning or Edinson headline posts and Aiden’s lead-off hitter stat analysis (which was really terrific, and the sort of thing Doug also does very well), I think the Marquee Matchup rhythm can be a good way to keep the High Heat beat going — hopefully without burning Doug out.
Thanks Doug! As an Indians fan, I’ve been looking forward to this write-up!
One small “correction”. Before the first series, Francona announced that Allen and Andrew Miller would be switching roles in the bullpen, though he didn’t say whether it would be permanent or not. And Cleveland hasn’t had many save opportunities since the announcement so it’s not really clear who the closer is at this point (Allen was also gone for a few days on paternity leave).
Also, in some ways the Indians haven’t played that badly. One of the big differences is that this year’s team is 3 games behind their Pythagorean record whereas last year’s team was 3 games ahead. Obviously the big problem was been the starting pitching, which was considered to be the team’s strength going into the season. But with Tomlin, Salazar, and Bauer all struggling (and Kluber missing some time), the Indians may actually have to trade for a starter.
BTW, in the 3 game loss at home, the Indians went 1-23 with runners in scoring position. Their only hit was an infield single that failed to plate a run.
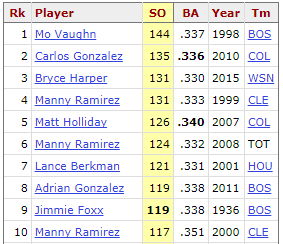
Following today’s game, Lonnie Chisenhall now has 43 RBIs in only 181 PAs (an RBI every 4.21 PAs).
There are only 43 seasons with 175+ PAs and an RBI every 4.30 PAs or better. Only 7 of those seasons took place after 1961, with Juan Gonzalez accounting for 3 of them:
Jeff Bagwell (1994)
Manny Ramirez (1999)
Juan Gonzalez (1996, 1998, and 2001)
Karim Garcia (2002)
Olmedo Seanz (2006)
My apologies to anyone who had wanted to try their hand on my Billy Hamilton-inspired player stats quiz. I hadn’t turned Comments on for that page, but have now corrected that oversight.
You can find the quiz at: http://www.highheatstats.com/player-stats-quiz/quiz-run-wild-run-free/
Doug: The post doesn’t appear on the front page.
Click on Player Stats Quiz and there will be a selection of quiz pages there.
QUIZ: The Nationals currently lead the majors in runs scored per game, just ahead of the Yankees (5.65 vs 5.61).
What is the last NL team to lead the majors in runs scored per game? Name the team and the year.
Hint #1 – It’s not the Rockies. They came close several times but never did it.
Hint #2 – It’s not a team you would expect, nor a year you would expect.
Interesting that NL teams led in runs the first 4 years the DH was in use, but only once since.
While the year or team might not be one you would guess, it was the last of 7 straight years that team had finished 1st or 2nd in its division.
1990 Mets?
Bingo.
In comparing the leading team run totals from one season to the next, the 178 run decline between the 2015 and 2016 leaders was the second highest between seasons of equal length, just two less than the 180 run increase from 1952 to 1953. At their current run production, the Nats or Yankees will blow those marks away with more than a 200 run increase from least year’s 713 leading total by the Red Sox.
Doug: It looks like the Red Sox scored 878 runs in 2016, 13 fewer than the ML leading Jays in 2015. I found the second largest difference to be 146 runs by the 1911 A’s and also by the 1936 Yankees.
Thanks for the correction, Richard. Was looking at an old spreadsheet; I apparently created it at some point last season, so only had incomplete run totals for 2016.
But, I see these season to season differences.
1951 (Dodgers) – 172 run decline from 1950 (Red Sox)
1954 (Yankees) – 150 run decline from 1953 (Dodgers)
At first I just looked at the increases. My second look also showed the declines that you found.
Wow, very well done! How did you get that????
You can get Team level stats from FanGraphs.
Well I was replying to EPM. I’m assuming he guessed the answer without looking at any stats. Looking at the team stats would kind of make the quiz pointless.
Well, I confess I looked before I wrote. But I only looked to be sure of the last year of the Mets’ streak, taking Doug’s hint, and then checked that they had, in fact, led both leagues in R/G in 1990. It was a lucky guess to start with the Mets nevertheless — I’m not good at that sort of thing after 1969.
The Judge is now on pace for
395 Total Bases and
203 Strikeouts
That is ridiculous.
Most TB with 200+ SO:
370 … Chris Davis
331 … Ryan Howard
323 … Big Donkey Dunn
322 … Davis
314 … Mark Reynolds
309 … Howard
299 … Dunn
293 … Curtis Granderson
275 … Dunn
274 … Chris Carter
____________________
More ridiculous is his .330 batting avg.
Highest BA with 190+ whiffs:
.286 … Davis
.275 … Kris Bryant
.268 … Howard
.266 … Dunn
.262 … Davis
.260 … Reynolds
.260 … Dunn
.251 … Howard
.243 … Drew Stubbs
.239 … Reynolds
.239 … Mike Napoli
Voomo, I think your first list is for 190+ K too.
Judge had 4 more bases yesterday (on a laser beam HR to centre) and 3 more strikeouts. The ridiculousness continues…
Yes, 190. Thanks.
And, most strikeouts with a .330 BA.
These players also had seasons with lots of strikeouts and home runs. But, unlike Judge, their big years included what other accomplishments?
1. Frank Howard
2. Harmon Killebrew
3. Jeff Bagwell
4. Mickey Mantle
5, Darrell Evans
6. Carlos Delgado
7. David Ortiz
8. Mark McGwire
9. Jose Bautista
10. Hank Greenberg
100 or more walks?
That’s part of it.
The rest is that only these 10 had a 40 HR/100 strikeout season (each had one) with neither walks nor RBI lower than strikeouts.
Here’s a theoretical…
Which player is more valuable?
(or) Which player is more potentially valuable?
Player A and Player B each play 150 games, with 600 PA.
Player A hits
125 Home Runs, and Strikes Out the other
475 times
Player B hits
333 Singles, and the other
267 PA he makes out in a league average assortment of balls in play and SO.
_____________
Each of their slash lines:
Player A
.208 / .208 / .833 / 1.041
500 Total Bases
Player B
.555 / .555 / .555 / 1.110
333 Total Bases
Voomo: No walks?
I think the answer depends in large measure on what kind of teams the two play on, but given average teams it seems impossible to me that the slugger would be as valuable as the bingles player, since, while he might drive in quite a few runs, in the neighborhood of 200, that would only be 75 more than he scored. Someone batting .555 is almost certain to drive in over a hundred runs and score well over a hundred. He also is going to put more stress on the opposition by being on base a lot.
In 1897 Willie Keeler hit .424 with no HRs, scored 145, drove in 74, probably batting leadoff, producing 219 runs. In 2001 Ba Bonds hit 73 HRs with 36 on base producing 109 runs from his dingers. Keeler had 618 PAs, Bonds 664, and, true, Bonds walked 177 times, but he was only driven in 56 times. And besides, we’re leaving walks out of the hypothesis.
I agree NSB. In fact, the difference between the two seems quite extreme. Baseball Musings has a batting order analyzer where you enter the slugging % and the OBP of each person in the lineup. The analyzer then tells you how many runs per game that batting order would score. A lineup composed of 9 Player A’s would score 6.4 runs a game whereas a lineup up 9 Player B’s would score 10.0 runs a game. So if you divide the 3.6 run difference by 9, that gives you 0.4 runs per game more via Player B. Or 65 runs over a full season.
This dovetails in a roundabout way with a stat I was going to post tonight: Russell Martin is currently batting .217 with a .368 OBP in 228 plate appearances. Searching the PI for seasons with 300+ PA, a batting average at or below .220 and an on-base percentage of .370 or above yields just three instances, in 1951, 1952 and 1976. Lowering the OBP threshold to .360 nets only ten more, and none since 1993 (the immortal Lance Blankenship).
Martin would be a hybrid of Players A and B, with far less power, obviously.
A footnote on Blankenship: I searched careers with at least 1200 PA, a batting average <=.230 and an OBP of .370 or greater. There were only three matches: Blankenship, Wes Westrum (retired in 1957) and Joc Pederson.
Dropping the OBP all the way down to .320 creates 19 matches, including Gorman Thomas, Kevin Maas (the once and future king of New York), Rob Deer, Mark Bellhorn and Chris Ianetta. This is certainly a recent phenomenon: only six careers ended before 1978.
Martin is more akin to Westrum and Jimmy Wynn. Of 8 seasons of 300 PA and OBP 80% greater than BA, those two have the only slugging percentages close to their OBP (Adam Dunn was also close, but his OBP was way below any of the others). Only Wynn posted a qualified season of these eight, with Westrum (and Dunn) a few PA short.
– Tony Smith (1910) .181/.329/.227
– Jimmy Sheckard (1913) .194/.368/.238
– Eddie Lake (1949) .196/.359/.254
– Wes Westrum (1951) .219/.400/.418
– Dennis Menke (1973) .191/.368/.270
– Jim Wynn (1976) .207/.377/.367
– Lance Blankenship (1993) .190/.363/.254
– Adam Dunn (2011) .159/.292/.277
Interesting stuff, Doug; I remember that Dunn season being quite the aberration, and that the Sox management decided to pull the plug on his season before he hit 502 plate appearances.
I tried to replicate your PI search for another question that popped into my head, but I couldn’t see a category where you can choose the number of different seasons (beyond First 5, Last 5, etc.) that a player reached certain criteria. Is that only for subscribers?
You can choose Find Players with Seasons Matching Criteria, and choose a Range of Seasons if you’re just interested in a certain part of a player’s career. The results are shown in order specified (ascending or descending) based on number of matching seasons in the specified portion of the career.
Ah, that worked. Thanks!
In the linear weights assessment that lies behind WAR, I think a HR is calculated to be worth about about 2.2 singles (varying by league environments). That would give player B the edge here.
But I’d suppose the value of each would vary according to the nature of the team he was on and how he was deployed in the batting order. For example, to use extremes as Voomo has used, if the three prior batters never got on base, only Player A would have value; on a team that always set the table with loaded bases, Player A would generate 500 runs and Player B (assuming a single brings in two) would generate 666 (in this case a lucky number) — but if all Player B’s singles were spinning nubbers to the mound (or outfielders knew they could always play in on him), he’d be worth only half as much.
Hmmmm. My negative hypothetical about Player B was careless (the following batters would also have to make outs, and if Player B stole his way home often enough . . .). But the general point about context should still hold.
The singles guy creates more runs by the simple calculation of OBP x TB but it seems redundant in the sense that neither one of these guys take a walk and the entirety of their production is their hits – sort of George Sisler versus Dave Kingman…. I imagine you could knock in a lot of runs batting 3rd or 4th with 333 singles
Paul E: I’m late for the party here but I was on vacation for a couple of weeks. I tried doing an analysis to see how many RBI would result due to 333 singles. I used the Event Finder for the 2016 season for players batting third or fourth. There were 6294 singles total, of which 1624 were with ROB. I then ran the PI with RISP and determined that the number of RBI with RISP to be 1450. I used RISP rather than ROB to shorten the analysis. A runner scoring from first on a single is very rare. 1450 RBI with 6294 singles calculates to .230 RBI per single. Accordingly, 333 singles would produce only 77 RBI. Hope I did this right.
1-2 in the AL in slugging percentage are Aaron Judge and Jose Ramirez. Judge, of course, is 7’8, 525 pounds whereas Ramirez is 4’6, 110 pounds.
Okay, not quite but there is quite a size difference between the two with Judge being nearly a foot taller and listed at over 100 pounds heavier.
Ramirez, by the way, has done the following over his last 23 games (103 PAs):
.448 BA, .485 OBP, .906 SLG, 1.392 OPS.
14 doubles, 3 triples, 8 homeruns, 18 RBIs, 27 runs scored.
Only 6 Ks.
Apropos of nothing in particular:
The weights given for players are often deceptive. Sammy Sosa is listed at 165, which he probably was as a rookie, but not when he was belting 50+ performance enhanced dingers a year. Bonds ditto. Out of curiosity, I skipped through the 50 HR club, and it seems likely that Willie Mays was the smallest member, 5′ 10″ and 170, although he was more like 185 when he hit his 51 and 52. Mantle comes next, listed at 5′ 11″ and 195, which was pretty accurate. If Judge makes 50, and his chances are good, at 6’8″ he’ll be the tallest by 3″ over Mark McGuire and about as heavy at 275 as 5’11” Prince Fielder.
Cody Bellinger. I don’t pay much attention to the Dodgers, but this early season call-up now has 24 HRs in 280 PAs—for the Dodgers, remember—putting his HR % at .086, while the monster Judge’s stands at .082 (29 in 352). Bellinger also out-whiffs the Judge, slightly—83 SOs in 280 (.296) vs 104 in 352 (.295). Bellinger’s BA is .258 with 30 walks, while Judge is at .331 with 59. Bellinger, however, is just 21 years old. Judge is 25.
Any prognostications on Bellinger’s future?
In a word, excellent!
These are the only 25 HR rookie seasons aged 21 or younger. Not a dud in the bunch.
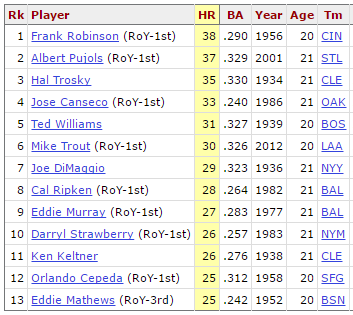
interesting list: None hit 50 HRs in a season. Four were rookies in the 1930s, three in the 1950s—but not Mantle, Mays, or Aaron—three in the1980s. Pujols is HOF for sure, Trout if he doesn’t suffer catastrophe. Otherwise, only Trosky who had a truncated career, Keltner, very good but not great, and Canseco whose career is impossible to judge, aren’t Hall worthy.
NSB, are you saying that Strawberry is worthy of the Hall? All personal issues aside, none of his numbers are up there with the all-time greats. Considering his impressive rate stats, it seems to be more a case of “what might have been” than anything else.
Oops. No way Strawberry fits that description. I simply overlooked him in my comment. To me he was never more than a slugger who didn’t live up to his potential, a better model of Dave Kingman—both were 6’6″ and lean and played for the Mets—took more walks, fielded better, hit for better average, stole some bases. Kingman lasted longer.
NSB,
I believe Dave Winfield is a better comp for Strawberry…..at least for Strawberry through age 29. The difference between Kingman and the two other guys is that Kingman could hit home runs and couldn’t do anything else well – batting for average, base running, fielding, etc….
Through Strawberry’s first 5,137 PAs and Winfield’s initial 5,549, Strawberry accumulated 40 WAR, Winfield 38. Their OPS+ numbers are 144 for Strawberry and 135 for Winfield. They were both 6’6″ and lean as well.
But, as life so often tells us, cocaine is a tough opponent. As Robin Williams used to say, “Cocaine is God’s way of telling you that you’re making too much money”.
You gotta lighten up, Paul. To me Strawberry wasn’t at all like Winfield, despite the numbers. And he didn’t play for the Mets.
With their loss today, the Phillies have a record of 28-58. That’s pretty bad, but since 1900, they have started out worse than that 11 times, most recently in 1997 at 24-62. Their worst after 86 decisions was 21-65 in 1941.
Clayton Kershaw goes into the break 14-2 with a 2.18 ERA
Most of his other numbers are in line with his usual greatness:
.877 WHIP
6.4 H/9
7.23 SO/W
Here’s where it gets weird…
He’s already set his career high for Home Runs allowed, with 18.
And he’s allowed 94 hits.
That’s a HR per every 5.22 hits
The lowest ERA in a season of at least 100 IP, and less than 5.5 Hits per Homer:
2.18 … Kershaw (in progress)
2.92 … Tony Cingrani
2.93 … Sid Fernandez
2.96 … Max Scherzer
2.97 … Robbie Ray (in progress)
2.99 … Ervin Santana (in progress)
3.12 … Pedro Ramos
3.37 … Pete Richert
3.40 … Dave Boswell
3.43 … Jack Meyer
3.46 … Chris Young
Kershaw’s 2017 is the only PI-searchable season where the pitcher qualified for the ERA title and his home runs allowed was greater than half of the total runs he allowed.
Kahuna, I did some PI searches a couple of years ago on this same topic, but with relievers. There have been 29 player-seasons with 50+ innings, 80 percent of appearances in relief, and home runs making up 50% or more of total runs allowed. Koji Uehara has three of those seasons (2011 & 2013-14), with a matching 36 IP season in 2012. No one else has done it more than once; K-Rod came closest with 68 IP in 2014 and 46.2 innings the year before.
So of course, Uehara has given up just one homer out of the 11 runs he has surrendered so far this year. His career postseason stats? 18 IP, 6 R, 4 HR.
Very nice work, Daniel!
Here’s another Uehara tidbit. Both Craig Kimbrel and Kanley Jansen, in their 37⅔ innings pitched so far in 2017, have WHIP rates lower than the full-season .565 Uehara posted in 2013—in 74⅓ IP. No pitcher with more than 37⅔ IP in a season has ever posted a lower WHIP than Uehara’s.
Good stuff, KT. One more nugget: relievers that tossed 40+ innings, gave up fewer walks than homers, and had an ERA under 3.00:
Don Mossi (1964)
Dennis Eckersley (1989, 1991)
Mike Timlin (2002)
Koji (2011, 2014)
Edward Mujica (2013)
I feel that Uehara’s career is unique, and still overlooked, despite the praise he got for his performance in the 2013 postseason. Began at age 34, still productive at 42, otherworldly K/BB ratios, etc.
Open question: has anyone racked up more pitching WAR (14.1) in a career that started at 34 or later? Satchel Paige only had 10.3 (with extenuating circumstances, obviously).
Okay, just one more: all pitchers with more than 500 career IP and a WHIP below 1:
Addie Joss (0.968)
Ed Walsh (0.9996 – 2963 walks + hits/2964.1 innings)
Billy Wagner (0.998)
Clayton Kershaw (0.998 – active)
Uehara is currently at 467.1 innings.
Only one pitcher stands ahead of Uehara.
Johnny Niggeling started his career in 1938 at age 34. He pitched until age 42 in 1946 and compiled 17.7 WAR in 1250 IP with a nice 3.22 ERA (114 ERA+).
Bang on, Doug. Maybe someday, I can pose a question that will stump you for more than 45 minutes!
Two other hurlers who missed the cut for different reasons: Hirodi Kuroda had 19 WAR from age 34 on, but began his career one year earlier. Takashi Saito racked up 10.5 WAR from age 36-42, and could have challenged Uehara’s total with two more years under his belt. Pitchers from South Korea and Japan often have an interesting career arc.
Also, I should have mentioned in the post above that Koji’s career WHIP is currently 0.877.
Niggeling’s other noteworthy accomplishment is finishing his career with a complete game win. At 43 years, 53 days, he’s the second oldest to do that, 11 days younger than Sad Sam Jones in 1935.
Warren Spahn, at 44 years, 142 days, is the oldest with a complete game win in the final start of his career.
Lowest ERA with 150+ IP and 5 or fewer hits per homer: 3.46 by Chris Young with the 2006 Padres.
Gene Conley died on July fourth. An All-star pitcher for the Braves and Phillies in the 1950s, he was on four world champion teams, but only one in baseball, the 1957 Braves. As a back-up forward for the Celtics he featured in the NBA finals for the winners in 1959, 1960, and 1961. At 6’8″ he was the tallest known big-leaguer for a long time. In the NL ROY voting for 1954 he finished 3rd behind winner Wally Moon and Ernie Banks, but ahead of teammate Hank Aaron. His 4.1 WAR was the best among the four.
Conley is one of 48 pitchers with 1000 IP as a starter since 1950 and decisions in 80% of his starts. Only four of those pitchers have been active in the past 25 years, including only one current pitcher, Adam Wainwright.
A few A-S game notes.
– First game with two 34 year-olds homering.
– Sixth time both teams have homered when tied or trailing by one run in the 6th inning or later. Previous were in 1941 (Arky Vaughan and Ted Williams), 1954 (Gus Bell and Larry Doby), 1967 (Brooks Robinson and Tony Perez), 1972 (Hank Aaron and Cookie Rojas) and 1997 (Javy Lopez and Sandy Alomar).
– Kenley Jansen becomes second NL reliever to balk. First was Stu Miller in 1961.
– 10 hits by the AL are the most by a winning team scoring 2 runs or less
– Both starting third basemen went 2 for 2. It’s the first time that both starters at any position had two or more hits and no outs.
What caught your eye in tonight’s game?
Here are some BA/OBP/SLG breakdowns by league for all 88 All-Star games via the PI Event Finder:
American League
Total_________0.246 0.306 0.389
Bases empty 0.259 0.323 0.399
Runners on 0.230 0.286 0.377
RISP_____ 0.227 0.292 0.367
National League
Total________ 0.244 0.297 0.393
Bases empty 0.239 0.288 0.383
Runners on 0.252 0.310 0.408
RISP_____ 0.235 0.308 0.352
Interesting the differences between the leagues with men on or not. Those differences seem quite large given how close the other measures are.
Some notes on teams at the break:
Since the 2016 All-Star break, when they led the NL West by 6 games, the Giants have gone 64-108.
The Cubs were 53-35 a year ago. Now they’re 43-45. The Rangers were 54-36, basically the same record as the Cubs. Now they’re also 43-45, but no one seems surprised, except possibly in Texas.
The most improved team isn’t Houston despite their gaudy record, or Minnesota who’ve become possible contenders. It’s Arizona, with a fifteen game turnaround from 38-52 a year ago to 53-36.
A year ago Baltimore led the AL east by 2 over the Red Sox, who won the division. Cleveland led at mid-season and the end in the AL Central, as did Texas in the West, the Nationals in the NL East, and the Cubs in the NL Central. In the NL West, the Giants dropped from 6 ahead to four behind the Dodgers at the end.
This year Houston has a commanding lead at the break and Washington and the Dodgers are comfortably ahead, with teams than seem capable of maintaining those margins. The other three divisions are closer, so . . . any prognostications about whether the Yankees can catch fire again and top the BoSox? The Cubs—can they overcome their spluttering first half to pass the vulnerable Brewers? Cleveland—can the Tribe hold off what should be the remains of a weak division? Or is this the year without a pennant race in all six divisions?
Biggest drops in batting average 1st half vs 2nd half since 1913, minimum 100 AB in each half:
Curtis Goodwin 1995, .363 and .175, 188 points
Brennan Boesch 2010, .342 and .163, 179 points
Don Slaught 1990, .382 and .206, 176 points
Ryan Hanigan 2009, .338 and .165, 173 points
Calvin Chapman 1936, .325 and .157, 168 points
Chuck Hiller 1966, .380 and .214, 166 points
Jack Saltzgaver 1934, .381 and .216, 165 points
Mickey Vernon 1957, .308 and .144, 164 points
Dave Bancroft 1929, .336 and .174, 162 points
Hal Wagner 1943, .326 and .166, 160 points
Was expecting to see Roy Smalley’s 1979 season but he just missed the cut: .341 and .185, 156 points.
Smalley’s monthly batting averages are….indescribable:
March/April: .382
May: .392
June: .347
July: .217
August: .200
Sept/Oct: .145 (!)
That’s not a slump. That’s a headfirst dive off of a cliff! And he was never benched that whole time, Twins kept running him out there every day.
Thanks for posting those Roy Smalley’s monthly numbers, pretty amazing.
Here’s another list in order of most unlikely to occur poor 2nd halves by chance given overall BA. Smalley tops this one.
Roy Smalley 1979 .341 and .185 (340 and 281 AB), 156 points, z-value -3.23
Brennan Boesch 2010, .342 and .163 (243 and 221 AB), 179 points, z-value -3.19
Carney Lansford 1988 .331 and .185 (356 and 200 AB), 146 points, z-value -2.96
Fred Haney 1923, .352 and .200 (273 and 230 AB), 152 points, z-value -2.77
Dave Bancroft 1929, .336 and .174 (226 and 132 AB), 162 points, z-value -2.63
Derek Bell 2000, .318 and .187 (327 and 219 AB), 131 points, z-value -2.63
Ken Walters 1960, .300 and .158 (243 and 183 AB), 142 points, z-value -2.57
Curtis Goodwin 1995, .363 and .175 (135 and 154 AB), 188 points, z-value -2.47
Jermaine Dye 2009, .302 and .179 (291 and 212 AB), 123 points, z-value -2.39
Mickey Vernon 1957, .308 and .144 (159 and 111 AB), 164 points, z-value -2.38
Don Lock 1966, .288 and .153 (229 and 157 AB), 135 points, z-value -2.38
A few other seasons of note:
Gorman Thomas hit .261 in 111 AB the first half of 1975, but just .109 the 2nd half in 129 AB.
Ted Kubiak in 1976 had a drop of 198 points in the 2nd half (.320 and .122), but didn’t qualify with only 90 2nd half AB.
Fred Nicholson in 1921 had a drop of 183 points in the 2nd half (.399 and .216), but just missed the cutoff with 97 2nd half AB.
The famous one for home runs was Reggie Jackson in ’69. His 37 in the first half (91 games) but only 10 in the second (61 games).
Mickey Vernon, the best player in this list except, arguably, Bancroft, was notorious for his ups and downs early in his career, but after he got his health sorted out he was a remarkably steady player for the six years from 1953 through 1958—except for the season you note here, 1957. One: he didn’t start a game until well into May, the Red Sox having decided, I’d guess, that they wanted to try someone younger at first base. Vernon was 39. When he did get into the lineup he batted well for a couple of months, but when he slumped he was relegated mostly to pinch hitting for a few weeks—something he never did well—and when he did get back in the lineup he still slumped.
Traded to Cleveland over the winter he batted a solid .293 in 1958, OPS+ 124, in a swan song 40th year.
As for Bancroft, his falling off in 1929 at age 38 was basically the end. In 17 ABs in 1930, he managed one hit. End of career.