
As the 2017 season heads into the home stretch, here’s a look at some of the junior circuit’s more unusual team accomplishments, both good and bad. More after the jump.
AL West
The Astros have a shot at becoming the first team with 10 players having 15 home runs, needing just one more from Brian McCann and Carlos Beltran, and three by Josh Reddick. Houston could also have 6 players record a qualified season (modern definition) with 120 OPS+, tying the record held by four teams, most recently the 2009 world champion Yankees. Super utility man Marwin Gonzalez has already become the first player with two seasons of 15+ games at 1B, 2B, 3B, SS and the outfield; both of those seasons (the other was in 2015) featured 15+ games in LF, making them the only seasons since 1901 with 15+ games at 1B, 2B, 3B, SS and any one outfield position.
The Rangers already have 9 players with 15 home runs, tying the record set by the 2005 Rangers, 2005 Indians and 2012 Yankees. Unlike the Astros, it’s pretty unlikely that the Rangers will break that tie. But, they could become the first team with eight 20 home run players, breaking the mark of 7 held by 5 teams, including that same 2005 Rangers’ club. If outfielder Nomar Mazara reaches 20 dingers (he needs three more), he would join teammate Rougned Odor to give the Rangers two players with two 20 home run seasons aged 23 or younger, accomplished previously only by the 1978-79 Braves with Dale Murphy and Bob Horner.
The Angels are challenging for a wildcard spot with only one batter (you know who) with 115 OPS+ in 400+ PA, and no pitchers with 115 ERA+ in 100+ IP. No such team has previously qualified for the post-season.
The Mariners are also in the wildcard hunt, despite already using 17 different starting pitchers, a franchise record (and tied with the 1969 Seattle Pilots for the city record). No such team has previously qualified for the post-season.
For the second year in a row, Oakland has gone to a greybeard to fill in a rotation otherwise composed principally of pitchers in their twenties. Last year it was Rich Hill, and this year 36 year-old Chris Smith got the job after Sonny Gray departed for the Yankees. One more start for Smith will make him the oldest pitcher since Connie Marrero in 1950 to start 10 games in his first season with a start, and the oldest ever to do so among those with prior major league experience.
AL Central
The Indians need two more home runs from Michael Brantley (due to return from injury in mid-September) and one from rookie Bradley Zimmer to field a lineup with the principal starter at each position (including DH) having double-digit home runs. Only the 1998 and 2012 Yankees, and 2004 Rangers have previously accomplished the feat, with an honorable mention to the 2000 Orioles with 10+ homers from players at each position, but one of those (first baseman Chris Richard) not the principal starter.
The Royals have two players (Alcides Escobar, Alex Gordon) on pace to post a qualified season (modern definition) with OPS+ under 60, a first for an expansion era team. Gordon currently has fewer total bases than games played, a feat previously accomplished in a qualified season by only eight live ball era outfielders (most recently, Gregor Blanco in 2008), all of them in the expansion era.
Minnesota already has 5 players aged 25 or younger with 100 games played, the most since their 1985 club that two years later claimed a World Series title. By the end of the season, the Twins could have 10 players (any age) with 100 games and 400 PA, a new franchise record.
Detroit has fielded only one position player in his age 24 season or younger, third baseman Jeimer Candelario who played one game in August after his acquisition from the Cubs. That one game is almost the fewest for such Tiger players in the first 125 games of the season (i.e. before September call-ups); only the 1960 and 1969 Tigers had no such players, as their only under-25 position players those years were September call-ups Dick McAuliffe (1960) and Wayne Redmond (1969).
The White Sox have no pitchers with more than 7 wins, and none currently on the roster with more than 3 wins. This will be just the second Sox team without a double-digit game winner and first since 1948. One more start by Mike Pelfrey and three by James Shields will give Chicago four age 30+ pitchers with 20+ starts (the most since 1958), including three aged 33 or older (tied for the most since 1934). Somehow, I don’t see this team matching the 1958 club by taking the pennant next year.
AL East
The Red Sox have so far used 10 different players at third base, one short of the franchise record set in 2000. The 1901 Pirates, 1972 Athletics and 2015 Dodgers are the only teams to win a pennant or division while fielding as many as 10 third basemen.
For the fourth season in a row, the Yankees may have no more than one player reach 30 doubles (Chase Headley this year; Didi Gregorious just pushed his total to 25, so he could still join Headley). If Didi doesn’t make it, this would be the first four-peat for New York since running off six such seasons from 1978 to 1983 (even with a full season in 1981, Dave Winfield would very likely have been the Yankees’ only 30 double man that year).
The Rays‘ Brad Miller is currently the franchise’s first player with a season walking in 17% of 350+ PAs. Unfortunately, Miller’s current .186 BA will easily eclipse Jim Wynn‘s 1976 mark of .207 for the lowest BA in such a season.
The Orioles have had their starters pitch fewer than 60% of the team’s innings, a franchise record low, and 10th lowest mark among all teams since 1913. Not surprisingly, the starters’ 5.58 ERA is more than three-quarters of a run higher than the overall team ERA, also a franchise record high deviation, and second worst among all teams since 1913.
The Blue Jays‘ starters have also struggled, with an ERA currently 0.99 runs higher than one season ago. That ERA jump threatens to eclipse the franchise record one season rise of 1.00, set in 1999 after Roger Clemens‘ departure from Toronto. The year-over-year record that will almost certainly fall is starters’ W-L%, currently 196 points lower than last season’s gaudy .617 mark; Toronto’s largest previous one season change was a positive one, jumping 106 points from 1981 to 1982, the latter season highlighted by Dave Stieb and Jim Clancy combining for 78 starts, over 550 IP, 30 CGs and 8 shutouts.
Astros vs Rangers: All those guys on both teams with double digit HRs, but Astros: BA .284 (1st in league), OPS+ 127; Rangers BA .248 (11th), OPS+ 98. Ranger 2nd baseman Odor—I’m not touching this one—has 28 HRs and an OPS+ of 69. If that’s not some kind of record it has to be close.
Currently the lowest OPS+ for a batter with 28+ HR is 81 by Tony Batista (32 HR) in 2004.
And the most HR with OPS+ under 70 is 21 by J.P. Arencibia (59 OPS+) in 2013.
Most with OPS+ under 80 is 26 by Aaron Hill (78 OPS+ in 2010) and by Tony Batista (73 OPS+ in 2003).
As a Jays fan, that all 4 of those guys played for the Jays when they “did” it…retrospective ouch.
Aweb, guess you can also cringe knowing that Kevin Pillar is now just the second CFer with consecutive seasons of 35 doubles and OBP below 0.333. The first (and leader with 3 such seasons total) was Vernon Wells in 2009-10.
Good add-on nsb.
Quantity or quantity with quality.
What I find interesting is that the Yankees are currently 9 games below their Pythagorean record (not counting last night’s game which isn’t yet in BR).
Not sure a Yankees teams has ever finished that far below their Pythagorean record. And (if memory serves me correctly), they’ve played above their Pythagorean record for something like 22 or 23 of the past 24 seasons.
The 1966 Yankees were also 9 games under their Pythagorean level. Apart from that, the closest was 8 games under in 1975.
In last night’s game against Toronto, Tiger third baseman Nick Castellanos hit a grand slam and started a round-the-horn triple play.
I’m going to guess he’s the first player to do those two things in the same game.
Pujols famously did it in his first college game.
Actually, Castellanos was in right field yesterday, so it was “only” a team feat for the Tigers to get a GS and TP in the same game.
Tim Anderson and Matt Davidson of the White Sox have BB/K totals of 13/135 and 17/145, respectively.
Only Mike Zunino of the 2014 Mariners has had 17 or fewer walks and 125 or more strikeouts in a season.
Davidson and Anderson’s K/BB ratios are currently 8.53 and 10.38. If they maintain that rate, they would become the first teammates with at least 100 strikeouts and 8 or more whiffs per walk.
The White Sox have set a team single season record for most homeruns leading off the game, including the bottom of the 1st when at home.
The Astros have 23 such home runs this year and last. Previous team record in any two year period was 14.
Jordan Montgomery is working on joining some company that is both elite, and a sign of the times.
He’s the 16th pure rookie under the age of 25 to have a SO/9 over 8.5 (with 135+ innings).
Only twice was it done before 1984.
2017 … Montgomery
2015 … Carlos Rodon
2015 … Noah Syndegaard
2013 … Jose Fernandez
2011 … Michael Pineda
2007 … Tim Lincecum
2003 … Brandon Webb
2001 … Roy Oswalt
2001 … CC Sabathia
1999 … Tim Hudson
1998 … Kerry Wood
1986 … Bobby Witt
1984 … Clemens
1984 … Gooden
1969 … Tom Griffin
1955 … Herb Score
_____________________
Some good company, and a lot of what-if’s.
Masa Tanaka did it at the age of 25, just missing this very specific list. With him, the list would include 4 of this year’s NYY opening day starters (the 5th sporting a 10.8 SO/9 at the age of 23, in his 3rd year)
Griffin led the majors with 9.6 SO/9 in his rookie season. Pitched almost 1500 IP in his career, but never reached 8.0 SO/9 again. Wildness was his issue with 4.6 BB/9 for his career and only one qualified season below 4.0 BB/9.
50+ career home runs, more home runs than walks:
Bill Schroeder (61 HRs, 58 BB)
Todd Greene (71, 67)
Rougned Odor (86, 84)
Jonathan Schoop (88, 76)
Interesting that two of them are active AL second basemen. Of course, Odor is right on the borderline. But Schoop? He’s in a league all of his own.
Gary Sanchez has now played 161 games in his career.
50 HR
125 RBI
352 TB
Only Rudy York (55) and Mark McGwire (51) have more home runs over first 162 career games.
125 RBI is T-14th most over first 162 games. Only expansion era players above Sanchez are Braun (134), Pujols (133) and Longoria (131).
352 TB ranks T-15th. Only expansion era players with as many are Braun (401), Garciaparra (373), Abreu (366), Pujols (364) and Cepeda (352).
How do you search for that? If it is possible with the P-I, I’ve not found it.
Game Finder, First 162 games of career. With something (HR, RBI, TB or whatever) greater than or equal to 1.
Then sort the search result by the something. One caution: you may need to look at multiple pages as the original sequencing is by no. of games (Sanchez was on the second page for no. of games for TB, even though he made the top 15 for TB in aggregate).
Not to be finicky, but Orlando Cepeda’s first 162 games played occurred before expansion by a couple of years.
True enough. But I still think it’s fair to call him an expansion era player.
Tyler Olson has pitched in 20 games and given up 0 runs.
Current seasonal record for most appearances with 0 runs allowed was set by Eric Gunderson in 1994 with 14 games.
Granted Olson is a LOOGY so he’s only thrown 13.1 innings in those 20 appearances. But he’s not too far from the seasonal record for most innings pitched with 0 runs allowed. That record – 18 innings – is famously held by Karl Spooner who threw 2 complete game shutouts at the end of 1954 for the Dodgers.
I imagine Spooner holds all sorts of records as a result of those two games: most K’s in the first two games or 18 IP (27); fewest XBH (0); highest average Game Score in first two games (90.5) . . . perhaps fewest hits in first 18 IP for a starter (7).
His better game was the first, and it was against the pennant winning Giants, but the race was over and Durocher pulled key starters like Dark and Mays after a few innings (I wonder whether Mays ever gave way to a pinch runner again in his career), so it was really mostly the Giants’ B-team. The second game was against the cellar dwelling Pirates. Still those are stunning games – especially for a lifetime 10-6 pitcher: one off-kilter spring training pitch and a phenomenal career was stillborn.
David, Harry Coveleski pitched 20 scoreless innings as a rookie for the 1907 Phillies. All of those were in relief.
Daniel – My comment was related to runs allowed. Coveleski did indeed give up 2 runs in his rookie season, albiet of the unearned variety.
Ah, thanks for clarifying; I searched for ER allowed out of habit.
Longest scoreless seasons of any kind, other than Spooner’s sizzling start:
15.1 – Bob McClure, 1975 Royals
15.0 – Dave Ford, 1978 Orioles
15.0 – Vicente Palacios, 1990 Pirates
14.0 – Evan Scribner, 2016 Padres
13.1 – Ken Brett, 1980 Royals
13.1 – Olson
Brings to mind the movie “Bobby” (that I watched recently) and its reference to Drysdale’s 6 consecutive shutouts, the last at Dodger Stadium on the night of Kennedy’s assassination (two days later, Bob Gibson started his run of 5 straight blankings).
Drysdale had only two more shutouts the rest of his career; the last is illustrative of how pitcher care has changed as Double-D went the distance against the Padres, a game LA led 16-0 after 5 innings.
A small footnote: Toronto’s Carlos Ramirez has begun his big-league career with 9 scoreless innings. His season began in Double-A, before advancing to Triple-A. Combined, he tossed 37.2 innings in the minors without allowing an earned run (2 unearned).
That’s 9 scoreless innings allowing a grand total of one hit. Ramirez is the 13th pitcher (in a group that also includes Aroldis Chapman) since 1913 with no runs and no hits in a relief appearance of one inning or more, in 5 of his first 6 games.
But a long way to go to catch Brad Ziegler with 29 games and 39 scoreless IP to begin his career. Ziegler, incidentally, last year became only the fourth pitcher aged 35+ to record a pair of 200 ERA+ seasons of 60+ IP with zero starts (that’s Mariano with 6 seasons, and Ziegler, Takashi Saito and Larry Andersen each with two).
Further to that group of 13 that Ramirez just joined, one of the 13 split his first 6 games between two teams; after one game with Toronto, Gary Glover was traded for Scott Eyre who had a similar streak to close his career, with six consecutive scoreless World Series relief appearances incl. in his final season, tied with 5 others for the second longest streak to close a WS career, trailing only Jeremy Affeldt with 7 games.
Interesting add-ons, Doug. Thanks!
It’s now 6 out of 7 games for Ramirez with 1+ IP, zero runs and zero hits.
That shrinks the group of 13 down to 3. One more game and Ramirez will be in a group of one.
I’d forgotten that Drysdale as well as Koufax retired early with arm problems. Managed only 62.2 IP in 12 starts the following year–including that CG.
Carlos Ramirez’s streak ended unceremoniously tonight. Hadn’t pitched in 6 days and it showed: one inning, 4 runs on 3 hits, incl. 2 HR.
I came here to post the same thing about Ramirez, Doug, but Olson’s streak is alive and well at 16.2 innings (and 25 appearances).
Pitchers since 1917 with 30+ IP and a career ERA under 2 (all are currently active):
Craig Kimbrel – 466.1
Carson Smith – 85.1
Alex Reyes – 46.0
Josh Hader – 40.2
Dalier Hinojosa – 35.2 (now playing in Cuba??)
Ryan Merritt – 31.2
Ubaldo Jimenez has tossed 129.2 IP with a 6.80 ERA. Just 14 other hurlers have thrown that many innings with an ERA of 6.80 or higher, and only 7 exceeded 150 IP.
This is another recent phenomenon: four seasons happened from 1930-37, then the rest have occurred since 1994.
In addition to their 19 game winning streak, the Indians have an 18 game streak of giving up 4 of fewer runs. There are 2 other teams with 18 game streaks, two with 20 game streaks, and one 23 game streak. One of the 20 game streaks took place in 2002 though the A’s don’t appear to be the team with that particular streak.
Actually this doesn’t seem to be correct. What I wrote above is what the PI showed me a few days ago. But now it’s showing me that this streak doesn’t rank in the top 20 all time and that the longest is 29 games.
At 20 games, the Tribe has cracked the top 10 of in-season streaks.
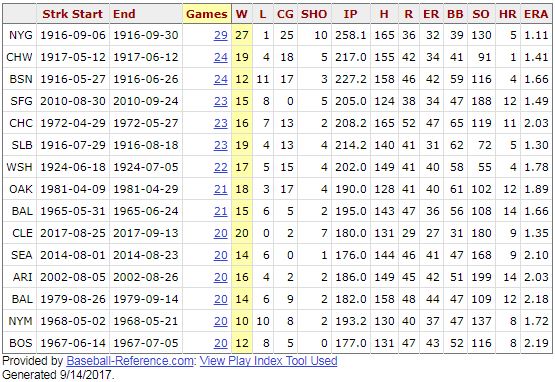
That’s 5 pennant winners on the list – good omen for Cleveland.
Interesting how misleading some stats can be if you’re not thinking clearly. When I saw the ’68 Mets on this list, I thought, “How could I have failed to notice the high quality of play implied by this terrific streak a year before the Miracle Mets turned the team from a joke to a sensation — why didn’t I foresee what was coming?”
The answer is that a low runs-allowed streak and a winning streak are very different things, especially in a low-run environment like 1968. The Mets’ record in those 20 games was 10-10.
Nevertheless, that 10-10 run was very un-Metlike: it brought them to 17-20 for the season, and their momentum was so strong that at several later points they came within one win of a .500 record, which I certainly remember as a cause for amazement. And, indeed, as soon as June 2, 1969 — just a year or so after this streak — the team did actually rise for the first time to the .500 level during a season’s final 158 games. Four months later, they closed the season at .617.
The thing that jumps out at me about this list is the ’81 A’s under Billy Martin, with 17 CGs out of their 21 games, and doing so right out of the gate in April. That ratio is about on a par with the dead ball era teams on the list, and far ahead of the teams (’72 Cubs, ’68 Mets, ’67 Red Sox, ’65 Orioles) of the immediately preceding years.
That was Martin’s “Billy: Destroyer of Arms” phase. He was good at it. By the end of ’82, virtually the entire starting staff — fine pitchers all — were wielding burnt out cinders.
I want to push back a bit on the popular notion that Martin was the “Destroyer of Arms” and/or that the 5 A’s pitchers were fine pitchers.
A few points:
1) Only Norris was a first round draft pick, The others were drafted in the 7th, 12th, and 36th rounds with McCatty being undrafted. Granted sometimes lower picks turn out better than expected but (other than Morris), these weren’t high pedigree pitchers.
2) Their minor league records support the idea that they weren’t very good. Both Norris and Keough had mediocre seasons at AA before being rushed to the majors. Kingman pitched well at AA but was awful at AAA. Yet the A’s brought him up anyway. McCatty pitched well as a reliever in the minors but was regularly pounded as a starter. (I didn’t bother looking at Langford’s minor league numbers since he was an established starter (average of 2.7 WAR for 3 seasons) before Martin’s arrival).
Keough, McCatty and Kingman did all have one decent season in the majors before Martin’s arrival. That being said, there have been plenty of pitchers who fooled major league hitters when they first came up but couldn’t sustain that initial success. Norris, on the other hand, was awful for several years before Martin’s arrival.
3) Of the 5 pitchers, McCatty and Norris had the highest peak seasons, with Norris finishing 2nd in the Cy Young in 1980 and McCatty finishing second in 1981. Both of those seasons were under Martin’s tutelage. (Bill James has docuemted that Martin/Art Fowler had a strong track record of turning around young pitchers). The point being that without Martin those seasons likely wouldn’t have happened. So to the extent that the A’s had quality starters, Martin deserves some of the credit for creating those quality starters in the first place.
4) But I’m still not sure they were very good. 1980 was the year that Martin leaned on them heavily. They did lead the league in ERA and just barely finished behind the Orioles in RA/9. But most of that was beacuse of their ballpark and a strong defense. Their FIP was in line with the league average (4.09 vs 4.04). They only had 9.1 pitching WAR as a staff (12.2 if you subtract out Dave Hamilton who managed -3.1 WAR in only 30 innings).
Heck, the Blue Jays and the Mariners, just a few years removed from expansion, had 16.1 and 10.2 pitching WAR respectively in 1980 (17.6 and 13.0 if you subtract out their worst pitcher).
5) And did Martin actually burn out their arms by overusing them? Perhaps. But why did none of them break down in 1980, the year of heavy use? And other than Kingman, they all had multiple seasons of 140+ innings pitched after immediately after 1980. Why wasn’t it until several years later that they broke down?
6) Beyond all of that, what Martin did was 100% normal for the time, particularly in the AL. Okay, he may have worked Norris and Langford harder than was normal. That being said, here’s a list of AL pitchers under the age of 30 wth 200+ innings pitched in 1980. Age followed by innings pitched in parantheses.
Rick Langford (28/290)
Mike Norris (25/284.1)
Dennis Leonard (29/280.1)
Moose Haas (24/252.1)
Scott McGregor (26/252)
Mike Flanagan (28/251.1)
Jim Clancy (24/250.2)
Matt Keough (24/250)
Jack Morris (25/250)
Len Barker (24/246.1)
Dave Stieb (22/242.2)
Britt Burns (21/238)
Rick Waits (28/224.1)
Steve McCatty (26/221.2)
Ron Guidry (29/219.2)
Floyd Bannister (25/217.2)
Glenn Abbott (29/215)
Brian Kingman (25/211.1)
Frank Tanana (26/204)
Rick Honeycutt (26/203.1)
Other than perhaps Langford and Norris, I don’t see evidence that Martin worked his young starters any harder than was normal for the era. And even Langford and Norris weren’t that unusual. The year before, Dennis Martinez threw 292.2 innings at age 25 and Mike Flanagan threw 265.2 at age 27. The year before that there were 9 AL pitchers under the age of 30 who threw 265+ innings, including Lary Sorensen throwing 280.2 at age 22, Dennis Eckersley throwing 268.1 at age 23 and Roger Erickson throwing 265.2 at age 21. I honeslty don’t see anything that unusual about how Martin used his pitchers. He just happened to have 5 young starters all at the same time.
I think the criticism of Martin was more for the complete games more than the innings load which, as you’ve noted, was spread over 5 pitchers (the ’57 Tigers and ’77 Dodgers are the only other teams since 1930 to have 5 pitchers with 200+ IP).
94 CGs has, of course, not been approached since, and neither has the A’s 60 CGs in the strike-shortened 1981 season (most since is 48 by the ’84 Orioles). That’s two years running with a majority of games completed by the starter, something that no team had done since the 1945-46 Tigers.
Those ’46 Tigers were the last team before the A’s with 94 CGs. The most in the 1970s was 75 by the ’72 Cubs, and no team after 1975 had more than 65. So, neither the 1980 or 1981 CG loads should be considered normal for their time.
In percentage of innings pitched by starters, the A’s ’80 and ’81 seasons rank second and fourth since 1946, and first and second since 1952. The A’s starters were above 83% both of those seasons; no team since 1995 has cleared 75%.
A terrific defense, David, and the jury is impressed. What can the prosecutor say in his closing statement that could turn the tide?
Ladies and gentlemen: The Defense has argued well, but I ask you to recall that the charge is not that Mgr. Martin called upon his young starters to throw outlandish numbers of total innings, though their season workloads were certainly high. No, it was that he demanded that his young starters throw to the high pitch-counts entailed in complete game efforts – over and over again, through the brutal heat of summer!
The Defense claims that Mgr. Martin was responsible for the high quality displayed by his pitching corps, rather than their native talent and minor-league training. The Prosecution does not dispute this claim, but it is not relevant here: what Billy gaveth, Billy tooketh away, so to speak. We gather here today to attack Billy, not to praise him, though on another day we might gather to do the opposite.
The Defense claims that the fact that the members of the pitching corps broke down in 1981 or 1982 rather than 1980 indicates that the workload in 1980 was not the cause. The Prosecution says: Hmmm: good point! But, I remind the jury that the complete game overload continued through the abbreviated 1981 season, and the uniformity with which the members of this pitching corps – talented by nature or talented in 1980, but talented nevertheless – came to the abrupt and early ends of the quality portion of their careers by 1982 provides preponderant evidence of the likelihood of a common cause.
The Defense has presented extensive and incisive research involving the career quality paths of these pitchers prior to 1980, their comparative quality compared to other pitching stalwarts of the time, and an exhaustive list of age/season innings-pitched data, all of which must have consumed a great deal of time and thought. Yet the Prosecution argues that this highly interesting data is not centrally relevant to the issue at hand. And when the Defense claims that what Mgr. Martin did was “100% normal for the time,” the Prosecution responds by noting that observers at the time expressed their astonishment at Mgr. Martin’s approach. (The prosecutor himself, being of a throwback frame of mind even in those days, thought this was a terrific development.) Over the two seasons, 1980-81, including 271 games, the Athletics of Oakland registered 154 complete games. The other teams in the American League recorded totals between 41 to 73. I ask you: is this the meaning of “100% normal?” Is certain would be — if the year were not 1980, but 1908!
Ladies and gentlemen of the jury, I think you for your kind attention.
Splendid stuff, epm!
You got there before me, Doug, and David did the hard work!
Interesting and amusing rebuttal EPM. And unforunately 100% wrong.
We could, for example, look at each of the 5 pitchers and see what they had to say about their careers. Fortunately Sports Illustarted had the foresight to interview all 5 of them in 1984. And here’s what we learn:
1) Brian Kingman was never hurt. He just couldn’t stand Martin (imagine that!) and was pissed when Martin sent him to the bullpen in ’81. His career unravelled from there.
2) Keough got hurt when he slipped and fell off the mound. I’ll let him tell what happened:
“I know I hurt my shoulder in Baltimore before the strike. The mound was wet, and I slipped. My arm was way behind me. I walked around for a while out there, but I was still hurting. I stayed in that game. And then I lost my next two decisions. Billy and Art are convinced the strike hurt us, and I agree. I was naive enough to think that by resting my arm during the strike, the pain would stop. It didn’t. I found I could pitch with 10 days off, but not very well with less than that. I missed turns the rest of ’81. In ’82 we had a rainy spring and too many people in camp. None of us got enough work. I never went more than four innings all spring. The strike and the short spring were devastating.”
3) Norris had arm problems even before Martin arrived. And he was also caught up in the cocaine scandal. Plus liked to drink wine. Etc. Hard to blame all of that on Martin.
4) Langford actualy had low pitch counts. In his own words:
“I can’t believe that pitching too much caused my injury. I could’ve gotten it if I’d pitched 100 innings. I didn’t pitch 300 innings in ’80, and I probably averaged only 100 pitches a game. Against Toronto I finished a game with only 77 pitches.”
And on the injury itself:
“The elbow started bothering me late in ’82 when I began to have that tendinitis feeling. But I continued to pitch. I thought that it would just go away and everything would be fine. Then, late that season, when I finally realized it wasn’t going to go away, I told Billy, and he took me out of there right away.”
5) And we’ll finish with Steve McCatty:
“Billy didn’t ruin our arms. Our own competitiveness did it. We wouldn’t take ourselves out. I know what I should’ve done when my arm started hurting. ‘Tomorrow it’ll be fine,’ I’d say. So I paid the price. Nineteen eighty-two and-three were the most miserable years I’ve ever been a part of. I pitched when it felt like my arm was going to come right out of the socket. I’d have tears in my eyes, and in my mind I’d say to the guy at the plate, ‘Hit this one, for God’s sake, so I don’t have to throw another.”
And also this:
“I don’t believe in that burnout theory at all. I used to play winter ball, and with that I’d go over 300 innings every year. It’s frustrating to me when I hear that burnout talk.”
So there we have it.
One pitcher who hurt falling on the mound. One had arm problems before Billy’s arrival and also got caught up in the lifestyle of drugs, women, and wine. Two who say there was nothing unusual about their workload under Martin, who got hurt several years after 1980, and who refused to tell the manager they were hurt. And only one who blames Martin for how his career turned out, the only one, ironicaly who never got hurt.
https://www.si.com/vault/1984/09/10/626212/whatever-happened-to-the-class-of-81
Nice rebuttal. In response I would offer this:
– Whatever the nature of Norris’s pre-existing injury, it’s curious that it seemed to have not affected him in 1980
– The last two (Langford, McCatty) beg the question of the root cause for their injuries, both starting in the same 1982 season. Saying that “it wasn’t the manager’s fault because I never told him I was hurt” doesn’t absolve the manager (in my view) of responsibility for the well-being of his players. At least that would be the view today, but admittedly less so almost 40 years ago when most players were seen as (and paid like) replaceable commodities (ironically, A’s pitching coach Art Fowler is attributed in the S-I piece to the view that the supposedly hefty contracts of the A’s young aces were reason enough for them to pitch as much as called upon; how times have changed).
– Also, it’s suspicious that none of these injuries (Langford’s, McCatty’s or Keough’s) could be “repaired” to the point of allowing them to return to any semblance of their earlier form. At least a suggestion of underlying damage that was largely permanent (McCatty admits as much in the S-I article).
I’ll have to find a copy of Bill James’ 1983 Abstract (1984 is the first one I have) referenced in the S-I article in which James supposedly makes the case for overuse of young pitchers showing up as career-shortening serious injury a few years later.
David, First, since when does the Defense get to rebut the Prosecution’s summation? This is just procedurally wrong! And it’s made much worse by the rigor of the rebuttal. It would be grounds for appeal, but prosecutors don’t get to appeal. Nevertheless, seeing as you were granted exceptional leeway by the court, I have extracted from the judge permission to reply, and also to enter as evidence (Exhibit A) Doug’s response.
Few pitchers want to come out of a game unless they’re getting beat up, and that was more true of pitchers in the era we’re considering than in most, since they had the example of the workhorses of the ’60s and ’70s to compare themselves to. These pitchers were complicit in Martin’s approach, and they said as much during their dominant years, if I recall. Maybe Kingman kept quiet (as Holtzman later did not), but story I remember is of the Oakland pitchers filled with praise for Martin.
Let’s take first the example of Langford, with his “low pitch-count” story. We do not have pitch counts from that era, but we can surmise from batters faced what was going on. I’m sure Langford is correct about his 77-pitch Toronto game. He’s undoubtedly referring to the July 30 game, a two-hit low-walk low-strikeout performance. Langford had a game score of 83, his high for the year. Even today a manager might leave a pitcher in when he was rolling along like that – though probably not once the score reached 9-0 in the sixth, as it did on that day! But pit against that a game ten days earlier, the only other game score Langford had above 75: a 14-inning complete game. Langford faced 52 batters, and we can surmise a pitch count in the 160-190 range. The previous game he had issued five walks in facing 40 batters – that ain’t no 77-pitch CG, even though it was only a nine-inning affair. This was all part of a streak 22 consecutive complete games! This included six games where he faced 40 or more batters (he went 2-4), and seven CGs where he allowed 5 or more runs (for a season total of eight, in which he went 2-6) — it wasn’t as if he were steamrolling the league in that stretch: he went 13-9 overall. Why wouldn’t relief pitchers have made sense in many of those games? So how good a witness is this Iron Man? How likely is he to allow the jury to think, “You weren’t an iron man, you were an idiot!”
Keough hurt his arm and it didn’t heal, even with rest. What was the reason for that? The injury or the condition of his arm when it was injured? We can’t know, but, again, the pattern here is that every one of the five 1980 CG-workhorses happened to burn out within a couple of years. Would it be a surprise that the burnouts differ in the specific ways they were manifested? Sure, maybe Keough is right and the injury had nothing to with the strain on his arm in 20 complete games in 1980 . . . but how would he know that? (This is just a longwinded restatement of Doug’s argument, but I’ve just come home from the opera, and I’m thirsty for some arias of my own.)
McCatty’s argument is even weaker. It boils down to, “We were so special that our manager couldn’t control us: on every other team, pitchers took themselves out of games, but not us!” McCatty admits that the overwork did cause the arm injury, but claims the manager had no agency in the use of the pitching staff. I’d fire a manager like that, wouldn’t you? It’s still Billy: Destroyer of Arms, but where the name conjures up a demon, it turns out it was destruction by wimpiness.
If Norris, the best of the bunch by far, had arm troubles before 1980, why the hell was Martin squeezing 24 complete games out of him in 1980? What possible sense does that make? Martin let Norris pitch a 14-inning complete game, like Langford, one of four extra-inning CGs Norris pitched. On September 26, long after the division race was over, Martin let Norris absorb a 10-7 CG loss. When Norris blew the game up in the top of the 9th by allowing 5 runs, Martin left him in to face four more batters before the inning mercifully ended. If the A’s had tied the game up in the bottom of the inning, Martin’s management indicates that Norris would have been sent out to be pounded in the tenth. Wine, women, and coke may seem like a lot to deal with, but, again, Norris fits a pattern that explains his rapid decline on other grounds.
Kingman’s different, and I’ll allow that he was not in a class with the others. Martin wrung only 10 complete games out of him, and they were all pretty good games, with only one involving as many as four earned runs. In fact, Martin’s treatment of Kingman was, more or less, “100% normal for the time” (or maybe 75% normal, since Kingman’s 8-20 record on a strong team is not truly evidence of quality you want to trust through all nine innings).
And so, to sum up, I move that Kingman’s case be separated from the other four. If it is, I’m sure the jury will agree that the Prosecution’s case continues to prevail on all counts.
— Out of character, I have to add this: I made my original brief comment as a quick, snide crowd-pleaser based on conventional wisdom that I had never reexamined and didn’t think was up for debate. I’m really impressed how much counter-evidence David has amassed.
One small contribution to this discussion.
Regarding the pitchers being pressed into complete games through the heat of the summer…
Playing at home, brutal heat rarely comes to Oakland.
It does happen that the marine layer sucks out and the inland valley heat has its way, but usually not.
They had 53 CG at home.
41 on the road.
Of those 41, they did take the brunt of it in the hot summer months
Norris: 14 of his 24 CG after July 1st.
Langford: 17 of 28
Keough: only 7 of 20
Kingman: 7 of 10
McCatty: 9 of 11
The 2nd half of Sept isn’t actually that hot, and some of these were probably in Seattle, but I just wanted to contribute a dollop of data…
Justly written, Voomo. The “brutal heat of summer” thing was intended only to inflame the jury, but it’s also true that I wondered as I typed whether any of its members would question whether I’d ever been to the Bay Area.
EPM – This is HighHeatStats. Rebuttals are endless. 🙂
For my next rebuttal I’ll give you this. From what I understand, your hypothesis is that the A’s starters broke down because of high pitch counts (implied by complete games since we don’t have pitch count data). I’ve already shown that their innings pitched weren’t unusual for the era. And they started fewer games than many of their contemporaries. So from what you’ve written, it seems like your hypothesis is “the high pitch counts did it”.
So then I ask you this…where is the evidence that high pitch counts lead to pitchers breaking down? There was an initial study that showed a relationship between high pitch counts and pitcher injuries. But subsequent studies have failed to repliacte the findings.
And then I give you….the New York Mets!!! How many of their pitchers have broken down over the past two seasons? Their workload is nowhere near that of the A’s starters. And yet almost all of their starters have suffered injuries over the past couple of seasons. In fact, pitchers all over the majors are getting hurt over and over and over again, despite strict pitch counts. Why is that?
Meanwhile, I can also give you guys like Fergie Jenkins, Robin Roberts, Juan Marichal, Steve Carlton, Gaylord Perry, Bert Blyleven, etc. who shouldered comparable burdens to the A’s pitchers year after year after year. And didn’t break down. So if you want to say “the high pitch counts did it”, then how were those pitchers able to stay healthy?
Over to you…
That same season, Rickey had 34 steals in the last 28 games to get to 100.
HighHeatStats?? Good grief — I thought this was Law & Order!!! I was wondering why there was no chung-chung when I posted . . .
Ok, staying in HHS mode then, here are some counter-points, noting at the outset that you have it right: my claim is that high pitch counts did it.
1. The evidence that high pitch counts did it is the Oakland experiment. Here’s the way the experiment runs: Take five young pitchers who have never had CG numbers out of the ordinary for their MLB environments and suddenly ratchet up the CG numbers to those of the most outstanding pitchers of the era. Here is a list of the five pitchers, with their 1980 CG numbers, preceded by their previous career high numbers:
Langford…14 / 28
Norris ….. 3 / 24
Keough….. 7 / 20
Kingman …. 5 / 10
McCatty …. 8 / 11
This time McCatty is a bit of an outlier, more than Kingman. But McCatty’s intense year was actually 1981, when, in 2/3 of a season, he pitched 16 CGs in a great year that effectively ended his effectiveness thereafter. Langford is a bit of an outlier on the other end: he was a top-ten CG pitcher in 1979, and in his case, Martin’s experiment may have been justified (although those extra-inning and high-run games do not appear to be sensitive to potential downside issues that we’d expect to count for a manager trying to help a pitcher find his optimal role).
So far as I know, there has been no comparable experiment in the history of baseball. Early pitchers had many more CGs, but they were in an environment where pitchers were expected to pace themselves and complete the game as a matter of routine. Later, high complete-game pitchers generally took on that profile gradually, as their records demonstrated that they had the talent to do so. I know of no other experiment of this nature, and the outcome of this singular experiment are clear – everyone involved became ineffective within two years. That’s only one trial, but the result is so profound as to shift the burden of proof onto those who deny the hypothesis. The theme of this item will be picked up in #3, below.
2. I think your point about the Mets, etc., is not valid. You are, in effect, claiming that because arms fail for all sorts of reasons regardless of pitch counts, it is never possible to identify high pitch counts as a reason for arm failure. I think if you reexamine this, you’ll recognize that this argument bears some resemblance to, “The climate is always changing,” and want nothing more to do with it.
3. As for Fergie & Crew — absolutely: there are indeed high-CG pitchers who have sustained effectiveness over very long periods. However, these pitchers generally emerged through a process of natural selection: managers identified them as good CG candidates and either gradually or as a more sudden experiment let them complete their games. There may have been many more cases of this process getting underway with pitchers whose names we don’t recall: the pitchers you list are the successful cases. (And there are more complex cases, such as Koufax’s, where the approach worked in the short term, but at the clear cost of half a career.) This is not the same as suddenly imposing a high-CG profile on an entire starter corps as a matter of team policy. The pitchers you name are the elite who were able to sustain this sort of profile, perhaps one starter in twenty, or thirty, or fifty. What reason did Martin have for assuming that his group of five starters, apart from, perhaps, Langford, were all members of such an elite?
The Tribe open a set in LA against the Angels with a chance to extend their streak to 25 straight allowing four runs or less, and move into second place alone for the longest such streak. Bet on the under as the Angels have tallied three runs or less in 7 of their last 10.
With two doubles last night, Jose Ramierz has just the 12 season of 50-5-25. Others to pull off the feat include:
Gehrig (1927)
Klein (1930, 1932)
Greenberg (1934, 1940)
Medwick (1937)
Musial (1953)
Berkman (2001)
Tejada (2005)
Sizemore (20006)
Holliday (2007)
David, you of all people should know that this comment is right up my alley!
Quiz time for all readers: Ramirez hit his 27th home run last night; there have been only eight 50-5-30 seasons, and just two since Musial (him again) did it in 1953. Can you guess them? Also, one player reached those marks on two separate occasions…who was he?
You have a 50/50 chance of guessing the second question correctly. 🙂
Well since I extracted the data above, I “should” know the answer. But I didn’t look that closely.
I’m pretty sure that Sizemore is one of them. And that Tejada isn’t. I’ll go with Berkman as the other since Musial.
As for who did it twice, that would have to be either Klein or Greenberg. I’m pretty sure one of Greenberg’s seasons was less than 30 home runs. So that would make Klein the answer.
It was actually Berkman and Holliday who pulled it off. Holliday had 6 triples! You are correct that Klein was the two-timer.
By the way, Charlie Blackmon how has 33-14-35. Those 82 extra-base hits in the lead-off spot are the most ever for a National League batter. All but one of his 93 RBI have occurred while in the #1 position, a total which is also an NL record.
Perhaps a savvy P-I user could find the most runs batted in for each batting order in both leagues?
Here you go. AL on the left and NL on the right.
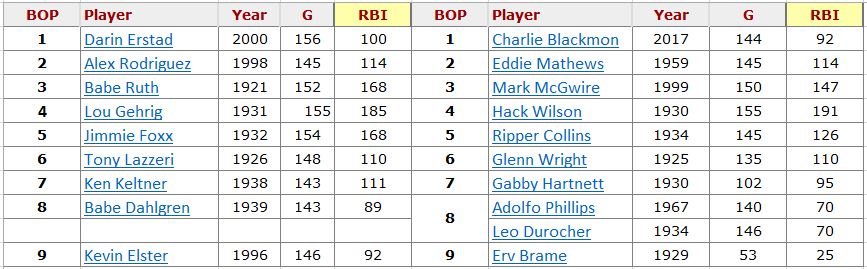
If you’re keeping score, it’s a 6-1 edge (pending Blackmon’s final result) for the AL with two ties. The NL mark shown for batting 9th is for pitchers; the only higher result is 45 RBI for Addison Russell in 2015 when the Cubs experimented with batting their pitcher in the eight hole.
– if you’ve never heard of Erv Brame before, his .306 career BA is the highest, by 17 points, by a pitcher in 400+ PA
– the AL RBI record from the 9 hole before the DH rule is 31 by Wes Ferrell in 1935
Thanks, Doug! Very interesting how two-thirds of the records were set in the 1920s and 30s, and only four have happened in the past half-century. Perhaps managers changed their batting orders less often in the old days?
Leo Durocher: the all-time leader in an offensive category. Never thought I’d see it.
There are many umpires who would not have been surprised in the least.
Leo probably would have benched Phillips or bumped him up the order had he known Phillips was threatening his record.
2016 Yankees’ pitchers who are succeeding on other teams:
Andrew Miller
2.7 WAR
56 IP
0.808 WHIP
12.9 SO/9
Anthony Swarzak
2.5 WAR
67 IP
1.000 WHIP
Blake Parker
1.7 WAR
62 IP
0.855 WAR
11.5 SO/9
Richard Bleier
1.3 WAR
56 IP
1.196 WAR
Ivan Nova
1.2 WAR
174 IP
Nick Goody
1.0 WAR
51 IP
1.071 WAR
12.1 SO/9
Tyler Olson
0.9 WAR
22 Appearances /15 IP / zero runs
Kirby Yates
0.2 WAR
52 IP
1.154 WHIP
14.0 SO/9
James Pazos
0.1 WAR
52 IP
11.0 SO/9
Luis Severino.
Throws 100 with a knee-buckling slider… and has command.
Currently at 218 SO and 49 BB.
That is 4.45 SO/W
Age 23 or younger, most strikeouts while also posting a SO/W greater than 4.2:
253 … Jose Fernandez
248 … Clayton Kershaw
245 … Mark Prior
218 … Luis Severino (and counting)
218 … Noah Syndergaard
205 … Tom Seaver
166 … Syndergaard
161 … Jim Merritt
144 … Roy Oswalt
144 … Francisco Liriano
126 … Roger Clemens
125 … Sammy Ellis
The citing in Doug’s chart of Babe Dahlgren as having the most RBIs from the eighth spot in AL history in the year 1939 may not mean much to people unfamiliar with Dahlgren or 1939 or the team he played for. Dahlgren was a journeyman first baseman who failed to stick with the BoSox after a year as a starter—they acquired Jimmie Foxx—and was sent down where he tore up minor league pitching and eventually resurfaced with the Yankees in 1938 as a back-up for Gehrig. In 1939, of course, the disease named after him took down the Iron Horse, and Dahlgren was thrust into the lineup, batting eighth, not in Lou’s cleanup spot. The ’39 Yankees are often cited as one of the best teams ever, if not the absolute best, with a huge margin of runs scored over runs allowed, with Dahlgren as the only weak point in the lineup. Can’t but wonder what the team would have done with a healthy Gehrig in an average season batting .340 and scoring and driving in 140+.
Even those familiar with the history can enjoy a timely retelling, nsb, and for fans like me, who grew up looking at the Yankees as the baseball equivalents of Genghis Khan, the idea of the same team with Gehrig healthy has always been like a disaster movie screenplay. But I do think that despite its great strength, the lineup included two weak spots, with Crosetti a bit less productive than Dahlgren (though, of course, one would expect more offense from a first baseman than a shortstop). The other six made up for it!
Another thing about those ’39 Yankees: 7 players with 80+ RBIs and 7 with 80+ runs scored. Crosetti made up for his weak bat with dWAR of 3.0 and 109 runs. Somehow I thought I had a trivia fact that they were matched by another team in having 7 guys with 80 or more RBIs (in 1894 Baltimore had 8 over 90—but that was the year of the craziness), but it was just 6, none of them with 100. I’m pretty sure this NL team holds the post-1900 record up to the steroid era, but I haven’t checked beyond to see if any teams since have put up 6, 7, or more players with 80+ Ribbies. Quiz: what NL team is the one I spotted with 6 prior to Steroids, and request for help: have there been any since to match or crack that level?
Lowest OBP with 30+ homers:
.253 … Rougned Odor (current)
.254 … Tony Armas
.255 … Dave Kingman
.272 … Tony Batista
.273 … Cory Snyder
.284 … Kingman
.285 … Kingman
.286 … Kingman
Note: Adam Duvall’s current .294 ranks 14th on the list
Last night (9-22) Lorenzo Cain of the Royals got a -23% WPA for a single. It was top of the 9th, KC trailed the White Sox 7-6, one out and a runner on second. On Cain’s single, the runner was out at home, then Cain got thrown out trying to advance to second, which ended the game. This has to be one of the largest negative WPA values ever for a single. Unfortunately I don’t see an easy way to search for such a thing in Play Index.
Maybe it would be better to say that the Royals received -23% WPA on the play, rather than Cain. As I understand the way B-R calculates WPA (N.B.: I don’t), the play would be broken into three components: WPA for Cain’s single, WPA for lead-runner Merrifield running into an out, WPA for subsequent lead-runner Cain running into an out. Cain should have received positive WPA for the hit (which, in itself, would have led to first & third with one out) and, probably, a larger negative WPA for a game-ending baserunning mishap — but not much larger, as it would have erased a game situation of runner on first with two out, already very favorable to the ChiSox — I believe it would have been -10%, judging by a parallel example. That is, I think, the theory, at least.
But if you total up Cain’s WPA for the entire game, based on situational WPA changes, you do wind up with -23% (his other PAs led to a balance equalling 0%), suggesting he received all of the game-ending play’s negative WPA, and B-R credits him with a net -0231 WPA for the game, which seems to match. Merrifield, on the other hand, who had a good game overall (3 singles and an SB, apart from the closing play), has a strong net-positive WPA and only 0.080 negative WPA, indicating that he did not, in fact, get dinged for his ninth-inning base-advance misstep. (Ironically, Merrifield ended the Royals 6th with a single to RF and Alex Gordon was easily out trying to score, almost a mirror image of the Cain/Merrifield dance in the 9th!).
My conclusion is that B-R WPA doesn’t actually assign credit for base running advances/outs to lead runners in cases of base hits, only for things like SBs, although this does not seem to match B-R’s own explanation of how it distributes WPA. So although I think it’s poor practice to assign Cain all -0.231 WPA for the single he hit + the two baserunning results, I think Ken’s initial statement is probably true.
Even more unjust for Cain, looking closely at the replay, it seems as though the Royals first base coach waved Cain around first — clearly a terrible call, as Cain was out even though the catcher Narvaez initially threw to first, and the ball had to be relayed to second (the third-base coach wasn’t too swift either: Merrifield was out by a comfortable margin). I feel confident that in Baseball Olympus, John McGraw and Honus Wagner credited Cain with nothing but positive WPA, and assigned heavy black marks by the name of the two Royals coaches.
Perhaps someone who actually understands WPA would be willing to use errors in my analysis as a teaching opportunity.
I agree that Cain was given too much negative WPA on this play, but while WPA is a good stat, it isn’t always fair. As I understand it, B-R calculates it for a batter by taking the probability of the team winning after his plate appearance minus the probability before, with the exception of stolen bases and CS. So advancements on WP, PB, errors etc are all credited to the batter, as well as any base runner advancements from a hit, walk, or out. And the batter will get docked if any runners are thrown out trying to advance, like in the Cain example.
Using Baseball Gauge, I checked all 49 years of the Royals for largest negative WPA values for a single. The Cain one at -0.227 did turn out to be the lowest one. Second lowest was -0.187 by Bo Jackson vs the A’s on 6/15/87, third lowest -0.151 by Greg Gagne vs the Rangers on 9/3/95. There were 12 instances of -0.100 or lower.
It’s rare for anyone to spot a new extreme on a relatively obscure stat in real time, Ken, You’ve done it for the Royals, and, given Cain’s margin there, maybe for MLB. Even if the stat isn’t really fair, that’s impressive!
I think you’re right about the way B-R calculates WPA, though the explanation I recall didn’t actually limit lead runner WPA credit to SB/CS cases, but seemed to give them as examples without spelling out what else would or wouldn’t count. The Jackson example seems even more egregious than Cain’s. Jackson hit a timely single and did nothing else – Danny Tartabull was out at the plate trying to score from 2nd. What sense is there in a stat that penalizes a player for delivering a clutch hit? I’ve been a big fan of WPA while admitting my lack of understanding of its fine points. Now that I understand more, I’m a much smaller fan (which actually, in my case, is much more height appropriate).
August 27, 1986: Padres’ Tim Flannery bats against Mets’ Doug Sisk with one out in the bottom of the 11th, Mets leading 6-5, Garry Templeton on second. Flannery singles up the middle. CF Lenny Dykstra throws out Templeton at home, and then C John Gibbons gets up and throws out Flannery trying to advance to third. Game over. WPA for the play is -0.27. It’s the only WPA value lower than Cain’s since 1969 on a game-ending single.
Great find, KT.
Second Doug’s praise, Tuna.
I assume, but am not entirely sure, that the greater shift of adds in Flannery’s case was because had SD scored twice, the game would have been over, while had KC scored twice in Cain’s case, the bottom of the 9th could have reversed those results.
Would I be right to assume that there is no effect on WPA because Cain made it to 1B but not 2B, while Flannery (somehow) made it from 1B to 2B, but not to 3B? If there were, we’d have the conundrum of Flannery being, in one sense, penalized more for having made it to 2B than Cain was for being thrown out there.
Oh. I see I typed “adds.” Odd.
My interpretation is that in 2017 that if the home team is ahead by 1 run in the top of the 9th and the visitors have a runner on 2nd with 1 out, the home team has a 77% chance of winning. The game ended on Cain’s single and the WPA for the play becomes 100 -77 = 23% for the home team and -23% for the visitors. It does not matter how the play progressed. If Cain had hit into a line drive DP to end the game the visitor’s WPA is still -23%
I see the result the same way, Richard. The issue raised by Ken’s post, though, is whether Cain should be “charged” with the full negative WPA, given that his batting effort produced positives as well as negatives, and the negatives were not a direct result of his batting effort. If WPA is to be used as a measure for player evaluation (as is suggested by its inclusion in individual player stats), as opposed to play evaluation, assigning Cain (or Jackson, Gagne, Flannery, etc.) negative WPA for a clutch hit would be a distortion.
After tonight’s (9-26-2017) game Aaron now has 122 BB and 204 SO for a total of 326. The ML record is 327 set by Adam Dunn in 2012.
Aaron Judge now has 328 BB + SO, a new ML record. He has 378 BB + SO + HR, second only to Mark McGwire’s 387 in 1998.
According to the Yankees blog “Yanks Go Yard,” on Sept. 11 Jacoby Ellsbury passed Pete Rose to become the all-time leader in times reaching base on catcher’s interference (30).
KT, I’m not sure if anyone else is still tracking this thread – maybe you should repost this where it can get more attention: I think it’s very interesting.
The CI (B-R abbreviates it as XI) stat seems to have been kept since 1930. I can find no CI leaderboards or league totals, and can’t really tell how frequent these calls are, but clearly they are generally quite rare: some major players (e.g., Mickey Mantle, Jackie Robinson, Barry Bonds, Cal Ripkin) never drew a CI call in their careers. I checked a couple of lesser players who thrived on making use of edgy play (Eddie Stankey, Ron Hunt) – they had zero CI calls too.
If Rose was indeed the lifetime record holder, he accomplished this without ever drawing more than 4 CI calls in any season, something he did only once (he twice had 3).
Ellsbury, however, got 12 CI calls in 2016 alone, and 20 over the past three seasons (he finished 2017 with 5, and now has 31 lifetime).
What gives?