Building a Simpler Pitcher WAR Metric – Part 1

Greetings, HHSers from Dr. Doom!

OK, so here’s the thing. This website is called “High Heat STATS.” And while Doug will occasionally enlighten us with a beautiful, table-filled column about some statistic or other through time, I think we all just like talking baseball. But in this series of posts, I’m going to get into the nitty-gritty of building a mock-WAR that I think you’ll all enjoy. It’s a quick-and-dirty way to do a couple of things I think are important.

  1. It takes ERA (or FIP) numbers and prioritizes them over won-lost records;
  2. It allows (more) direct comparisons of starters and relievers;
  3. It simplifies down to one dimension VERY quickly and easily (or stays two-dimensional, if you prefer);
  4. It is easily figured with a computer/calculator and only TWO stats, easily found on Baseball-Reference or Fangraphs.

I haven’t been posting much lately, and I apologize for that. My wife and I moved and had to maintain two residences for a couple months, and I just helped my parents move. I’ve been settling in at a new job, and I also don’t really have my own PC anymore. So the chances to comment have been limited. That said, I have kept up reading every post, and most of the comments. But for the time being, I thought I’d jump back in to writing a few posts of my own. As always, a special thanks to Doug for posting this for me.

In this first part of the series, most of you are probably going to be bored, but I’m going to post this anyway so that those who don’t know can learn. We’ll start by talking about a Pythagorean Record. First of all, the Pythagorean Record was invented by Bill James, not Pythagoras. But it does use the squaring of two numbers to discover a third number, just as happens in the Pythagorean theorem, so there’s that.

The Pythagorean Record is a way of assessing how many games a team “deserved” to win, based on the number of runs they scored or allowed. It works by squaring the number of runs scored, and dividing that by the sum of the square of runs scored and the square of runs allowed, like this:

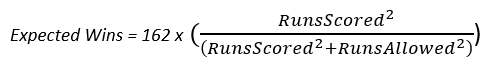
Let’s take a totally random example: last year’s Pittsburgh Pirates (by the way, I didn’t check how well this would work before picking the example, so I’m glad this one basically works out). The Pirates scored 668 runs. They allowed 731 runs. Therefore, we calculate their Expected Wins like this:

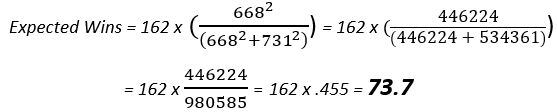
This says the Pirates should’ve won 45.5% of their 162 games, or 74 games (well, 73.7, but we have to use whole numbers, since that’s how wins work). In fact, they actually won 75. That’s ridiculously close for a simple estimate like this. (Note: I realize that there are actually more accurate ways than squaring to get this to work; an exponent of 1.82 is said to work better, and usually it does. There’s also a variable exponent you can use based on the run environment of the league in question, but all of that is, for this discussion, so much fussing about, because in its original incarnation, we get VERY good results AND beautiful simplicity with the simple exponent of 2, so that’s what I’ll just be using here.)

That’s Pythagorean Record. The other thing that we need to discuss is something that doesn’t have a name, as far as I know, but could be described as “decision proportion.” There is, and this will surprise no one, one pitching win credited for every (roughly) 9 innings pitched. This is probably not a surprise. Some of you might be expecting it to be a little more (“What about extra inning games?”), but keep in mind that MANY games end without a home team batting in the 9th, and some (though not many) games end even earlier because of weather.

Picking a league totally at random, the 2017 MLB had 43257 IP. Divide by nine and you get 4806 pitching decisions. There were 2430 games played last year; a win and a loss for each makes 4860 expected decisions. Decently close. We could adjust the numbers so we got an exact number of decisions, but we’re not actually looking to do that; take what I said above about beautiful simplicity and keep it in mind. I’m looking for ease and elegance here, not strict accuracy.

Let’s tray another one. In 1987, there were 37574.2 IP in 2105 games. We would expect 4175 decisions, we actually got 4210 (again, off by about 50 decisions). In 1954, there were 22126.2 IP, which leads us to expect 2459 decisions, instead of the 2462 we actually got (only off by 3). As you can see, it gets us within 2% of the total number of decisions, and often within 1%.

These two ideas, of the Pythagorean Record and “decision proportion”, are going to form the foundation of the WAR metric I’m going to introduce (and horse around with) in the third part of this series. But, before we get to that, in part 2 we’re going to talk about ERA+ and FIP.

Please feel free to comment away, though I’m sure there won’t be too much to say here, as these concepts are not too earth-shattering (especially if you’ve been in this community, or one like it, for a while). But, I hope you’ll all bear with me as things will get more interesting next time. Catch you in the next post!

0 0 votes
Article Rating
Subscribe
Notify of
guest

56 Comments
Oldest
Newest Most Voted
Inline Feedbacks
View all comments
e pluribus munu
e pluribus munu
5 years ago

I’m sure we’ll all be with you so far, Doom. Glad to see you back posting, and looking forward to the next post when things begin to come into focus. In the meantime, I have a question (for anyone) about the Pythagorean theorem (not the real one; James’s). I may have worked through it decades ago, when my synapses were nimble, but I can’t recall why it works. That is, I know it works pretty well (and I’ll take your word that using the 1.82 power works even better), but I can’t recall whether James ever explained why squaring the… Read more »

Richard chester
Richard chester
5 years ago

My guess is that the exponent was determined by trial and error.

e pluribus munu
e pluribus munu
5 years ago

I wouldn’t be surprised, Richard. I think lots of practical math problems are worked out that way first. But I’d expect James or someone else to have reasoned out a theory for why it works. If no one has yet, that’s ok, but the first one to figure it out won’t be me.

Dr. Doom
Dr. Doom
5 years ago

It has SOMETHING to do with average margin of victory and points scored. In basketball, the exponent is something like 18, rather than 2. So it’s something about the numbers themselves and/or the margins. Someone with more math chops than I can probably figure it out.

Paul E
Paul E
5 years ago

Probably a way to eliminate the “blowout” factor? If every game was a one-run victory, perhaps the exact square would work better than 1.82?
What’s really amazing about the “theory” is that in the dead ball era there appears to be a preponderance of dominant teams (NL 1903 -1913 Cubs NYG Pirates) who routinely won 100+ games and finished in 2nd place. Coincidentally, a team that averages 3 runs scored and surrenders 2, wins more frequently than the 4-3 and 50-4 teams of the live ball era

Paul E
Paul E
5 years ago
Reply to  Paul E

sorry that’s 5-4 (not 50-4)

Doug
Doug
5 years ago

I’m curious to find out (I haven’t see part 2 yet) whether pitchers with a higher decision proportion grade out better or worse than those with a lower mark. Or, whether, it’s so much noise (but, since Dr. Doom has introduced the idea here, I presume there is some relevance to it).

Dr. Doom
Dr. Doom
5 years ago
Reply to  Doug

There is DEFINITELY relevance to proportions. But what I’ll say is this: it’s close to a mathematical identity. Here are 13 famous pitcher seasons, with actual decisions listed first, followed by expected decisions: Joe McGinnity, 1903 – 51, 48 Walter Johnson, 1913 – 43, 38 Grover Cleveland Alexander, 1920 – 41, 40 Lefty Grove, 1936 – 29, 28 Hal Newhouser, 1945 – 34, 35 Sandy Koufax, 1963 – 30, 34 Bob Gibson, 1968 – 31, 34 Wilbur Wood, 1971 – 35, 37 Gaylord Perry, 1972 – 40, 38 Steve Carlton, 1972 – 37, 38 Tom Seaver, 1973 – 29, 32… Read more »

Dr. Doom
Dr. Doom
5 years ago

Hey everyone! I realize that, as epm stated, you’ll all be with me for this post. The next one, too. The “real” post is the one coming in part 3… the thing is, if you don’t understand all the elements in parts 1 and 2, part 3 won’t make sense, and it would’ve been a MASSIVELY long post, had I included everything in one post. So I’m separating things out in a way that I hope makes sense. I’ll send part 2 to Doug today, so it’ll probably be a little while before it’s up, but maybe we can have… Read more »

no statistician but
no statistician but
5 years ago
Reply to  Dr. Doom

All-Star Break 2018 observations: After 59.4% of the season’s games have been played, the number of HRs is 53.8% of last year’s total, Strikeouts stand at 61.2%, Walks virtually the same, CGs at 42% of last year’s pathetic total, Saves at 65% of last year’s total. Pitchers have taken control—or maybe pitching by committee—and since it is historically common for batting to flag and pitching to rally in the last months of the season, these figures have a good chance of becoming even more skewed toward moundsmen. Currently: R/G down from 4.65 to 4.42 BA down from .255 to .247… Read more »

e pluribus munu
e pluribus munu
5 years ago

George Will published an op-ed about the current batting trends the other day. He focused on the effects of pervasive fielding shifts in contributing to the high-K / high-TTO character of today’s game. His prediction was that “market adjustments” will save the day (remember, it’s George Will) by raising the value of shift-defying spray hitters, who will be increasingly nurtured and promoted to the Bigs. Will’s fear is (no kidding) that baseball’s government will try to solve the problem through regulation: e.g., requiring two infielders be on each side of second base when the pitch is delivered. (I think Will’s… Read more »

Paul E
Paul E
5 years ago

if they move the fences back, it would certainly discourage or reduce power hitting (or power swinging) and, in turn, reduce the preponderance of TTO. They lowered the mound at one point (1969)…maybe they lower it again or move the mound back (63′ 6″ ?) . They should, at least, have a 380′ power alley minimum rule and a 415′ CF rule. This would possibly encourage greater OF fielding as opposed to hulking power hitters with little range. But, then again, I’m OK with a dictatorial commissioner who acts sensibly……..”when I’m king of the world” The N F L is… Read more »

no statistician but
no statistician but
5 years ago
Reply to  Paul E

One of the reasons basketball has become so boring to watch is that, while the average height of NCAA and professional players is a foot or more over what James Naismith reckoned with at the Springfield, MA, YMCA in 1891, the court size and height of the baskets has remained the same, this despite the way other rules have changed over time, often dramatically, elimination of the jump ball after a basket, widening of the foul lane from 6 to 12 feet, the three-point option, etc. I’ve often thought recently that one of the hidden elements behind the increase in… Read more »

e pluribus munu
e pluribus munu
5 years ago

Since we’re in open topic mode and the Pythagorean theorem has been mentioned (maybe we should call it the B.J. Pythagorean theorem, or BJP, to make clear we’re talking about Bill James’s theory and not the theory of the guy with the bean taboo), I’m going to repeat my objection to the way it is sometimes (often, really) used. There’s no reason someone like me should have any particular insight on this issue, so I’m braced for the HHS response that my position is absurd: no need to hold back. As a predictive device, the BJP is fine: it works,… Read more »

Doug
Doug
5 years ago

I agree that the over or under-performing Pythag isn’t too meaningful by itself. except … when you’re looking at what a team has done so far in their season, it could be useful (if a team’s record in sharply out of alignment with Pythag) in assessing what might lie ahead for that team. Of course, assessing past and future strength of schedule could also suggest explanations and help assess future prospects. Another use would be assessing teams that have similar out-of-alignment Pythag results for a few years running; it could just be chance, but more likely there was something exceptional… Read more »

e pluribus munu
e pluribus munu
5 years ago
Reply to  Doug

I agree with everything you say, Doug. The BJP outliers are intrinsically interesting (what happened?), and we find good narratives in exploring some of their stories. I suppose that could be an aid in real-time assessment of teams’ season performance, as you suggest. There are, after all, always reasons why teams deviate significantly from their projection: I just don’t believe that when we’re dealing with season-level data, those reasons reduce to generalizations that have evaluative significance, Instead you get, “there were a lot of (W or L) blowouts” and “there were a lot of (W or L) one-run games” (with… Read more »

Doug
Doug
5 years ago

James has all these complicated formulas for Win Shares. Thought just came to me that maybe a player’s OW% relative to his team’s might be the basis for a simpler and more intuitive Win Shares. Something to ponder further.

Dr. Doom
Dr. Doom
5 years ago
Reply to  Doug

A couple responses: first, to Doug’s comment about Win Shares… that’s somewhat close to the direction we’re headed in this series, Doug. I’ll remain tight-lipped beyond that, but that’s the general direction. As to epm’s original comment… yes, you’re right. But you’re also wrong. Here’s my thinking. There’s a LOT of noise in an individual game. No one, I think, truly believes that a one-game sample gives us the best team in baseball. We know this, because no one goes 162-0. There’s a LOT of noise in one game. Therefore, it stands to reason that, a group of games evens… Read more »

Mike L
Mike L
5 years ago
Reply to  Dr. Doom

Just wanted to throw something into Dr. Doom’s comment about the 2006 Cardinals being a very good team. There’s been a lot of attention paid to the AL East, where both the Red Sox and Yankees are projecting to clear 100 wins. It’s been pointed out that given the one and done wild card playoff game, that divisional race is critical. If you were managing those teams, how hard would you put your foot on the accelerator to win the division? And, to raise the converse, how do we evaluate teams and players who are out of it by late… Read more »

Paul E
Paul E
5 years ago
Reply to  Mike L

Mike L. “” If you were managing those teams, how hard would you put your foot on the accelerator to win the division? “” If you’re the NYY or the Sawx and second place appears to be inevitable , I imagine you do everything in your power to make sure Severino or Sale are ready to go as long as possible in the Wild Card game. Maybe they throw less than 75 pitches in their last regular season start? If you were a betting man, you would have to surmise, at this point, that NY or Boston will be the… Read more »

e pluribus munu
e pluribus munu
5 years ago
Reply to  Dr. Doom

Doom, I don’t disagree with any of this, and I appreciate the clarity of your explanation. I do want to make clear that I didn’t mean to suggest I had any reservations about your using the BJP for your WAR application. But I’m not sure your points actually address directly the issue I was raising about the use of the BJP as an evaluative tool (most often to assess the quality of a manager). The BJP doesn’t measure talent: run differential measures talent. The BJP is a tool to predict W-L Pct. on the basis of run differential, but it… Read more »

Dr. Doom
Dr. Doom
5 years ago

I think the point about why to use BJP rather than pure run differential is more about comparing across eras than anything. The 1976 Reds outscored their opponents by 240 runs; that’s a lot. But 240 1976 runs is more than 240 1930 runs. BJP gets us in a position that we don’t have to think about what kind of premium runs might be at. Second, as to the question of “better” types of teams, the blowout teams are better teams, the scrappy teams make for more enjoyable games. I don’t think there’s really any question about that. I mean,… Read more »

e pluribus munu
e pluribus munu
5 years ago
Reply to  Dr. Doom

Excellent points! Note that in your first and third paragraphs, you’re talking about how BJP translates run differentials into W-L, in the first paragraph accounting for the changing significance of run differential magnitudes over eras, and in the second paragraph giving us a quick intuitive snapshot of what those differentials mean. These both have to do with the descriptive function of the BJP, with which I have no problem: it’s a great tool when used in these ways. Your second paragraph makes me think that on that issue, we may be talking past one another a bit. Of course, the… Read more »

Dr. Doom
Dr. Doom
5 years ago

OK, in your second paragraph (and getting away from the philosophical and semantic arguments)… why are we assuming the ’69 Cubs were “unquestionably the best team”? When looking at the two teams, Cleon Jones was the best hitter by a wide margin, and he was a Met. Yes, Santo and Billy Williams were good, but Tommy Agee had a nice year, too. By OPS+, they were both fielding below-average lineups. The Mets had better starters and a better bullpen, though. I mean, they’re almost identical in terms of ERA+. I don’t really see how this can come down to an… Read more »

e pluribus munu
e pluribus munu
5 years ago
Reply to  Dr. Doom

Yeah, you’re right: I have a terrible statistical argument there. (Not that I checked the stats before writing, although it is the case that the Cubs, despite being 8 games back, amassed more WAR than the Mets.) And the reason I wrote so confidently is the questionable one that I was there, tracking the pennant race closely, and reading then and since about what happened. I have a heavy narrative layer that tends to overwhelm the stats. The early and late seasons were diametrically opposite: Durocher wore his starting position players to a frazzle, and the team collapsed — the… Read more »

no statistician but
no statistician but
5 years ago

The outstanding, if not indeed unique, feature of the 1969 NL East race was the Cubs’ collapse, not the Mets’ charge. Spot checking some other notable come-from-behind-in-September seasons, 1938 NL, 1951 NL, 1978 AL East, and they all have one factor that is consistent with the 1969 contest—the challenger had one hell of a finish. What’s different is that the challenged team in those other seasons played at least mediocre ball in September, but would have won the pennant anyway had not the challenger done so well. The fact is that the Mets didn’t just win by 2 games as… Read more »

e pluribus munu
e pluribus munu
5 years ago

Ah, well, nsb. It’s all very well to say that the outstanding feature of the race was the Cubs’ sinking rather than the Mets rising. But you’re old enough to recall who the Mets were — their acme prior to ’69 being a 2-1 record on 4/17/66 — and while the Cubs’ collapse was awful, the fact that it was the Mets who displaced them with a 38-11 finish was shocking (moreover, by the time the Cubs entered their final 8-18 swoon, the Mets had already crept up within five games, taking advantage of an unremarkable 13-12 Cubs stretch). While… Read more »

Doug
Doug
5 years ago

Actually, with the Yanks having won all of their games via major blowout, and the Bucs winning theirs in close contests, the surprise would be that the Pirates weren’t far ahead in WPA.

Paul E
Paul E
5 years ago

One thing we have to remember about that Cubs team was they played all their home games during the day. Durocher trotted 5 guys, including catcher Hundley, out there for 150+ games. And, possibly most importantly, it was a normal, hot and humid Chicago summer that year. The Cubs, literally, wilted. But, the Mets, obviously, played very well and I just don’t know if a ‘rested’ Cubs team would have held them off, anyway. The Mets beat a superior Orioles team in the World Series so perhaps it’s merely Calvinistic predeterminism. I heard this ‘miserable summer weather” theory, initially, while… Read more »

no statistician but
no statistician but
5 years ago
Reply to  Paul E

Wrigley Field was and is so close to Lake Michigan that the cooling effect and pronounced breezes from this proximity probably had their usual impact. Also, according to Weather Underground, the highest August temperature at O’Hare in 1969 was only 90, in September only 82. I lived in the Chicago area for over thirty years and can attest to these being normal to moderate cool temperatures. Further, playing day games has only become stressful in recent decades. Into the seventies large numbers of players much preferred them to night games, and as a further point, although the Cubs played all… Read more »

Paul E
Paul E
5 years ago

N SB,
Thanks for the info. I guess whatever I read was just an old GM wives tale….which, is one of many from the good ole days. As for the Mets, they remained competitive for a few more years (1973 team won like 84 games to win NL East), but their everyday lineups didn’t necessarily strike fear into opposing pitchers. Maybe it was the extreme park factor at Shea, but they seemed to roll out decent starting pitching all the time and hitters that struggled – Staub and Agee, off the top of my head, being the exceptions

e pluribus munu
e pluribus munu
5 years ago
Reply to  Paul E

I think nsb is right about the influence of weather on the Cubs’ performance: probably nil. Descriptions of the Cubs clubhouse during the latter part of the season, as I recall reading them, suggest that the team became distracted by internal friction and the attractions of celebrity opportunities, led by a manager who liked to stir the pot and was always on the make. As for the Mets, their lineups were consistently mediocre and it was a miracle that they remained in contention (though a miracle that was pale indeed beside winning the Series). Their ’73 adventure illustrated to me… Read more »

Paul E
Paul E
5 years ago

e p m
“It made, to my mind, a mockery of the regular season.”
Speaking of mockeries, how about the 1983 Philadelphia Wheeze Kids? The LA Dodgers defeated those Phillies 11 out of 12 while outscoring them 49-15 in the process. I believe BJP has them clocking in at 10.972 wins out of 12 games (how’s that for precision). So, naturally, the Phillies defeated them in the NLCS by taking 3 out of 4. Enough to give Tommy “agita”

e pluribus munu
e pluribus munu
5 years ago
Reply to  Paul E

I’ll tell you, Paul, as a Brooklyn fan, to see my team, already handicapped by having to play its home games in an away stadium, go down to such a defeat was a cruel blow. But the Phillies had the second best record in the league, just a game behind the Dodgers, and head-to-head matches only count for one game like any other, so I took it as the blow of Fate, not Injustice.

Paul E
Paul E
5 years ago

e p m, So, I guess you’re OK with the ’85 N L C S outcome for those Bums? Up 2-0, they lose 4 games to 2…. on some late game heroics by Ozzie Smith and Jack Clark in games 5 and 6 ….both homers in the 9th off of Niedenfuer ? There was a big debate about LaSorda not walking Clark to pitch to Van Slyke in Game 6? But, those Cardinals were a very good team. Still, up 2 – 0, not the easiest of outcomes to digest. Bill James in his 1986 abstract tried to explain how… Read more »

e pluribus munu
e pluribus munu
5 years ago
Reply to  Paul E

Paul, The Dodgers and Mets are my teams, so I’m never ok with a loss like that from a fan’s perspective — though, given my feelings about the Yankees, the parallel loss in the ’78 Series was far worse. But we all have our loyalties. There’s nothing about the ’85 NLCS that was bad for baseball. In the case of the ’73 NLCS, my team won — I was rooting for them — but I regarded it even then as having been bad for baseball in the sense that it exposed how far the new postseason structure lowered the importance… Read more »

e pluribus munu
e pluribus munu
5 years ago

Hmmmm. The NL East wasn’t actually as interesting in 1973 as my comment suggests: it was a six-team division.

Richard Chester
Richard Chester
5 years ago
Reply to  Paul E

This is for reference. Column A in the list below shows the differential between actual wins vs. pyth wins (positive number means more actual wins than pyth wins) and column B shows the number of teams for each differential. This covers the time period 1901-2013. A………B -15 …. 1 -14 …. 0 -13 …. 1 -12 …. 6 -11 …. 8 -10 …. 10 -9 …. 19 -8 …. 34 -7 …. 51 -6 …. 66 -5 …. 111 -4 …. 148 -3 …. 186 -2 …. 207 -1 …. 233 0 …. 213 1 …. 228 2 …. 208… Read more »

Mike L
Mike L
5 years ago

Not that this does any good whatsoever, but I found a reference to the Pythagorean Record in the 1986 Bill James Baseball Abstract: “(t)he ratio between a team’s wins and losses will be about the same as the ratio of the square of their runs scored and the square of their runs allowed. Again, this relationship can be stated in a number of different ways, but what it always comes down to is that if you score 10% more runs than you allow, you’re going to win about 21% more games than you lose. In analyzing teams, this knowledge is… Read more »

CursedClevelander
CursedClevelander
5 years ago

Hard to imagine a better All-Star game as far as being emblematic of the state of baseball in 2018. 13 runs on 10 HR’s – only Michael Brantley ruined the 100% by getting a sac fly.

For the NL, Javy Baez led off the game with a single. After that, over 10 innings, the NL had 5 hits – all home runs.

Doug
Doug
5 years ago

Emblematic indeed. The game TTO was almost 50% – 90 batters and 44 TTOs (since TTOs are about balls not in play, you can throw in the Suarez HBP to make it 50% on the nose). Incidentally, if you’re confused by the ESPN box score posted after the game (see below), it’s got several of the AL subs batting in the wrong spot in the order – the MLB.com box appears to be right. Gennett’s pinch-HR is just the second in All-Star history by a trailing team in the 9th inning or later. The first was by Fred McGriff in… Read more »

Voomo Zanzibar
Voomo Zanzibar
5 years ago

Anybody understand why Brad Hand has a -0.1 WAR?

1.083 WHIP
132 ERA+
99.7 PPFp
0.30 RA9DEF

Doug
Doug
5 years ago
Reply to  Voomo Zanzibar

Partly because he has high unearned runs allowed (only 15 or 21 RA are earned). I believe the WAR calculation, among other things, looks at RA for each appearance compared to avg runs scored by that opponent, then applies a factor to the total based on his team’s overall defense. So, if a pitcher is “unlucky” in allowing unearned runs, he may also be unlucky in WAR.

Mike L
Mike L
5 years ago
Reply to  Doug

Speaking of Brad Hand, any interest in starting an omnibus trade discussion post?

e pluribus munu
e pluribus munu
5 years ago
Reply to  Mike L

I’d swap a 1934 REO for a Fifth Avenue Coach Lines double decker.

Mike L
Mike L
5 years ago

Only if it’s a very active trading season….

no statistician but
no statistician but
5 years ago
Reply to  Mike L

Brad Hand, Greg Legg, and Rollie Fingers for Bill Hands, Ed Head, and Brandon Backe, with two players to be named later (Jerry Hairston and Shawn Armstrong).

Mike L
Mike L
5 years ago

Might be fun….you could have a Hand vs Hands face off with Barry Foote catching both. And Elroy Face staying warm in the ‘pen>

Doug
Doug
5 years ago
Reply to  Mike L

Don’t forget about Don “Ears” Mossi as the staff lefty.

Mike L
Mike L
5 years ago
Reply to  Doug

We will not refer to Noah Syndegaard’s latest illness, right?

e pluribus munu
e pluribus munu
5 years ago

The conversation about the ’69 pennant race is over here, but I just came across an interesting online item that stitches together many comments by players on both those teams, and I thought some folks might be interested, so I’ve embedded the link here. (The short video on the webpage doesn’t track the text.)

Paul E
Paul E
5 years ago

Durocher: “I never saw anything like it in my life. Our offense went down the toilet, the defense went down the drain and I’m still looking for the pitching staff. I could have dressed nine broads up as ballplayers and they would have beaten the Cubs.”

NICE…..

e pluribus munu
e pluribus munu
5 years ago
Reply to  Paul E

Not true. In ’69, if Durocher had dressed up nine women to play ball they couldn’t have beaten a Cub Scout team — assuming that Leo was their manager.

trackback

[…] for contributing this series on Pitcher WAR measurement. If you missed Part 1, you can check it out here. In Part 2, Dr. Doom takes a closer look at ERA+. More after the […]

trackback

[…] you’ll recall, in Part 1 we discussed the Pythagorean Record and how innings pitched relate to decisions. In Part 2, we saw […]

trackback

[…] Math below! The section below also assumes familiarity with the Pythagorean Record, so if you’re not familiar with it, now’s the […]