
Lucky if you’re a batter, that is, and you’re facing the starting pitcher for the third time in a game. That scenario has always been advantageous for the batsman, but never so much as in the past two decades. After the jump, more on batting the third time through the order.
Focusing on the expansion era where game data are essentially complete, here is how batters have fared when facing the starting pitcher for the third time in a game.
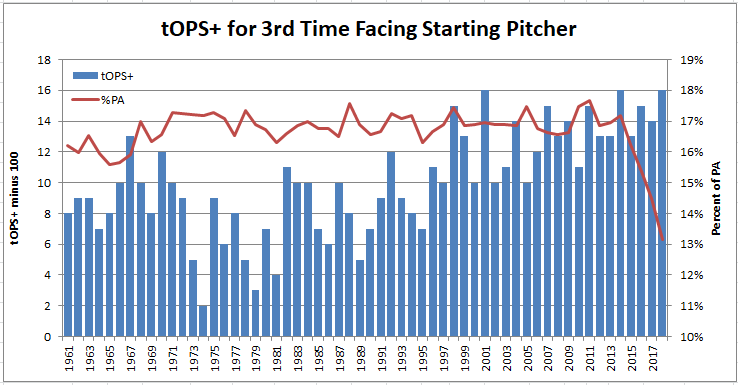
By way of explanation, tOPS+ measures OPS+ in a “split” (in this case, for PAs facing a starter for the third time) compared to overall OPS+. In the chart, I’ve subtracted 100 from the actual tOPS+ to show the percentage improvement in OPS+ in this split. Thus, the result of 116 (or 16% better than overall OPS+) in 2018 matches the record high also achieved in 2000 and 2014, and marks the eighth straight year with a result of 113 or higher (compared to the previous record long streak of only three years).
The line in the chart shows the percentages of PAs represented by this split, which was consistently in the 16%-18% range every year from 1968 to 2013. Since then, that percentage has dropped sharply to only 13% in 2018, representing the ever diminishing workload by starters, which has dropped below 6 IP in the past few seasons. Curiously, though, the reduction in these PAs has not yielded better results for the pitcher, which might have been expected if for no other reason than selection bias (that is, the starters going the third time through the order would presumably be those pitchers who were pitching better on that day). The reason for the diminishing number of PAs facing a starter for the third time can perhaps be gleaned by the next chart.
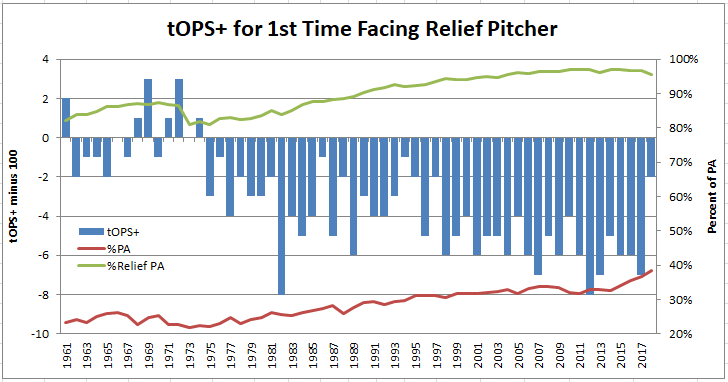
This chart shows the same tOPS+ data for the split represented by PAs facing a reliever for the first time (note that this is all instances of facing a reliever for the first time in a game, not just for the pitcher relieving the starting pitcher). Thus, batters have fared worse than average in this split every year since 1974, including a 7 year run (2011-17) with pitchers enjoying a at least a 5% OPS+ advantage (2018 saw only a 2% edge for pitchers, the lowest result since 1997). So, if a manager is debating whether to have his starter make that third trip through the order, evidence would certainly support going to the bullpen rather than rolling the dice on a tiring starter.
The lines on the chart also tell a story of the expansion and refinement of relief pitching. The red line shows percentage of total PAs represented by this split, which was below 25% before 1980 but now has risen to almost 40% of PA. The green line shows the percentage of relief PA represented by the split, which was in the 80%-90% range until about 1990, but is approaching 100% in recent seasons, with relievers now seldom asked to pitch more than two innings.
If OPS+ percentages above and below average are leaving you a bit nonplussed, here are those same results using more familiar measures.
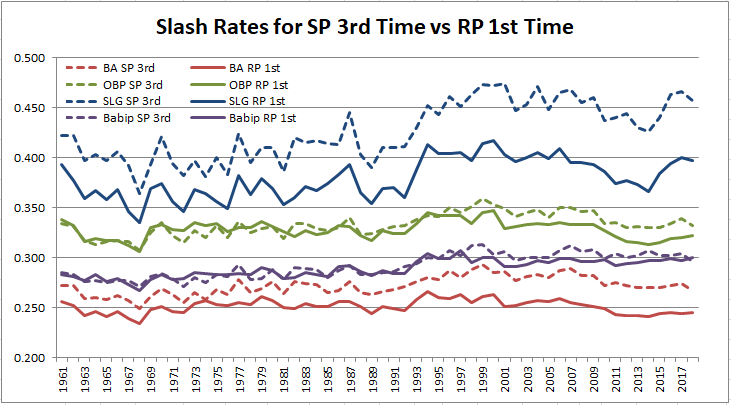
A lot of lines here, so let me explain. The red lines are for batting average, green for OBP, blue for slugging and purple for BABip. And, all the solid lines are representing relievers facing a batter for the first time, while the broken lines are for starters facing a batter for the third time. Thus, when you look at the two lines for each color, you can see how much of an advantage or disadvantage the starter had compared to the reliever.
In batting average, relievers enjoyed a 10-20 point advantage in the early part of this period, and a 20-30 point advantage in more recent years. However, there was no OBP advantage to speak of for relievers until about 20 years ago, and it is still much smaller than the BA advantage. But, the biggest advantage, by far, is in slugging, going from a 20-30 point edge for relievers in the 1960s and 1970s, to a 50-70 point advantage in the past two decades. I added in the BABip lines because I was curious whether it would reflect the presumably harder contact indicated by those large slugging spreads. The harder contact is undoubtedly real, but it doesn’t show up in BABip (you’ll see why in the next chart).
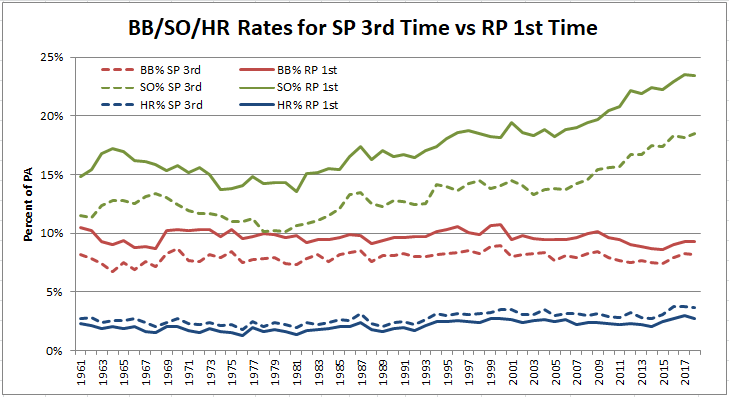
Same type of chart, except now showing the percent of PAs resulting in each of the three “true” outcomes of a home run, strikeout or walk. The one advantage enjoyed by starters facing an opponent for a third time compared to a reliever just entering the game is in control: the starter allows fewer walks, though that edge has narrowed in recent years to just a percentage point or two. Relievers, though, have the edge over starters in the other two metrics, a big one in strikeouts and a smaller but growing edge in home run rate. The one surprising thing (to me) about the strikeout edge is that it has been substantial throughout this entire period, not just in the recent past when almost every reliever seems to be a flame-throwing strikeout machine. And, don’t be fooled by the scale of the chart making the home run edge seem so small; relievers have had a 20% or better edge in home run rate vs starters in 11 of the past 13 seasons, including a 25% or better edge in five of those campaigns.
The big strikeout edge for relievers is the main reason that BABip results in the previous chart were about the same for starters and relievers. If you’ll permit me to exaggerate to make a point, let me suggest that when a reliever makes a mistake with a pitch, the batter will hit it hard, but when that reliever hits his spots, the batter doesn’t put the ball in play at all. If that batter were to cut down his swing to try to make more contact, or if that reliever were to occasionally ratchet down the fastball velocity a bit, just enough to put the batter off balance, then there would probably be considerably more weak contact against relievers, and a noticeable BABip edge for relievers compared to starters.
As usual, Doug, this is great fine-grained research addressing a basic issue of the game’s structure (and the charts help determine whether a new eyeglasses Rx is called for)!
The results are not surprising, except perhaps in their scale, which is probably larger than I’d have predicted. But one of your phrases raised a question: “. . . the recent past, when almost every reliever seems to be a flame-throwing strikeout machine.” This is certainly true of closers, and, at least among leading starters, we’ve also seen a sharp rise in K/9 (presumably because they now expend their tanks of gas with six rather than eight or nine innings in mind). But the third time through rarely involves the closer, except in games where batting has been extremely subdued. The third time through is PA 19-27, and an average game has about 38 PA now, so your figures here generally relate to starter/middle reliever transitions, often as early as the fourth or fifth inning. The later the initial reliever enters the game, the more likely that the third time through will also involve a reliever/reliever transition, since pitchers who enter as firemen in early innings often are asked to eat innings, but will less often be true for set-up men (at least, that’s my understanding; I’ve never seen data on this).
Your charts reveal interesting things about starters too, such as the relatively weak showing on third-time through during the ’60s “era of the pitcher,” compared to the decade following, and the anomaly you note that starters are not necessarily maintaining their strength through their diminishing innings assignments over the past four seasons. To get a more complete picture of what that means I suppose we’d need both tOPS+ and OPS+ — if starters are reducing OPS+, then the rise in tOPS+ third-time through might be seen as simply a trade-off, or quality maintenance built on an improved base. (I suspect that may have been true in the ’60s.)
I agree with the distinction you’re drawing between closers and other relievers, particularly those who might relieve a starter in the middle innings. Unfortunately, though, the available data are for all relievers who face a batter for the first time which, for recent seasons, is pretty close to all relief innings, period. That said, all relievers might be a reasonable proxy for those relieving a starter (less so for relieving a starter in the middle frames), bearing in mind that closers account for only one inning, for only one team, and not for every game.
I too am struck by the the data from the early/mid 1970s. After the surge of offense in 1969 and 1970 with the mound and strike zone changes, the pitchers regained the upper hand pretty quickly in terms of run prevention, yet the batters did progressively better in early 1970s. Then when the DH rule came in and you’d expect the batters to do better still, the pitchers started to improve the third time through the order. As you suggest, probably need to look at OPS+, and also at the 1st and 2nd time through the order, to really understand exactly what was going on.
Doug, I happened across a couple of recent articles on this issue, one very substantive (by Ben Clemens, on FanGraphs), the other a spin-off note with comments on Tangotiger.com. Neither does in-depth statistical work, and both come at the question from a different angle, focused on an early 2019 season’s trend that shows starters with lower ERAs than relievers (!) and similar K/9 rates. Clemens, in particular, is focused on third-time through issues, and discusses the possibility that shorter starter stints may be erasing some of the difference in styles of pitching, starters increasingly going all out on velocity like relievers.
After posting that last comment I discovered that Chris Sale struck out 17 in a 7-inning start tonight. The Play Index says that has never been done before. Sale made 108 pitches, so that’s obviously not a case of a starter pitching like a reliever, expecting a short stint to allow him to exhaust velocity from that game’s start. (As I was typing this the game ended — Sale, who gave up only three hits, got a No Decision in a BoSox loss.)
Not coincidentally, that was also the longest start for any pitcher recording 80% of his outs via strikeout. Max Scherzer did it in 5.2 IP, the longest of 12 such starts (before Sale) of 4 or more innings, all of them since 2010.
The idea of starters pitching more like relievers would tend to square with the higher tOPS+ over the past 20 years for the 3rd time through the order. The lower OPS+ for the first two times would drive that down overall, raising the tOPS+ for the 3rd time as those “all out” starters begin to tire.
This is the line I was thinking along, but I wonder whether OPS+ is the right metric to use for the first and second time through, since the subset of those PAs we’re interested in just relate to starters, rather than starters vs. relievers. Because OPS+ is normalized to 100=ave., it seems to me less likely to reveal any absolute changes that are happening than OPS would be (after all, league-wide, the park factor would cancel out anyway).
You’re quite right, Bob. OPS is what I should have said, not OPS+. And, it is the max effort starters in the first two times up that drives OPS down, not up, that can lead to high tOPS+ scores in the 3rd time through the order.
Geroge Springer had a beastly first quarter of the season, leading the league in almost everything, and being on pace for
146 R
207 H
33 2B
60 HR
146 RBI
421 TB
What stands out are the RBI and Total Bases, considering he is the Astros’ leadoff hitter.
Most RBI from the one-hole:
103 … Charlie Blackmon
100 … Darrin Erstad
99 …. Alfonso Soriano
98 …. Nomar
97 …. Jacoby Ellsbury
93 …. Brian Dozier
91 …. Johnny Damon
90 …. Francisco Lindor
90 …. Grady Sizemore
88 …. Johnny Damon (4 bloody sox in 15 years)
88 …. Craig Biggio
__________________
Most TB from the one-hole:
383 … Blackmon
368 … Soriano
365 … Nomar
365 … Erstad
348 … Sizemore
345 … Ellsbury
344 … Jimmy Rollins
334 … Soriano
332 … Bobby Bonds
331 … Mookie Betts
331 … Earle Combs
Springer’s last 3 games (.692/.733/1.385) have been something. Through games of May 14th (his first 43 games), he leads the majors in R and HR, and leads his league in H, RBI and TB (and SLG, OPS and OPS+). But, through 40 games (to mark the quarter season), his majors ranks were R (10th), H (19th), HR (3rd), RBI (8th) and TB (6th).
Springer’s 5-5-5-4 line score on Sunday was the first in almost 100 years, joining 5 games of 5-5-5-5 (last by Steve Garvey) and 2 games of 5-5-5-7 (last by Joe Adcock, his 4 homer game). I recall Garvey’s game being much remarked upon at the time (1977), more particularly since he had gone .139/.169/.152 over his preceding 21 games.
I believe there was a time when Brady Anderson knocked in ~80 runs leading off and everyone thought it unbelievable. It may have been in his breakout season after floundering for several years as a part-time player.
At the risk of upsetting some people, George Springer has already accomplished more in the post-season than a lot of all-time greats – Morgan, Mays, etc….
In 1992 Anderson smacked in 80 and stole 53 bases from the one-hole.
Only two other players have done that:
88/50 … Biggio
81/64 … Reyes
80/53 … Anderson
76/52 … Brock
74/87 … Rickey
72/80 … Rickey
68/50 … Lance Johnson
68/56 … Reyes
_______________
In Anderson’s 50 HR / 110 RBI season in 1996, he batted both
35/69 … leadoff and
15/40 … 2nd
_______________
And on the subject of Rickey, here is:
Since 1901, most RBI with as many SB as RBI:
81/81 … Eddie Collins
79/88 … Clyde Milan
74/87 … Rickey
72/80 … Rickey
71/90 … Tim Raines
71/80 … Eric Davis
69/77 … Omar Moreno
69/72 … Juan Samuel
68/68 … Cobb
67/75 … Lofton
Voomo,
I recall when the Phillies traded Lonnie Smith he almost won an MVP award in 1982. There was talk he would have been the 1st player since Cobb (1915) to go 70/70. He ended up 68/69 and 2nd to Murphy in MVP voting. He was a .316 hitter through his first 482 career games
Ryan Feierabend
https://www.baseball-reference.com/players/f/feierry01.shtml
Third round draft pick at age 17.
A few unsuccessful stints in the bigs ate ages 20-22.
7 years as a AAA pitcher.
A cup o coffee in Arlington at age 28.
4 years in Korea.
Developes a knuckleball.
As a lefty.
Gets signed by Toronto.
And last night, starting his first game in MLB since 2008, pitches his first complete game at age 33.
A 4-inning complete game.
First player to throw a CG with only 4.0 IP since Steve Trachsel on May 11, 2006.
Tough career, Voomo. He has his name in the record books now, which is something. I’d like to see him record a win before this stint is over, or even a save (which would be his first since Rookie League in 2003).
Looking at Feierabend’s career made me reflect on the economics of baseball from the marginal player’s perspective, although B-R provides no salary figures for Feierabend. The MLB minimum wage is $555K, so I assume Feierabend is making roughly $3500 per day since his call up yesterday. He’s on the roster because of injuries, so that status is unlikely to last long, but he’ll return to Triple-A, where the pay is still good in terms of US society: about $10-15K/month minimum during the season. I assume Feierabend would not have played in Korea unless the financial terms were at last somewhat attractive.
But if you count his Tommy John surgery year, Feierabend has been at this for 17 seasons, generally compiling losing records. He’s not only had to play overseas, he also spent the better part of 2012 playing in the Atlantic League, which is outside the organized baseball structure. The closest he ever came to breaking out was in 2008, when it looks like a poor 2007 showing with Seattle led to a demotion back to the Rookie Leagues, from which he climbed back up to AAA, going 7-1 there in thirteen starts with an excellent ERA, which brought him back the Bigs — where he bombed again and went off for his surgery. Amazing to me that after such a setback he returned for another decade of punishment.
The lower minors have sweat-shop labor conditions, but the figures for the high minors are not at all bad, and the Majors are an economic bonanza. I suppose this, and a love of playing, is what keeps mature adults like Feierabend in the game long past the time when there is any chance of their hitting the economic jackpot. Outside of September call-up duties, Feierabend has had about three months of MLB time in his 17 years as a pro. Perhaps he’s the sort who sees a post-playing future for himself in the game, but if he has to begin a new career in his mid-thirties, I’m not sure that investment of years makes good sense. Feierabend ended his education with high school so he could start playing ball, and since he played winter ball in 2012-13 and moved to Korea, it seems unlikely he has established any substantial non-baseball resume. (By contrast, the only other MLB player from his high school, Eric Lauer, ten years younger, went to a four-year college, where he was a star and a standout student, and already has four times as many pitching wins in the Majors — 8 to Feierabend’s 2 — as a regular in the Padres rotation.)
Yesterday’s record-tying performance was, unfortunately, not outstanding in quality: four runs on seven hits in four innings is not going to earn Feierabend a spot when the injured roster players return. Thanks to Voomo’s sharp eye, I’ll now be watching Feierabend’s further adventures and rooting for him to shine in a second or third chance, so that perhaps this long baseball saga will have a happier ending.
Bob:
At the opposite extreme in almost every respect from Feierabend is Craig Kimbrel, who puled down 13 mil last year closing for the world champs. Not his best season, but a 160 ERA+ all the same and 42 saves. Opted for free agency, wouldn’t take the 17.9 mil to stay on a year, and now he’s unsigned and apparently as undesired as he seems undesirable, preferring to sit than to play. Feierabend obviously loves baseball. Kimbrel? 17.9 million ain’t enough to suit up.
nsb,
God only knows what advice he was getting from his agent. “Last chance for multi-year, big payday”? He must have had SOME multi-year offers that they insisted on turning down….maybe 4 years / $ 60 M ? Here’s some old news from MLB Trade Rumors:
https://www.mlbtraderumors.com/2019/04/latest-on-craig-kimbrel-3.html
The guy has never been injured, and is one of the best of all-time.
So he’s taking an extended vacation and enjoying his spring.
There’s more to life than baseball.
Lowest H/9 through age 30, minimum 500 IP:
4.82 … Kimbrel
5.64 … Jansen
5.89 … Marmol
6.04 … Benitez
6.12 … Clippard
6.19 … Nolan Ryan (who had as many IP as the next 4 guys combined)
6.39 … Herb Score
6.60 … Charlie Hough
6.64 … Sid Fernandez
6.66 … Frank Rodriguez
6.69 … Pedro
_____________
Lowest WHIP through age 30, minimum 500 IP:
.888 … Jansen
.920 … Kimbrel
.962 … Ed Walsh
.968 … Addie Joss
.968 … Walter Johnson
1.005 . Kershaw
1.011 . Pedro
1.026 . Huston Street
1.031 . Chis Sale
1.034 . Foulke
1.048 . Mathewson
____________________
Voom
“So he’s taking an extended vacation and enjoying his spring.”
I have long believed that “Youth is wasted on the young but wealth is wasted on the old”. Good to see that he’s enjoying the $ 58M he’s already made
Interesting contrast, nsb. I don’t know whether Feierabend loves baseball or simply has no better options. Kimbrel has earned well over $50m over his short career; if he hasn’t squandered it, maybe the next $50m isn’t a driving incentive for him. Perhaps he’s arrogant or has miscalculated, but Voomo may be on the right track too. He’s super rich and really has nothing more to prove in baseball. Loving baseball and loving the job of playing for a big-league team are not necessarily the same thing. Does the late model Pujols mean that Albert really, really loves baseball?
In any case, I wrote my comment on Feierabend because I’m intrigued by baseball career stat sheets that look as though there may be a dramatic novel embedded within them. I’m a sucker for long-time Minor Leaguers who get their shots at the Bigs late and make good. (I think Diomedes Olivo first whetted that taste.) When I followed up Voomo’s lead and read about Feierabend, I was struck that “making good” in this case was ironic — he pitched poorly and his record-tying feat is, in fact, by definition a losing one. It seemed poignant. I’d really like to see a happy ending.
Bob, Voomo, nsb,
I believe JD Drew retired with a little left in the tank as well. But, based on his typical 120 game season, some might say he was already long retired
There’s something about being 30. It’s a transitional moment and not just because of the number. I think a lot of athletes who decline in their early 30s do so not because of physical reasons but because they haven’t taken the time to adjust to the internal transition that happens at that age.
In the most common esoteric language it is referred to as the Saturn Returns, and takes place between 28-31.
Voom,
Strangely enough, as a Capricorn (ruled by Saturn) myself, the 6 months prior to my 30th birthday were like watching paint dry. There was a sense of pending doom or some significant event that never took place….but, definitely, a sense of things moving much too slooowwwwly. Pretty weird. Supposedly, it takes Saturn 2 1/2 years to pass through each house, the completion of which is, obviously, 30 years (12 houses x 2.5 years). Turning 30, or Saturn returning to Capricorn, literally, is supposed to be a rebirth of sorts.
By the same token, there have been an awful lot of fantastic seasons turned in by 30 year olds (Off the top of my head – Allen in 1972 and Frank Robinson in 1966, after trades, no less). Not quite 27, but, the skills are still there, for sure.
I’m also a fan of stories like that. One of my favorites is Rich Sauveur, who has his own inglorious distinction – most teams pitched for without a win. 6 of them, which doesn’t include all his stints in the minors. With a name like Sauveur (savior in French), it’s a shame he wasn’t a lock-down closer.
He was drafted in 1983, in the 11th round.
Made his debut in 1986 – 6.2 innings, 2 runs. Pitched well enough to win but got a no decision. His next two starts were pretty crummy, and he broke his foot late in the season. Spent 1987 in the minors.
Taken by the Expos in the Rule 5 draft. 3 innings in 1988.
1989, needed surgery to remove a bone spur. 1990, broken finger when Vinny Castilla hits him with a line drive in winter ball. It’s his third pretty serious injury in a 4 year period, and he almost hangs them up. Mike Veeck, Bill’s grandson, convinces him to keep playing.
1991 he’s back in the majors, 3.1 rough innings with the Mets. 1992 is 14.1 innings with the Royals, the most innings he’ll ever have in an MLB season, and he’s in the dugout for George Brett’s 3,000th hit.
1993 he’s in Mexico, pitching for the Minatitlan Petroleros.
Has some good years in the minors in the Reds system – becomes a replacement player during the strike.
Makes the White Sox in 1996, but only for 3 innings. Spends the rest of the year at AAA Nashville.
Attends 1997 spring training at Dodgers camp, but gets cut. Pitches in the minors again in the Cubs system.
1998 and 1999 he’s back in the Reds and Pirates farm system.
FInally, in 2000, he moves to the A’s system, and makes his final MLB appearances, 10.1 innings. He finally loses rookie eligibility during this season.
All told his MLB career is 46 innings, a 6.07 ERA, 0 wins, 1 loss, 0 saves. His minor league career is over 1,500 innings with a 2.91 ERA.
He only spends two years out of baseball, before returning to be a pitching coach in the Brewers farm system in 2003. He was the long time pitching coach for the Pawtucket Red Sox, but left the organization when he kept getting passed over for the major league job. Now he’s the pitching coach for the Arizona League Diamondbacks. Will he ever coach in the majors? We’ll have to wait and see.
Numbers-wise, his was a career with very little impact. -0.8 WAR. But he absolutely has a story worth telling.
Great example, CC. I’d never heard of Saveur, but then, that’s the nature of these stories: I’d never heard of Feierabend either. Very different pitchers — Saveur was certainly more successful — although they share the feature of having words from a European language for their last names. Saveur seems to have landed on his feet, staying in baseball, and — echoing nsb — what I found online (as I’m sure you did) was his statement that he stuck with the game out of love for it. That would be a good storyline for Feierabend too.
There must be collections of just these types of stories — I seem to recall having learned about players like Jigger Statz, Lou Novikoff, Buzz Arlett, and so forth over a short period of time. But those guys were all famous for outstanding play, while the ones we’re discussing are just interesting for the sustained ordinariness of their careers, just falling one notch short.
Billy Williams is another one. 15 years in the minors (all with 85+ games) before finally reaching the majors at age 37 with the Pilots. Failed to get a hit in his brief stint with the big club. But, he achieved his goal and retired with that satisfaction after that season.
I don’t recall ever hearing about Williams, Doug, although I see he was mentioned in “Ball Four,” which I read with gusto long ago. I see that, like Saveur, he went on to a post-player career in baseball, mostly coaching in the Minors.
Feierabend recorded 11 years between major league starts. Trying to think of a way to check whether there’s ever been as long a gap (my guess is yes, but I would be interested to know).
Roy Hobbs?
G.H. Ruth went 9 years between starts.
Returned at age 35, threw a complete game victory, while batting third, getting two hits and his 153rd RBI.
Also started two double plays.
Here are some I’ve found with 10+ years between starts.
15 – Fred Johnson
12 – Jim Johnson
11 – Ryan Feierabend, Mike Timlin, Johnny Lindell
10 – Wally Hebert, Harry Kelley, Socks Seibold, Chick Davies
Fred Johnson (or Tex Johnson, or Cactus Johnson) is a real find, Doug. Clearly there’s a good story there.
Johnson’s first season in organized ball appears to have been at age 27, and his late season call-up to the world champion Giants a year later showed fair promise ( a 10-inning complete game loss and an 8-inning 3-run outing), and he made the 1923 squad but was dropped in May, perhaps because of his age, which seems ironic now, considering how he resurfaced at age 44 with the Browns and picked up three wins and three saves for a seventh place team.
Two things caught my eye:
1) In his best year, pitching for New Orleans in the Southern League in 1933 (21-9, 3.03), he was one of fifteen players who made the majors, none of whose names I recognized except that of Denny Galehouse, the journeyman starter who pitched two complete games in the 1944 Series, winning one.
2) The 1922 and 1923 leader in OPS+ for the Giants, albeit as a platoon lefty, was none other than Casey Stengel.
Johnson’s late start may perhaps be related to possible wartime service in World War I. I say that only because Johnson’s 1973 death notice in the NY Times mentions that he died at a VA hospital.
Johnson also recorded his first Save at age 44.
As bad as the Browns were in 1938, I’d love to know the story of how and why they acquired a 44 -year-old minor leaguer who was with Detroit’s double-A team.
It appears that the Tigers and Browns may have been “sharing” the Toldeo Mud Hens in those years, which wouldn’t be that surprising considering how tight the Browns finances were. Johnson played for the Mud Hens each season from 1937 to 1940, with B-R noting a Detroit affiliation for the first three seasons, and a Browns affiliation in the last year.
There’s an interesting article in the New York Times today about the way that increasing pitch speeds are affecting the game. (I hadn’t known that, MLB, which recently contracted with the independent Atlantic League to have that league serve as a sort of laboratory, is going to have them test out moving the mound back two feet during the 2020 season.)
Whoops! That was the Washington Post, not the Times. Sorry. (But the link’s ok.)
And, coincidentally, FiveThirtyEight.com has just posted an article addressing the same issue, but focusing on breaking pitches.
An interesting article in indeed, touching on a number of factors, from physiology (increasing size of pitchers, upper limit of pitch speeds) to game strategy (at what point does hitting for contact rather than homers become a strategy to counter dominance of faster pitches).
The article notes that the difference for a batter between 92 mph and 100 mph is 4½ feet, so moving the mound back two feet would make 100 mph look like 97, but 95 would now be 92 or 93, and 92 only 89 or 90. So, that change may be about right.
Surprising thing for me was that the players’ union has to agree to a rules change like moving the mound back. I would have thought the union would be more concerned about the 3 batter minimum rule per pitcher that is coming in next year; that one has the potential to reduce the size of current bullpens and, potentially, rosters (though I wouldn’t be too worried about contracting rosters, as I expect teams would be happy to add another position player to their woefully thin benches).
While I think moving or lowering the mound is a good experiment to try, I’m troubled by the many references I see to the 1893 change, all of which report the surge in hitting that followed, and none of which notes that within five years the pendulum had swung back and its momentum carried the game right into the Dead Ball Era. When you make a change, repercussions don’t always stop with the one you were anticipating.
The Dead Ball Era was characterized by a profusion of “trick pitches,” legal and illegal, through which pitchers fought to regain their leverage, with success. I forget whether both articles mention it, or just the FiveThirtyEight one, but part of the new pitching surge is high-tech training to provide pitchers with breaking balls tailored to fill gaps in their specific pitching styles, and the increased mound distance can potentially increase the impact of those pitches, even as it may initially reduce the impact of the fast ball.
On the hitting side, I wonder why increased velocity has prompted the narrow reaction to increase “barrels” so as to make use of speed and defeat shifts by adding HRs. I recall an article last season, also FiveThirtyEight, that discussed how sophisticated hitter training had become, and bore it out by describing how Lindor and Ramirez were transformed into power-hitting infielders in Cleveland. If training stressed that power hitters simultaneously needed to develop skills in punch-and-judy, small-ball batting so they could represent a double threat, crossing up pitching and shifting strategies, it seems to me that could better shake-up the emerging defensive tool-kit, as well as making the game better.
Count me in the camp that thinks moving the pitcher’s mound backwards wouldn’t help things. Sliders and splitters dominate the fastball era but we’ve been able to move away from the dreaded “big curve”. I think moving the mound back would restore the old fashioned curveball to it’s previous dominance. The angle of the ball’s trajectory through the zone is an underrated factor in hitting. A curveball that crosses the knees at the front of the plate for a strike isn’t really near the barrel path of a traditional baseball swing. It would probably lead to swings we consider more “golfing” than swinging. Point is you’re not really going to increase offense and you may lead into an even more fly ball heavy era.
When people complain about baseball there’s generally three categories
1) Scoring is too low (which I laugh at compared to baseball’s 50s-70s heyday)
2) Games take too long (generally this is about time between pitches and pitching changes but the naive will complain about three true outcome players, too many walks, too many strikeouts or somesuch)
3) More excitement in fielding (this to me is a fly ball issue, people seem to prefer watching 3B/SS/2B get dirty than outfielder’s run under things but again this will be blamed on the shift, strikeouts, and other non-related factors)
I’m thinking moving the mound back makes no change in #1, could extend #2 slightly with pitcher’s having a harder time controlling the same strike zone from further away (more walks), and could make #3 significantly worse.
Can we move the mound forward?
Off topic, but Toronto on Friday started Vlad Guerrero Jr. and Cavan Biggio (his ML debut). Just the third pair of HoF sons to appear in a game, and the first time both were on the same team and first time both fathers were already HoFers.
Others were Eduardo Perez and Tim Raines Jr. (one game in 2004), and Dave Sisler and Earl Averill Jr. (several games over three seasons, in 1956, 1960 and 1961). Guerrero or Biggio could also face Dereck Rodriguez at some point in the future.
Purely to illustrate how the Opener will change how some stats are viewed:
Ryan Stanek is on pace for 43-44 Starts and 91 IP.
Since 1901, fewest IP with at least 40 Starts:
252 … Stan Bahnsen
255 … John Podres
260 … Tom Bradley
262 … Catfish
264 … Jim Bibby
264 … Kaat
267 … Jim Clancy
267 … Chuck Dobsen
269 … Dave McNally
Jim Clancy’s 1982 was the 2nd to last time anyone started 40.
Hough did it in ’87.
Question: Is anyone else being used as Stanek is? I’m too busy to track the answer.
Clearly your attention is occupied… You spelled your name wrong.
Thanks for noticing. Getting older and more feebleminded by the minute.
Curious to see who had the fewest PA while playing at least 150 games in a season:
394 … Jim Eisenreich
437 … Tommy McCraw
438 … Ichiro
455 … Mike Tyson (whose nickname was ‘Rocky’)
462 … Shane Victorino
466 … Dal Maxvill
466 … Jeff Conine
467 … F.P. Santangelo
467 … Andruw Jones
It was Jones’ rookie-ish season, and he did NOT bat low in the order. He hit 5 or 6 all season.
But he had 57 non-starts, 47 of which with one or zero PA.
Eisenreich, the leader, had 72 non-starts, including 67 with fewer than 2 PA.
In those games he was Wes Chamberlain’s designated LIDR.
Chamberlain started 73 games in RF, completing 20.
Eisenreich also had a game with 9 PA (20 innings), singling to start the winning rally:
https://www.baseball-reference.com/boxes/PHI/PHI199307070.shtml
Today, Austin hedges hit a grand salami and struck out 4 times.
He was also hit by a pitch with the bases loaded.
So. Third time in history a player had 5 RBI and 4 strikeouts.
First time it was done in a 9-inning game
Devon White in 1998, hitting the game winning 3-run shot in the 11th:
https://www.baseball-reference.com/boxes/PHI/PHI199808202.shtml
_____
Hank Blalock in 2003, had 6 RBI, and did it without a HR, also hitting the game winner, a double in the 12th.
https://www.baseball-reference.com/boxes/NYA/NYA200305160.shtml