
HHS contributor Michael Hoban has written a comprehensive paper on assessing career value for players of the past century (since 1920), commonly known as the live ball era. In Part 1. Michael introduced his CAWS metric, which stands for Career Assessment Win Shares, based on the Win Shares system developed by Bill James. In Part 2, Michael examines the relationship between CAWS and Hall of Fame-worthy careers.
In Part 1 of this series, I introduced the CAWS metric which takes the form of: CAWS = CV + .25(CWS – CV) where
CAWS = Career Assessment Win Shares
CV = Core Value = sum of win shares for a player’s ten best seasons
CWS = total career win shares
.25(CWS – CV) = longevity factor = credit earned for a longer career
Thus, to balance the quantity (length of career) and quality (core value performance) of a player’s career, CAWS credits players with 100% of the Win Shares for their best ten seasons, and 25% of their remaining Win Shares.
Hall of Fame Thresholds
In evaluating CAWS scores for prominent players of the past century, I’ve determined that the following thresholds provide the best correlation to career standards that are likely to be recognized by Hall of Fame enshrinement.
- CAWS score of 280 for right fielders, left fielders, first basemen and designated hitters
- 270 for center fielders and third basemen
- 260 for second basemen
- 250 for shortstops and catchers
- 220 for pitchers
The different benchmarks for each position recognize their positional scarcity which, for non-pitchers, derive from the different types and levels of defensive skills demanded of players at each position.
Based on these benchmarks, there have been 152 players (104 position players and 48 pitchers) since 1920 who have posted Hall of Fame numbers during their playing career. Ninety-nine (99) of these players have a CAWS score of 280 or better while fifty-three (53) others meet the adjusted HOF benchmark for their position, or one of the special HOF benchmarks for players with unusual or shorter careers (these will be explained below). The 152 players are distributed as follows:
- Pitcher – 48* (43 are in HOF)
- First base – 16** (10)
- Second base – 14*** (9)
- Third base – 10**** (7)
- Shortstop – 13***** (11)
- Left Field – 14 (10)
- Center Field – 11 (9)
- Right Field – 12 (12)
- Catcher – 12**** (10)
- Designated Hitter – 2 (2)
* incl. 1 active player
** incl. 2 active players
*** incl. 1 active player and 1 retired player not yet HOF eligible
**** incl. 1 retired player not yet HOF eligible
***** incl. 2 retired players not yet HOF eligible
A player is assigned (with very few exceptions) to the position where he played the most games during his career. So, for example, Paul Molitor and Frank Thomas are considered to be designated hitters because they played more games as a DH than at any one position.
One of the few exceptions to this rule, for example, is Ernie Banks. He played more games at first base (1259) than at shortstop (1125). But in everything I have read (and in the Hall of Fame), Banks is always referred to as a shortstop. So, I regard him as such.
The CAWS Career Gauge suggests that any player who has achieved the CAWS benchmark score for his position has Hall of Fame numbers. The question then arises: What about players who have not achieved these benchmarks, but who appear to have had a great, shorter career? I will address these exceptional cases next.
The 250/1800 Benchmark – Jackie Robinson
Jackie Robinson is a player whose contributions to the game went far beyond his considerable achievements on the field. As most fans know, Robinson had a rather short career of only ten seasons, chiefly attributable to the baseball color barrier that had existed prior to his career. While it is certainly true to say that a player who has such a short career usually will not be able to post Hall of Fame numbers, it may come as a surprise to some when I state that Jackie actually did post HOF numbers during his brief career.
Conversely, it will come as no surprise to most fans to learn that there are some players who are in the Hall of Fame but do not have Hall of Fame numbers, with examples like Chick Hafey and Rick Ferrell that come readily to mind. And there is another category of players, such as Dick Allen and Darrell Evans, who do have HOF numbers, but who have not been elected to the Hall for one reason or another.
Since 1920, I have found only ten position players who attained a CAWS score of 250 while playing in fewer than 1800 games. Every one of these ten has been elected to the Hall of Fame despite playing in relatively fewer games than their contemporaries.
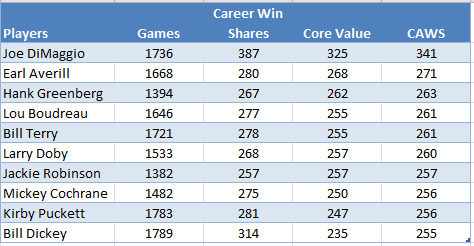
Of course, Joe DiMaggio stands out among the players in this group as the one who achieved the most in a relatively short career. But note that Jackie Robinson played the fewest games among this elite group – and yet he was still able to achieve the CAWS benchmark.
Bear in mind that, while the above players met the 250/1800 benchmark for their careers, some elite players do so well before their careers end. Albert Pujols is a prime example: he is still active this year in his 19th season, but achieved the 250/1800 benchmark almost a decade ago, in 2010.
As an interesting aside, note how close the numbers place Jackie Robinson and Larry Doby – the two players credited with integrating the National League and the American League, respectively. Each of these players had a core value (CV) of 257 meaning that each averaged almost 26 win shares over his ten best seasons – an outstanding accomplishment. So, aside from being the integration pioneers, both Jackie Robinson and Larry Doby were terrific ballplayers.
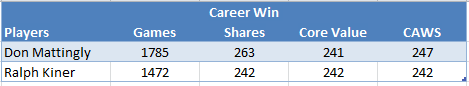
Keep in mind that there have been other outstanding players who have played in fewer than 1800 games in their careers – but who did NOT achieve the 250 CAWS benchmark. Here are two, one (Kiner) who is in the Hall of Fame, and one who is not (Mattingly).
High Peak or High Career Value – Pedro and Eck
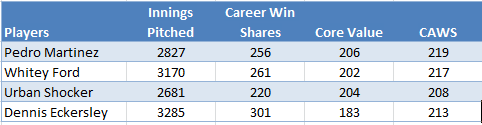
The HOF benchmark for pitchers is a CAWS career score of 220 that has been achieved by only 35 pitchers since 1920. The question then arises: What about a pitcher who has not achieved this benchmark, but who appears to have still had a great career?
A few pitchers who fall short of the 220 CAWS threshold nonetheless compiled stellar careers. A career with a high peak value is evidenced by a 200 Core Value (sum of ten best Win Shares seasons) that a couple of the 220 CAWS qualifiers did not achieve. And, one pitcher (with a notably unique career shape) recorded a high career value of more than 300 career Win Shares without reaching 220 CAWS or 200 CV.
The 180/2400 Benchmark – Sandy and Dizzy
To fairly recognize exceptional performance by starting pitchers with shorter careers, or relief pitchers with very long careers, I’ve identified 180 CAWS in a career of less than 2400 IP as a suitable benchmark.
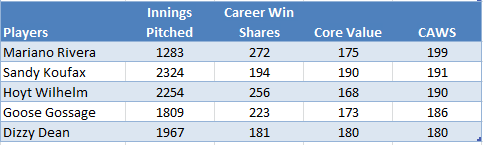
All five of these pitchers are in the Hall of Fame and deservedly so since this is quite an accomplishment. In fact, these are the ONLY PITCHERS since 1920 that I have found who have achieved a CAWS score of 180 with fewer than 2400 innings pitched.
But what if a pitcher had achieved this benchmark at some earlier point in his career? Logic would dictate that the pitcher in question had accumulated Hall of Fame numbers at that point in his career irrespective of what happened subsequently.
If you examine Pedro’s career through 2004 (his thirteenth season), he had already reached a CAWS score of 180 in fewer than 2400 IP, putting him in company with Koufax and Dean, whose careers were less than 13 seasons. Only two other pitchers since 1920 have reached the 180/2400 benchmark by their thirteenth season.
Therefore, in the live ball era, only eight pitchers achieved a CAWS score of 180 in fewer than 2400 innings – and the seven who are eligible are now in the Hall of Fame. So, for a pitcher, 180/2400 becomes a Hall of Fame benchmark.
The 160/1500 Benchmark – Mariano Rivera
As we just saw, Mariano Rivera has HOF numbers because he is one of just eight pitchers who have earned a CAWS score of at least 180 in fewer than 2400 innings pitched. But Mariano is the extraordinary exception, a relief pitcher who meets the HOF standards for a starting pitcher. But, what should the HOF standard be for every other reliever who is not Mariano?
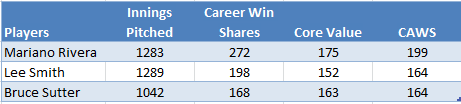
In wrestling with this question, I looked at the careers of all the great relief pitchers to try to establish a benchmark that would recognize the best – but would not be “too easy”. What I found was that only three pitchers since 1920 have achieved a CAWS score of 160 while pitching fewer than 1500 innings. Here are those pitchers, all of whom are in the Hall of Fame.
And, here are the CAWS scores for several other great relievers who did not reach 160 CAWS.
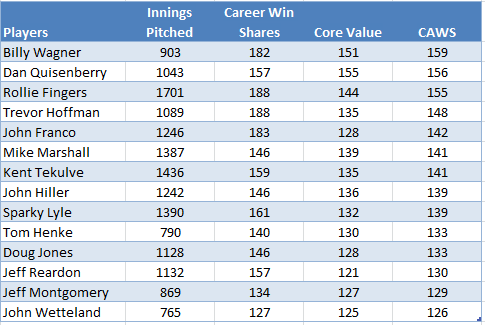
Only two of the relievers falling short of 160 CAWS are in the Hall of Fame, one (Fingers) who is recognized as being one of the pioneers of modern relief pitching, and the other (Hoffman) who is second only to Rivera in career saves, and more than 100 saves clear of Lee Smith in 3rd place.
In Part 3, I will present CAWS scores for all of the players meeting the Hall of Fame thresholds for their positions. If you don’t want to wait, you can look up the Win Shares for any player and, after cutting and pasting that result to a spreadsheet, you are a few clicks away from computing their CAWS score.
There is so much to discuss here that it is difficult to know where to begin. Mike’s system invites almost endless (why “almost”?) opportunities to question whether the rankings and cut-offs align with what we think should be the threshold for Hall membership. In that sense, it is most interesting at the borders, the type of cases that nsb’s series has focused on.
There are two very distinct ways I see of approaching Mike’s list — and I hope he will forgive the fact that, naturally, it’s more interesting to begin by questioning the outcomes on the list than by affirming their match with our intuitions (who will question Joe D’s Hall cred?). The first is to ask how well Mike’s cutoffs match the actual cutoffs made by Hall voters, writers and committees. That is to look at Mike’s list as an alternative to Bill James’s Hall of Fame Monitor, which aims to be a predictor of Hall selection. The second is to ask whether the list matches what we think players’ records indicate as the right outcome: not a predictive list, but an evaluative one. Mike has noted points at which his cutoffs serve well as predictors of Hall vote outcomes. I think we might want to focus on the evaluative dimension.
On the evaluative side, there are also two ways to approach this. One concerns the appropriateness of using Win Shares rather than WAR, or some other measure. We discussed this aspect quite a bit on the last string. The other concerns the appropriateness of the cutoff points (both by position and in terms of the special short-career numbers, where there are two cutoffs involved: career length and CAWS thresholds), and whether they are to be taken as absolute or as first passes as to who has actually crossed the Hall threshold. Although Mike sometimes writes as though he sees those above the cutoff line as Hallworthy and those below as falling short, there are plenty of instances in his book where it seems clear that the cutoff region is an area of negotiation, where CAWS takes us to the starting point of discussion, and then we’re on our own.
Let me give an example where I think the CAWS threshold is, for me, clearly not the end of the argument. Consider Bruce Sutter an Lee Smith (in the Hall via CAWS and for real) and Billy Wagner (outside on both grounds). Mike’s cutoff for the group that includes these two has the two criteria: IP160. Smith and Sutter both have 164 CAWS scores with 1289 and 1042 IP, Wagner has a 159 CAWS score with 903 IP. It’s tempting to argue that Wagner is so close that it’s arbitrary to exclude him on the basis of a one-point shortfall in a basically arbitrary cutoff. But my feeling is much strong: I think Wagner has a far better record than Smith and Sutter. Here are some stats — I’m using WAR (we already have WS figures from Mike), but also several other stats that I believe are good to look at in the difficult case of relief pitchers, and especially closers (HoS is Hall of Stats; WAR is pWAR; WARrate is per 162IP; Best10 is the WAR-based equivalent of Core Value; WHIP is only in relief).
HoS…WAR….WARrate….Best10….ERA+…..WHIP….FIP…..WPA
62……29.3……..3.7…………24.3………132…..1.253…..2.93….21.3……Smith
54……24.5……..3.8…………25.0………136…..1.140…..2.94….18.2……Sutter
65……27.8……..5.0…………24.4………187…..0.998…..2.72….29.1……Wagner
It seems to me just looking at the non-WAR-based numbers, Wagner is simply is another class. Wagner was the superior pitcher in quality, and even in the quantity measures of WAR and Best10 he is on a par with Smith and Sutter, as he is in WS categories as well. This despite the fact that Sutter’s career was 15% longer than Wagner’s and Smith’s a whopping 43%. Given an additional career length of 15%, Sutter compiled 8% fewer Win Shares and 12% less WAR. Given an additional 43% career length, Smith compiled 9% more WS and 5% more WAR.
Personally, I’m not ready to give my coveted Hall vote to Wagner. I’ve been skeptical that we’re ready to set a threshold for closers, and Mariano, I think, demonstrated how far above the current Hall standards a really fine pitcher can go. I think we need to wait a while before assessing where, in the distance between Rivera and others, the line should be drawn. But I feel that it’s clear as is that wherever that line is drawn, Wagner would be closer to it or higher above it than Sutter and Smith, and by a pretty wide margin. (I’d put Hoffman just after Wagner.)
As I see it, the issue here concerns the way we assess “short-career” benchmarks. I think Mike has really enhanced his system by creating these — it would obviously be wrong to leave out DiMaggio, Robinson, Rivera, etc. But it seems to me that what these reduced benchmarks basically consist of are rate statistics, with arbitrary steps that result in borderline areas where higher rate productivity fails to surpass lower-rate only because of the specific placement of the benchmark. I think the implications of Mike’s system suggest that an alternative approach would be to develop a sliding scale that balances WS rate and career length. Smith and Sutter were on the mound for many more innings than Wagner, and if their performance was above average in those extra innings, they deserve extra credit for that, compared to Wagner. On the other hand, if Wagner’s short career produced virtually the same value quantity as Smith and Sutter’s, with higher sustained quality, then I’d see his WS rate as more than compensating for the missing IP. In Sutter’s case, where the added innings add negative net value relative to Wagner, measured by both WS and WAR, it seems to me that any scale that included both quality and longevity elements, rather than a single cutoff number, would have to rate Wagner as more Hallworthy. (I think Smith’s case is even more profound, but Sutter’s case is, perhaps, more straightforward on the math.)
Screwed up: “IP160” was IP less than 1500 and CAWS greater than 160 — I guess I used math symbols that were read as hypertext, and some stuff got swallowed up. (I see other types, but that’s par for my course.)
I have updated the count of CAWS qualifiers by position to show the number who have been elected to the HOF.
I’d like to make a small clarification concerning Jackie Robinson. Robinson’s short career is not “chiefly attributable to the baseball color barrier.” This is a common misperception. Robinson was a multifaceted sports star in college, but he was much better at and perceivably more interested in football, basketball, and track. He played pro football after graduation—not in the NFL—and then spent his time through 1944 being a pain in the neck to his superiors as a lieutenant in the segregated army, a tale told many times. His pro baseball career began in 1945 for the K. C. Monarchs when he was already 26 years old. In 1946 he had an excellent but not overwhelming season at Montreal in the IL (his stats are very similar to those of Marv Rackley, somewhat better, but Rackley was three years younger). Jackie was ready for the Majors that year, no doubt, and so you might say the color barrier lost him a year. On the other hand, had color barriers not existed in 1941, Jackie would have gone to the NFL, not the NL.
This situation, to me, makes his success even more remarkable.
Here’s an interesting fact: Jackie Robinson was born nearly 22 months before Stan Musial.
And when Musial retired, Robinson had already been a corporate VP for nearly seven years.
Your points about Robinson are well taken, nsb. The War may not only have led Robinson to baseball, but prepared him for what he would face in integrating the Majors. I’ve quoted this before here; it’s Pete Reiser speaking about his time in the military:
One day a Negro lieutenant came out for the ball team. An officer told him he couldn’t play. “You have to play with the colored team,” the officer said. That was a joke. There was no colored team. The lieutenant didn’t say anything. He stood there for a while, watching us work out. Then he turned and walked away. I didn’t know who he was then, but that was the first time I saw Jackie Robinson. I can still remember him walking away by himself.
Well, it’s been quiet here, so I’ll raise another issue — actually two, both related to the discussion of the 2400 IP short-career benchmark.
Consider these two pitchers:
CAWS…….IP………CWS…….CV……..WS/162IP…..CAWS/162IP
230…….2623……..233…….229………..14.4……………….14.2………Wes Ferrell
191…….2324……..194…….190………..13.5……………….13.3………Sandy Koufax
Note that Ferrell has 13% more career IP, but exceeds Koufax in total WS by 20%, has a much higher Core Value, where both pitchers are on a level playing field (ten best seasons), and compiled both more WS and more CAWS per IP. But Ferrell does not have HoF numbers while Koufax does. The reason is not what the two pitchers did on the field, it is because the IP threshold for the easier qualifying numbers falls between them. Here’s a case where I believe both players deserve to be in the Hall, though Ferrell is still outside, but the reasons aren’t easily captured by formula. Ferrell, in my view, steps over the threshold because of his exceptional hitting contributions; Koufax because of the shape of his career, where everything Hallworthy is packed into consecutive exceptional seasons at the end of his career (82% of his WS fall in his final six seasons; 63% in the last four).
What makes 2400 IP the appropriate number in light of this comparison? I think it’s a hard question to answer. Of course, Ferrell is outside the Hall, so the formula predicts Ferrell and Koufax correctly. But is that Hall outcome appropriate?
I want to make it clear that I don’t think this invalidates CAWS or its short-career benchmarks. I think CAWS generally gets us pretty close, and without the short-career benchmarks it would not. But the point of the benchmarks, it seems to me, is as much to focus more attention on the close calls as it is to sort players into in/out categories. If not for CAWS, I wouldn’t have come up with this Ferrell/Koufax comparison; I think it’s interesting, and the credit goes to CAWS, so long as CAWS is not used to close the conversation.
An associated issue is raised when Mike writes,
But what if a pitcher had achieved this benchmark [180 CAWS/2400>IP] at some earlier point in his career? Logic would dictate that the pitcher in question had accumulated Hall of Fame numbers at that point in his career irrespective of what happened subsequently.
This is actually not part of the CAWS system and I really can’t see the justification for it. If a pitcher were to pitch 2400 innings and achieve a 180 CAWS score, but then go on pitch an awful season of 200 IP with zero WS, why would that pitcher be Hallworthy, while another pitcher, who began with an awful season of 200 IP followed by 2400 innings that gave him a total of 180 CAWS, not be? What is the principle here? (Of course, I also believe that everything in a player’s career counts when considering his career value and Hallworthiness, a point I’ve argued ad nauseum with regard to Lou Brock. But that’s a different argument.)
Points well taken, Bob. I suppose you’ll always have issues at the margins, however you do it.
I was surprised that Ferrell’s WS were so much higher than Koufax’s, but I suppose that’s because you’re looking at 2500 IP for Ferrell’s 10 best vs. only about 2200 IP for Koufax. Yes, Koufax out-ERA’ed Ferrell by 133 to 117, but he also had only 5 seasons of his 10 with 200 IP vs. 8 for Ferrell, so that’s 3 more seasons that Ferrell had where he was in a better position for a larger share of his team’s wins.
The other big difference between their seasons was that Koufax was playing for a consistent contender/pennant winner and Ferrell wasn’t. We talked in Part 1 about whether WS was “fair” to players on bad teams, but I think you have to ask the same question about good teams as well. Yes, there are more wins to share on a good team, but a good team with a lot of star power means a lot of competition for those wins, whereas a dominant player on a bad team will tend to get the lion’s share of wins almost by default, since there is so little competition for them from his teammates. Not saying that’s what happened here, but I wonder whether Koufax might not have been “short-changed” by WS, just because he had a lot of teammates also deserving of their share of the team’s wins.
Just noticed that Ferrell played some LF for one season. It was the end of the 1933 season, and it seems that Ferrell pitched himself out of the Indians’ rotation. For his first 14 games (13 starts), he was a world beater with a 2.21 ERA. For the next 14 (also 13 starts), his ERA was 6.44 and the Indians had apparently seen enough. The day after his last start, he was in LF, taking the place of Joe Vosmik who had gone down with an injury a few days earlier; Ferrell stayed in LF the rest of the year, then was dealt to Boston early the next season.
I’m confused about Pedro Martinez being included in the 180/2400 group. he pitched over 2800 innings and in Mike H’s long work he is credited with 256 WS, 206 CV, and 219 CAWS.
Another question: Is there a different source for CAWS figures than this work (A Century of Modern Baseball: 1920 to 2019)? Or are there two? I’m going by the figures in the one that Bob Eno posted a link to awhile back, and the numbers Doug has posted for WS and CAWS in the COG career stats section vary from that source, sometimes considerably. Whitey Ford’s CAWS rating in the link is 217, but in the COG stats section it’s 193.
I calculated the WS for the COG pages using the link on Bill James’ site. Don’t know why they would vary from Michael’s unless James has revised his methodology since Michael did his calculations.
You’re bang on about Pedro. Guess, we’ll have to get Michael to explain that. Using his current WS on James’ site, Pedro comes in at 219 CAWS (207+12), one shy of Michael’s cutoff for careers over 2400 IP.
Generally, I use the Baseball Gauge to track WS; it’s actually more complete than James’s site (and I find James’s site much harder to use). But the Gauge page is down this morning, so I can’t confirm what it has for Ford. The CAWS figure of 217 is what appears in Mike’s book. By my calculation, James’s site’s figures and Mike’s figures match: CWS 261; CV 202: 202 + (.25*59) = 216.75.
The Baseball Gauge is back online and I see its figures are not identical with James’s. CWS 252.3; CV 195.3: 195.3 + (.25*57) = 209.55 (210). I have no idea why the Gauge’s figures don’t match James’s. It’s not just because the Gauge’s seasonal figures are not rounded; although the differences in any given year are never large, the Gauge’s figures are consistently slightly lower.
1. Bob wrote: “Note that Ferrell has 13% more career IP, but exceeds Koufax in total WS by 20%, has a much higher Core Value, where both pitchers are on a level playing field (ten best seasons), and compiled both more WS and more CAWS per IP. But Ferrell does not have HoF numbers while Koufax does.”
But CAWS indicates Ferrell DOES have HOF numbers.
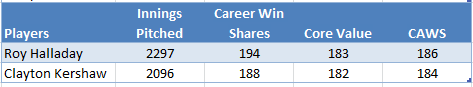
2. Pedro, Roy Halladay and Clayton Kershaw each is in the 180/2400 group because each achieved this benchmark at some point in his career. If someone achieves HOF numbers at some point in his career, subsequent performance cannot erase that distinction.
Albert Pujols achieved HOF numbers in his first 10 seasons. If the rest of his career had been a disaster, he would still have achieved HOF numbers.
Mike, You’re right. I’ve made an error by reading poorly. In your book, which is what I rely on, you set the starting pitcher benchmark at 235. I see now that in your update article and this post, you have lowered it to 220. Since I’ve only consulted the article for updated player rankings and skipped the defensive adjustment figures at the start of the post because I assumed I already knew them, I botched my comment. (Now I’ll have to poke around to see whether Ferrell can be replaced in the argument I was making . . . but not at the moment; we’re expecting a tornado and I’m rushing this out before I unplug my home.)
Can you provide some background for why you lowered the benchmark? (Or have I also read your book wrong?)
It’s also true that in the WS system, which has no negative numbers, “HoF numbers” would be “clinched” the moment a player crossed the threshold. As I explained in an earlier comment, that is not the way I prefer to consider a player’s Hallworthiness. I think the whole career counts. It’s somewhat similar to our disagreement about how 3000 hits in itself constitutes a Hallworthy career.
Hah! The tornado skipped our town in favor of some cornfields to the west — no accounting for taste.
So in the interim I did find a substitute for Ferrell, Urban Shocker, and I wrote a long post showing why he generally had the advantage over Koufax according to WS and CV, despite being short of a 220 CAWS score and being long of 2400 IP. But all that work had to go out the window when I checked your article and discovered a loophole that let him in, one that’s in neither your book nor your post: a CV score of 200+ punches his ticket now (as it does Ford and Pedro — poor Dolf Luque and Dizzy Trout are left hanging at 199!).
Actually, if you include your statements here, Shocker would be in anyway, because he had 190 WS and 190 CV after 2221 IP, which would have locked him in regardless of how poorly he may have bombed later — of course, he didn’t bomb: he had a couple of good seasons and then died.
Here’s something that concerns me — it applies only to starting pitchers (I haven’t gone back to look at hitters). Relying on your book now (and so looking at these lists as of 2012, excluding some recent players but including the Deadball Era), there were 48 starting pitchers who made the cut based on a 220 CAWS score. Of those only two do not have a CV of 200 or better: Nolan Ryan and Don Sutton. In the book, you pick these guys up (you needed to, since your benchmark then was 235, and they were in the 220s) by creating a loophole that anyone with 300+ WS is in, regardless of CAWS. So, in fact, the CAWS formula is not necessary for picking out those 48 pitchers; they get in by other standards, and there is no one who gets in by the basic CAWS formula alone. Two additional starting pitchers, Koufax and Dean, are picked up by lowering the CAWS benchmark from 220 to 180 for low-IP pitchers, but each could equally well have been admitted by lowering the CV benchmark from 200 to 180, which would actually have been a more modest form of adjustment. Again, the CAWS formula really plays no role because those two guys are virtually 100% CV.
The virtue here is that your WS-based system does identify pitchers who are Hallworthy, recognizing through flexibility that CAWS alone is not the last word.
On the other hand, the same loopholes seem to pick up Deadball Era guys whose credentials may not be as solid as they should be. For example, the CV>200 benchmark brings us Babe Adams (CV 206) and Jack Chesbro (209). It seems counter-intuitive to invite those two guys into the Hall, but to leave out, say Luis Tiant, who has a CV of 198. If you look at pWAR, Tiant’s 65.6 dwarfs Adams (49.7) and Chesbro (42.3). Stcking with WS, compare Tiant and Chesbro: Tiant has 22% more CWS and a higher CAWS score: the Core Value loophole overrides that.
Now, you could make the argument that Chesbro belongs in the Hall simply on the basis of including a 41-win (53 WS) season in his career. That one season is really Chesbro’s entire case, and, in fact, that’s really why he he was voted into the Hall. His other nine CV seasons produce an ordinary 156, fewer than 17 WS per year during his best seasons (apart from 1904). I don’t think Chesbro belongs in the Hall — I think the Hall should have a plaque to his 41-win season (which, of course, ended with a fiasco) — but if he’s there, I think it should be because of ’04, not because, mathematically, it brought his total for 1899-1908 up over an arbitrary bar. Take any pitcher who was a competent starter for nine years and insert a 41-win season in the middle and they become a Hall of Famer. It’s the season that makes the pitcher great, rather than vice versa (as in the case of Ed Walsh and his 40-win season).
I’ve updated the narrative to clarify that Pedro qualifies on the basis of reaching 180 CAWS in his first 2400 innings.
On p. 40. Mike has Pedro qualifying on the basis of CV > 200.
I think it’s easier to argue for that benchmark than for the reduced IP benchmark for pitchers who go on to pitch more innings, and whose full careers wouldn’t qualify them.
Dizzy Trout would be an example. He does not have Hall numbers, according to Mike’s article (CWS 228; CV 199; CAWS 206 in 2726 IP). However, if you look at his record as of the end of the 1950 season, he has 205 CWS and a CV of 177, for a CAWS number of 184, all in 2373 IP. That would put him in the Hall, according to the criterion you’re building in. Yet nowhere in his book, article, or post does Mike indicate that Trout has Hall numbers — his career ground to halt, and given the Wartime conditions under which Trout compiled 83 of his CWS/CV, I doubt that he would be a serious candidate. (Of course, Trout almost gets in under Mike’s CV > 200 criterion anyway.)
I don’t know how many other pitchers might fall into Trout’s class, but Trout seems to me a cautionary message. Mike’s other exceptions (e.g., CV > 200; CWS > 300) all generate easy lists to test whether those who qualify under the exception seem to justify the added rule. It’s much harder to determine which pitchers had 180 WS at 2400 IP, in part because that’s not clear from a first look at the stats, and in part because that IP threshold can be passed mid-season, when WS calculations are unclear.
Some other pitchers who also made the 180/2400 benchmark (at least, as I calculate their records, late at night), but who seem unlikely members of the Hall:
Through 2400 IP >……………………………Full Career
IP……….CWS…….CV………CAWS……………IP………….CWS………..CV…………CAWS
2278…..186…….186……….186……………..2661……..212………..195…………199………Sam Leever
2395…..187…….185……….185……………..2937……..223………..196…………203………Bob Shawkey
2253…..183…….183……….183……………..2783……..220………..200…………205………Lon Warneke
Warneke also qualifies under the CV >/= 200 rule.
I don’t see any of these three on Mike’s lists (Leever’s career was in the Deadball Era, so he wouldn’t be in the article, but I’m not spotting him in the book’s lists either). I think the Hall cases for all three are not strong. Leever received only one vote for the Hall, but he’s an old timer. Warneke peaked at 6.5% in 1964. Shawkey never received a vote. The HoS ratings for the three are: 77, 82, 82 (Dizzy Trout, by the way, is at 96, a stronger case by the HoS system).
Warneke reached 183 CAWS and Trout got to 199 in their last season under 2400 IP. So, they should both be included by the rule that puts Halladay in. Others who make it the same way:
188 – Mel Harder, Eddie Rommel
186 – Billy Pierce
183 – Hippo Vaughn (but deadball era)
180 – Dolf Luque, Luis Tiant
Others who came close to reaching 180 CAWS before 2400 IP.
– Dave Stieb had 179 CAWS in his first 11 seasons, which took him to 2458 IP.
– Justin Verlander reached 182 CAWS in his 13th season, during which he passed 2400 IP
Thanks Bob.
I’ve updated the narrative again. I think I’ve got it right now, but please let me know if you see something amiss.
Just want to point out Christian Yelich’s home/road splits, because they are extraordinary
(which, wouldn’t it make more sense if the word ‘extraordinary’ meant ‘really, really ordinary’?)
Anyway, he is now on pace for 66 HR and 41 SB.
But!
His splits:
.438 / .533 / 1.073 / 1.606
.274 / .377 / .511 / .888
He has a home run for every 6 plate appearances in Wisconsin.
So, correct me if I’m wrong. Jeter traded the 2nd best player in baseball (Yelich), the former NL MVP (Stanton), a part-time CF and full-time outfielder who hit 35+ homers (Ozuna), and the most athletic catcher in baseball (Realmutto). All for the promise of a lower payroll, minor leaguers who might perform at the ML level, and a possible bonus based on the profitability of the Marlins. Geeze, sign me up for that job
Best HR ratio at Home in qualified season. One HR every:
8.38 PA – Barry Bonds (2001)
8.79 – Hank Greenberg (1938)
8.87 – Hank Aaron (1971)
9.05 – Mark McGwire (1999)
9.38 – Babe Ruth (1920)
9.54 – Jimmie Foxx (1938)
9.58 – Mark McGwire (1998)
9.62 – Ted Kluszewski (1954)
9.79 – Jose Bautista (2010)
9.91 – Sammy Sosa (1998)
To change topics a little, currently there isn’t a single position player among the top 10 on the WAR lists for either league who has seen his twenty-ninth birthday, and in fact there seems to me to be a dearth of better players, other than pitchers, who are both older and not not just hanging around. Historically this is an anomaly, since established players tend not to fall off drastically until after their age 31-33 seasons.
Top Ten in WAR, position players ages:
2019: 23, 27, 27, 25, 25, 26, 28, 26, 25, 25
2009: 29, 28, 30, 26, 31, 25, 24, 23, 27, 26
1999: 25, 31, 31, 27, 22, 36, 27, 31, 28, 25
1989: 33, 30, 25, 31, 24, 34, 27, 28, 28, 25
1979: 27, 26, 27, 29, 27, 25, 27, 28, 26, 23
1969: 26, 23, 25, 31, 35, 33, 34, 27, 25, 26
1959: 28, 25, 27, 28, 28, 27, 20, 31, 24, 23
1949: 30, 28, 30, 26, 30, 33, 28, 25, 33, 24
1939: 24, 26, 31, 20, 33, 32, 24, 30, 28, 30
1929: 33, 34, 27, 21, 25, 26, 32, 20, 29, 26
Good way to do a snapshot compare.
it was everybody under 30 in 1979, and only one 30+ in 1959. Maybe a similar result today could be a harbinger of a return of the speed game, on offense and defense.
n s b,
Maybe it’s the ‘improved’ fielding metrics and the greater weight on fielding that WAR appears to utilize? Certainly this would favor younger players with more range than the geezers in their 30’s
I was playing around with the short career qualifier for those who reached 250 CAWS before 1800 games. Some players you might not expect show up:
274 – Joey Votto (11 seasons, 1430 games)
269 – Andrew McCutchen (10 seasons, 1501 games)
262 – Will Clark (11 seasons, 1510 games)
259 – Lance Berkman (11 seasons, 1510 games)
258 – Minnie Minoso (11 seasons, 1500 games)
256 – Jason Giambi (11 seasons, 1483 games)
256 – Jim Wynn (12 seasons, 1576 games)
254 – Ken Singleton (11 seasons, 1561 games)
252 – Todd Helton (11 seasons, 1578 games)
251 – Bobby Bonds (10 seasons, 1416 games)
251 – David Wright (12 seasons, 1546 games)
250 – Bernie Williams (12 seasons, 1537 games)
Bear in mind that these players are all at 250 CAWS in under 1600 games, so their CAWS would all be comfortably over the 250 mark at the 1800 game level of the CAWS qualifier.
I believe James had Wynn as the 10th best CF of all-time back in 1999? Something about the Astrodome and the dead-ball era…he had Wally Berger up there too
I think Wynn deserves to be in the Hall. Berger’s a borderline no for me. But David Wright?
Mike himself writes that Clark and Singleton don’t have Hall numbers on p. 46 of his article. Here are some CAWS figures for these guys (excluding active players); I’ve added in a career rate stat. Berkman and Wynn are asterisked because they qualify under CAWS (a 280 benchmark for Berkman and a 270 for Wynn).
CWS………..CV………..CAWS………..CWS/500PA
321………..252………..269………………….19.4………Clark
311………..276………..285………………….19.9………Berkman*
283………..258………..264………………….18.3………Minoso
318………..266………..279………………….17.8………Giambi
305………..269………..278………………….19.0………Wynn*
302………..260………..271………………….17.6………Singleton
317………..258………..273………………….16.8………Helton
302………..264………..274………………….18.7………Bonds
272………..252………..257………………….19.8………Wright
311………..248………..264………………….17.2………Williams
Adding Berger (per Paul E’s post):
241………240…………240………………….21.3……….Berger
A further note on Berger. Mike adds to his discussion of his 1800 G / 250 CAWS benchmark a glimpse at Don Mattingly and Ralph Kiner, who fell short of 250 but also had fewer games yet. Mattingly’s shortfall in games is not really significant (1785), but Kiner’s is (1472). Compare Kiner and Berger, adding PA, which seems to me a better measure than Games:
…G……….PA………CWS……….CV……..CAWS……CWS/500PA
1472….6256………242………..242……..242………….19.3……………Kiner
1350….5665………241………..240……..240………….21.3……………Berger
I think Kiner has a good case for the Hall (which he is in). Berger (who never reached 1% of the Hall vote) doesn’t have the same league-leadership history as Kiner, whose career was quite spectacular, but he looks very strong in these stats. WAR is less enthusiastic (Kiner 49.5; Berger 42.1).
1. I find Doug’s list (and Bob’s list) of 250/1600 players to be intriguing for the following reason – anyone who is in favor of a “larger Hall of Fame” should definitely look closely at these players (most would be considered at present to be “marginal HOFers”). Of course, players like Dick Allen and Lou Whittaker should not be forgotten.
2. By the same token, anyone who thinks Jack Morris, Mike Mussina or Curt Schilling belong in the Hall has to also logically admit Luis Tiant, Dolf Luque, Urban Shocker and Dizzy Trout (since 1920).
Of course, this would require opening the doors to Cooperstown much wider than at present.
I should have added that if someone is interested in “expanding the Hall,” one should look at
1. Any position player with a CV of 260 – like Wynn, Giambi, Bonds, Singleton and Frank Howard.
2, Any starting pitcher with a CV of 195 – like Tiant, Luque, Shocker, Trout and Jack Quinn.
3. Any “pure reliever” with a CV of 150 – like Wagner and Quisenberry.
In my mind, this is the value of the concept of core value = 10 best seasons.
I suspect that if someone did a similar study using WAR, similar results would emerge.
Mike, This is certainly true. It’s a function of where you place the benchmarks. But for small-Hall people like me the problem is just the opposite: that your benchmark levels are sweeping up players who fit the profile of a Hall of Very Good (e.g., Singleton, Howard, Quinn, Quisenberry), especially when you supplement the CAWS figures with alternative benchmarks, like pitcher CV>200, position player CWS>300, 180/2400 short-career pitcher mark, and 250/1800 position player mark. All these alternatives seem to be ways to align the CAWS system with an intuitively just result, based on one set of quantitative criteria.
Moreover, players like Tiant are already solid Hall candidates (even for small Hall folks) if WAR metrics are used. Tiant rates a 129 in the HoS.
For me, the two main issues are how WS configures the parameters of Hall success, as opposed to other measures, such as traditional stats and WAR, and how CAWS yields results that match a concept of what the Hall is supposed to be. You have answered the second question by the location of your benchmarks (and I gather you changed your mind about how the Hall should enshrine pitchers when you lowered that benchmark). The first question concerns how well the rank order using WS corresponds to what other ways of assessing players suggests.
Mike,
You mentioned (I think) that Pedro and Halladay are the only pitchers with 2400+ IP careers who amassed 180 CAWS before reaching 2400 IP (Kershaw will be another, assuming he gets to 2400 IP), and that that accomplishment is Hall worthy, regardless how their careers ended. But, I think the following pitchers also meet that criterion.
199 – Dizzy Trout
188 – Mel Harder, Eddie Rommel
186 – Billy Pierce
183 – Lon Warneke
180 – Dolf Luque, Luis Tiant
Was there something that disqualified them that I haven’t picked up on?
Mike, I guess I want to add one other response, this to your comment, “. . . anyone who thinks Jack Morris, Mike Mussina or Curt Schilling belong in the Hall has to also logically admit Luis Tiant, Dolf Luque, Urban Shocker and Dizzy Trout . . .”
I think there are two problems with this, One is that it takes as an axiom that Hallworthiness concerns only the application of a consistent metric; the other is that WS provides the sole metric.
For example, as I mentioned earlier, we know that over a third of Trout’s WS were the result of outstanding performance in an era when the War had substantially reduced the average quality of MLB play. Those seasons are not comparable to those the other three pitchers played in despite the fact that statistics fail to reflect the disparity. I think it’s an error to reduce any player to his career stats without exploring the disparate contexts in which they were generated. This would also include, for example, the issues addressed by WPA — how productive of actual wins hitting or pitching may be, given game circumstances, something we have traditionally thought about in anecdotal terms, but we’re now more capable of dealing with in statistical terms. Dick Allen isn’t in the Hall largely because his off-the-field influence on his teams has been viewed as a toxic detraction from his on-the-field contributions. While I think the story about Allen has to understood as more complex, I think the explicit premises of the Hall themselves require us to consider such contextual issues. The single-number stats (WAR, Hall of Stats, JAWS, CAWS) should be discussion starters, not discussion enders — they provide a very rich base on which to build an assessment, but they should be seen, I think, as very far from being the assessment itself.
Moreover, the Hall of Stats ratings for these four pitchers are wildly different: Morris is at 76, Mussina 164, Schilling 171, Tiant 129, Luque 85, Shocker 109, Trout 96. Win Shares and WAR measure different things and each system has its strengths and drawbacks (not all of which I understand, to say the least). There is not reason, logical or otherwise, that someone advocating for Mussina and Schilling must also advocate for Luque, whose HoS figure is half the magnitude, just because the CAWS figures puts Luque slightly higher. (And anyone who advocated for Morris should just admit he was a mistake, and not drag the Hall down as a consequence.) The same reasoning should work in reverse — CAWS and WS should put a brake on breezy answers based solely on WAR. I personally think WAR is a far better system than WS, despite WS having been devised by the best of baseball data analysts. But WS is doing something different from WAR and can show us things WAR does not. When disparities make that clear, we need to figure out what those things are.
Just noticed that:
– Lew Krausse Sr. is one of 5 pitchers (since 1908) to pitch a shutout in his final career game (in 1932)
– Lew Krausse Jr. is the youngest of 57 pitchers to pitch a shutout in his career debut (in 1961)
Shohei Ohtani’s cycle last week came in his 135th game, the 27th player to cycle that early in a career, but just the 2nd DH to do so (Travis Hafner is the other).
Ohtani’s 113 DH games are second only to Josh Phelps (121) in the first 135 games of a career (Hafner had 73 DH games). Phelps is one of 4 Blue Jays among the top 25 on that list, with the other three all notables (Fred McGriff, John Olerud, Cecil Fielder). Two HOFers also make the top 25 – Eddie Murray and Jim Rice.
Doug, you reminded me of Ron Bloomberg, who, to my surprise, had a career OPS+ of 140 in 461 games. I thought there would be more DH, but his DH/Position player split was 180/222. Of course, 154 of those position player games came before the dh> Bloomberg had 1BWAR per 159PA. Hafner 1/193, Fielder 1/345, Phelps 1/485, Rice 1/190, Olerud 1/156, McGriff 1/193
Can we get some consideration?
I hate to kvetch, but only an amoretz fertummelt would confuse a Blomberg for a Bloomberg.
Ouch, admittedly disgraceful. I still mourn for Mike, if that’s any excuse.
Terrance Gore is a pinch-runner.
Perhaps he will get a chance to play in every aspect of the game.
Thus far, however, he is a pinch runner.
Career, plate appearances less than 2x stolen bases:
195/103 . Matt Alexander
31/44 … Allan Lewis
68/37 … Terrance Gore
0/31 …. Herb Washington
8/21 …. Don Hopkins
15/9 …. Rodney McCray
16/9 …. Darren Ford
2/5 ….. Rico Noel
8/4 ….. Sandy Piez
3/4 ….. Mel Stocker
3/4 ….. Yefri Perez
you would think a guy who is exclusively a pinch runner to be a luxury nowadays with 13 man pitching staffs – particularly one who didn’t even hit in the minor leagues.
I’m not understanding the 13 man staffs.
Most teams are already clogging up a roster spot with a backup catcher who offers nothing on offense.
That leaves one backup outfielder and one infielder.
Keep enough pitchers with Options on your 40 and use the AAA shuttle. 12 pitchers is more than plenty.
Looking at the MLB splits for 2019 (through June 20th).
According to these numbers, right handed hitters are deriving a huge advantage from pulling the ball.
And for lefties there is an advantage, but not nearly as pronounced.
.405 / .403 / .773 / 1.176 … RH Pull .
.318 / .314 / .519 / .833 ….. RH Middle
.290 / .286 / .464 / .750 ….. RH Opposite
.326 / .324 / .642 / .967 ….. LH Pull
.346 / .341 / .565 / .906 ….. LH Middle
.335 / .329 / .504 / .833 ….. LH Opposite
We only have stats going back so many years for this sort of thing.
But looking at 10 years back, the splits were more similar. Defensive shifting must be working, sort of.
2009
.434 / .432 / .782 / 1.214
.286 / .283 / .425 / .708
.283 / .279 / .406 / .684
.401 / .399 / .738 / 1.137
.304 / .300 / .453 / .753
.332 / .328 / .476 / .804
Was watching the Mets/Cubs game on Friday. Yu Darvish was on the hill, allowing 4 runs over 6 innings for an ND. In the middle of the second season of his 6-year deal with the Cubs, Darvish has yet to win a game at Wrigley. Today’s ND was the tenth consecutive for Darvish which, excepting the Rays’ “openers” last year, ties the record for the longest streak by a starter, previously set by John D’Acquisto (1977), Randy Lerch (1977) and Dick Stigman (1965-66).
Mets’ first baseman Pete Alonso (no relation to Yonder) cranked his 25th homer on Thursday in the Mets’ 75th game (Alonso’s 74th). That breaks Wally Berger’s record for the fastest to 25 home runs from the start of a season in a player’s debut season. Jose Abreu (27) and Cody Bellinger (26) have more home runs in a player’s first 75 games in a debut season. 25 home runs in a player’s first 75 career games ties Alonso (he had on oh-fer today) with Matt Olson of the A’s, trailing only Rudy York (27), Abreu and Bellinger.
Voomo’s remarks aside, one thing that’s not happening much here lately is discussion of the current season. Why? I think it could be because the way the game has transformed so completely to Ks vs HRs—so much so that the mainstream media has caught on—it’s exceedingly boring to watch and difficult to get excited about.
Nevertheless here’s a report on some players and teams I find interesting for one reason or another.
The Dodgers. Running away with the NL West, they’re being led, it seems to me, not by Bellinger despite his remarkable season thus far, but by Hyun-Jin Ryu, previously a journeyman but now the staff ace, 9-1, 1.26 ERA, 339 ERA+. The rest of the rotation is darned good, too, with a team ERA+ of 132.
Next: Best record in the AL after 75+ games? How about those Twins! A no-name team, at least to me, Nelson Cruz, DH-ing at age 38, the only one with much All-Star cred in his past. The Twins’ answer to Ryu is Jake Odorizzi, another journeyman blooming late, 10-3, 2.58, 175, but averaging only 5 and a third innings per start.
Houston comes next for comment, and they deserve credit for having so good a team that while Springer, Altuve, and Correa have been on the DL, they’ve maintained the pace, thanks to often overlooked Alex Bregman (21 HRs, 51 RBIs, 57 BBs, etc) and Michael Brantly having another fine season. Justin Verlander has, to me, one of the most remarkable stats of the year so far—not the 9-3, 2.59, 170 line but the fact that, at age 36, he’s averaging 7 and a third IPs per outing. In 2019?
On to Atlanta, the hottest team in baseball recently. Freddie Freeman leads the team in runs, hits, 2B, BA, HR, RBI, BB, OPS+, WAR, but the real clue to the Braves’ offense is the fact that every starter has an OPS+ of 100 or better. including both catchers. Mike Soroko, 21-year-old rookie pitcher, is currently 8-1. 2.12, 215, despite having just 62 Ks in 76.1 innings, a pedestrian total for our times. Must not have gotten the memo.
The Cubs. No one making big waves, but they’re holding out against Milwaukee despite Yellich (plus Moustakas and Grandal, actually), with a balanced lineup and good pitching. Five Cubs are on track to pass the 30 HR mark.
The Yankees, lastly. Smoke and mirrors? Or is the incredible depth of the roster that puts them 4.5 games up on Tampa Bay despite half the team’s starters spending the majority of the first half on the DL. Stanton’s back. Judge is due back tonight. It will be interesting to see if their presence does much to improve the team’s record.
It has been abut three days since we’ve had a comment on Mike’s CAWS system. I’m not sure whether there are ore installments to come in this series, but in case this is the end of our conversation about CAWS I’d like to add a few comments about how I think it could be made a little more useful. Using my own psychology as a measure, I don’t suppose these suggestions will be very appealing to Mike — he’s invested a lot of time in his book and article, and I can’t imagine ideas for “improvements” to be very welcome. But I hope these will at least be seen as a way of engaging positively with the system.
1. One of the confusing things about the system is that the CAWS score means different things for different players because of the positional threshold. If Mike’s going to publish further on the system (which seems well justified by its success so far), my thought is that it might be good to alter the numeric system by having the Caws score be represented by a figure that is: (CAWS/threshold)*100. Using this formula, the borderline score for all positions becomes 100, and the scores will both be more intuitive (distance above/below 100 uniformly representing quality across positions) and correlatable with Hall of Stats figures, since HoS also uses 100 as the Hall threshold.
2. Having suggested a way to make CAWS easier to compare with HoS, I’m going to do the opposite here. In the CAWS system, the size of the pool of players who have “Hall of Fame numbers” is variable, and represents Mike’s view of how large the Hall should be: using the notion above, everyone with 100 or over is Hallworthy. But because the benchmarks are intuitive for Mike rather than based on a theoretical model, the CAWS Hall size is neither related to the size of the actual Hall (the HoS base), the size of the BBWAA Hall (the CoG base), or the Hall size preference of anyone else. This isn’t a problem, but it would allow Mike room to use either or both of those alternative size models to show CAWS cutoffs. For example, if the CAWS cutoff for Mike’s hall is 100, his same system could show who would be in or out — according to WS-based calculations — based on CoG or HoS Hall sizes. (This would be harder to do without reducing the various thresholds through a common denominator, as suggested in #1.) The result would be to show that “100” means different things in the HoS and CAWS, in that sense what seemed to be a way to put the two on common ground would prove to be otherwise, but it would also allow a simple comparison: e.g., if the Hall cutoff for CAWS might be 100, the CoG might be 120 and the HoS might be 110, and that would be a conceptually easy relationship to deal with.
3. The alternative pathways to the Hall (CWS>300; CV>200; reduced G/IP combinations) need, in my view (and perhaps only in my view), some less arbitrary form of justification. The first of these is now simply a vehicle to provide Dennis Eckersley with a path to the Hall, since the other two it was invented for (Nolan Ryan and Don Sutton) now qualify under Mike’s reduced pitcher threshold of 220 CAWS. CV>200 is there to provide pathways for Whitey Ford and Pedro, but it sweeps up Urban Shocker as well, although Shocker is not only a less persuasive Hall choice, he has a less persuasive CAWS number too (although his HoS rating is a little higher than Ford’s). That Pedro’s career fails to meet the CAWS benchmark seems to me problematic (his HoS rating is 187, #36 on the Hall list), but it could be finessed by simply allowing round numbers — his rating of 219 CAWS would score 99.55, or 100, on a revised scale. Ford would be at a 99. Perhaps one good way to handle this would be to select a “threshold range” (e.g., 98-102), whose players would be the pool of those whose cases required adjudication outside CAWS.
The 1800G/250CAWS path is needed for only five players: Greenberg, Terry, Doby, Robinson, and Puckett. If this qualifying path is represented by a bonus of +20 CAWS points or more, it will align with the current outcome. (Obviously, a similar approach would work for Eck, Ford, and Pedro too.) Similar calculations can be made for the low-IP/good-CAWS categories, working backwards from what’s necessary. While this may seem to be fudging the numbers — well, it is fudging the numbers — it is simply representing a different kind of fudge in an equivalent form that can produce a unified list. Obviously, I’d prefer that the entire list built in a component that reflected WS-rate per PA or IP — I think that would probably take care of the issue of short-career outstanding players (and differentiate among them: Greenberg and Robinson’s short-career rates are a lot more impressive than Terry and Puckett’s), but I’m confining myself to suggestions that I think are closely in tune with Mike’s approach.
4. One other suggestion that is different in kind and could be applied to varying degrees. It’s brought to mind by the case of Ernie Banks. We all think of Banks as a SS, but he played over 50% of his games at First. Mike points this out and proceeds to apply the SS threshold to Banks — his CAWS of 268 wouldn’t qualify him as a First Baseman, where the threshold is 280, but the SS standard of 250 makes him a shoo-in. I think the system would have more integrity if it allowed a mixed threshold in cases where a player had a clearly split career in the field, as Banks did. If he were viewed as 50% 1B and 50% SS, with a threshold of (280+250)/2 =265, he’d still be in without the greater part of his career being misrepresented. Under the numerical system I suggested above, Banks’s CAWS rating would fall from 107 to 101, and perhaps this represents a fairer assessment of his career value.
While I’m sure it’s been clear that a WS-based system is not my preferred basis for career value assessments or Hall rankings, I think the CAWS system is extremely valuable. It provides not just an alternative calculation to WAR-based figures, it’s an alternative perspective, because WS measures something different from what WAR measures, and both measures have validity. I hope I haven’t let my critical remarks obscure my basic appreciation of the value of what Mike has done. My suggestions here are meant to point towards ways the system as it stands could be represented in a manner that makes it easier to set beside WAR-based systems, so that we can try to find the best way to interpret both.
Bob,
You wrote: “I don’t suppose these suggestions will be very appealing to Mike — he’s invested a lot of time in his book and article, and I can’t imagine ideas for “improvements” to be very welcome. But I hope these will at least be seen as a way of engaging positively with the system.”
Actually, I am very pleased with these suggestions (and others that have been made) – and I would love to see someone take the CAWS concept and improve it (as I have mentioned to Bob in a private email). I have always considered CAWS to be a work in progress. My 2012 book, DEFINING GREATNESS, was actually the third book about the system (which I first started to develop in 2004 with encouragement from Bill James). BASEBALL’S BEST: The TRUE Hall of Famers (2007) and A GOOD CAWS (2011) were earlier efforts.
Unfortunately (perhaps), I have over the past few years been involved in a few projects closer to my educational background and have not invested much time recently in baseball research. And (since I am 83) I am not sure how much more I am going to attempt to tweak the system.
So, by all means, bring on the suggestions for improvement if there is any feeling that the CAWS system has a role in judging who really belongs in the Hall of Fame.
This is such a great response from Mike — I’m a former academic, like Mike, and my experience is that it’s rare for anyone (including me) to be so open to suggestions for change (although people like me pretend).
At the moment, I’m without power because of another storm, and I’m the wrong generation to type on this phone, so I’ll wait till I have my regular online access back to add some further thoughts about CAWS and Hall metrics in general.
If I could upvote this 100 times, I would. As to being 83, I suggest you bring out new tweaks in a circadian rhythm. It would be a refreshing take on the phrase “Centennial Edition.”
Michael Hoban,
I see that the CAWS book is currently unavailable on amazon.
Why is that?
Voomo, you got Mike L, not Michael Hoban
Voomo: check https://www.amazon.com/DEFINING-GREATNESS-Hall-Fame-Handbook/dp/1621412369.
Pingback: CAWS Career Gauge – Part 3 |