
Greetings, HHS folks! Dr. Doom here again with another awards voting post. I’ve done these for the last two seasons, so I’m continuing the tradition in 2019. For the next award, we switch leagues and awards as we vote on the AL Cy Young. As it turns out, everything’s coming up Astros! More after the jump.
Our first contender is perpetual Cy Young candidate Justin Verlander. With one CYA already and three second-place finishes, Verlander attempts to avoid “bridesmaid” status again, but the competition is thick. A good way to get traction is to be durable – and Verlander led the league by any count in durability, starting the most games, pitching the most innings, and winning the most games. But none of that matters if you’re not effective. Verlander was second in the league with a 179 ERA+, and led the league with 7.8 WAR, a 7.14 SO:BB ratio, and a miniscule 0.803 WHIP. Oh – and for good measure, Verlander struck out 300 opposing batters, and logged a third career no-hit game! Only a susceptibility to homers (a career-high 1.5 per nine and worst among serious award contenders) damages Verlander’s credentials.
If there’s a competitor to Verlander, it’s his teammate, Gerrit Cole. Cole is a former #1 overall draft pick who never seemed to live up to that billing… until he came to Houston. He posted a blistering 13.8 SO per nine this year – a new MLB record, topping Randy Johnson‘s 13.4 in 2001! Cole’s 326 K’s led the majors, making he and Verlander the second-ever teammates to whiff 300 (the first, naturally, were Johnson and Curt Schilling, in 2002). Cole had the best FIP (2.64) and ERA (2.50) in the AL, and the best ERA+ (185) in all of baseball. Had Cole won one more game, he would’ve tied his teammate and recorded the very rare “pitching Triple Crown”; as it was, he and Verlander became the first teammates to win 20 games since Johnson and Schilling, and Derek Lowe and Pedro Martinez, both in the 2002 season. Finally, Cole notably became the first searchable pitcher to finish a season with 16 straight winning decisions as a starter, a streak he continued for three more games in the post-season.
While sorting out those two might be tough, you do have three more spots to fill, so let’s look at some other contenders. Lance Lynn of the Rangers managed to avoid homers in a notoriously homer-prone home park, to the tune of less than one per nine innings, helping him to a career best 141 ERA+ and 3rd ranked 7.6 WAR. Lynn’s FIP (3.13) was even better than his ERA (3.67), as he posted a creditable 16-11 record for a sub-.500 Rangers team. Leading the league in WAR (tied with Verlander) was Lynn’s teammate Mike Minor who, oddly enough, pitched the EXACT same number of innings as Lynn, and posted a similar 14-10 record to go with a 144 ERA+ that tied for 4th in the AL with the Indians’ Shane Bieber. Bieber ably filled the void in Cleveland created by Trevor Bauer‘s departure and Corey Kluber‘s lengthy injury layoff, leading the majors in CG (3) and shutouts (2), while placing 2nd in IP (214⅓) and 3rd in strikeouts (259). In Tampa, new hire Charlie Morton became this season’s Blake Snell, taking the role of staff ace in place of the defending CYA champ who lost time to injury and struggled to find his form of a year ago. Morton allowed homers at the lowest rate of any pitcher – less than 0.7 per nine, leading to a 2nd ranked FIP (2.81) and third best ERA (3.05).
There are some other interesting pitchers to look at: Lucas Giolito (1st in shutouts, 5th in ERA, 6th in WAR) of the ChiSox; and Eduardo Rodriguez (1st in starts, 3rd in wins, 5th in WAR) of the BoSox, to name two. In Minnesota, Jose Berrios was so hot at the beginning of the season (8-2, 3.01 over his first 14 starts) that it seemed he might make it into the conversation, but a rougher second half doomed him to down-ballot consideration.
So who’s it going to be? Which stud from the AL champion Astros will you take? Or, were one of the Rangers’ top two more valuable to a struggling team, and deserving of CYA recognition? Who’s going to slide in at the bottom of your ballot? Let us know by voting in the comments section below!
Also, apropos of nothing, here’s a fun fact: 19 different pitchers in the overhand pitching era have had a season of 300+ strikeouts. FIVE of them (J.R. Richard, Mike Scott, Nolan Ryan, Cole, and Verlander) did so as Astros. No other franchise has had more than two such pitchers. Must be something in the air.
Rules: Vote by making a comment below and numbering your choices with 1 being the MOST preferred candidate, and 5 being your LEAST preferred candidate of your five choices. Your ballots will be EXACTLY five places, just as the BBWAA does. You must vote for 5 players. Scoring will be 7-4-3-2-1, just as the BBWAA does. You are not required to vote in all elections; only vote in the ones you would like to vote in. You may make vote changes, if the discussion so moves you. If you change your vote, please do so in a new comment, not as a reply to your original comment (it’s a lot easier to find new comments than replies to old ones). Please don’t vote strategically; we’re trying to get the best result, not to manipulate the vote totals based on what others have done. Voting will remain open about one week. When players are tied, tiebreakers go as follows: first tiebreaker is number of ballots on which players were named; second tiebreaker is highest placement on a ballot; third tiebreaker is the first player to be named (as this usually only happens when a bunch of players are tied for last). Results will be posted when balloting closes.
1. Cole
2. Verlander
3. Morton
4. Giolito
5. Bieber
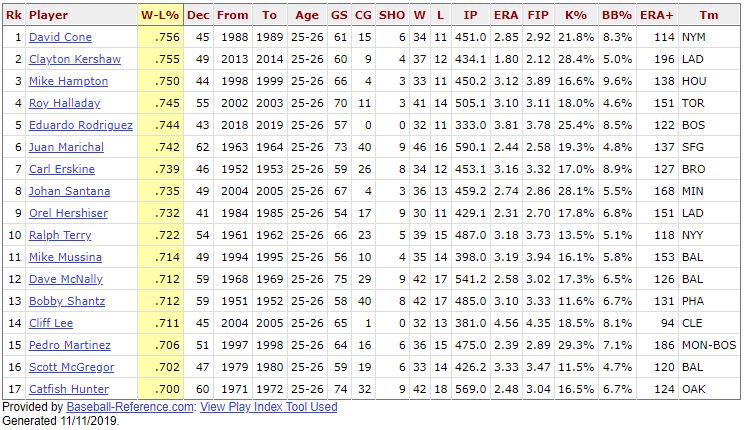
Eduardo Rodriguez’s .744 W-L% over his past two seasons is 5th best in the live ball era in 40+ decisions aged 25-26. These are the 17 pitchers with a .700 record at that age.
For exactly 20 regular season IP of Andrew Miller, and 7.1 playoff IP, the Orioles gave up Eduardo Rodriquez. He did manage 1 WAR in those 20 IP and gave up just one hit and one walk in the playoffs, but you’d have to think the Orioles would like that one back.
It’s actually quite a list. Not a dud in sight. The median career WAR of the group is Cliff Lee at 42.8. Rodriguez has already passed Terry in career WAR and, with a similar season next year, will pass Erskine and possibly McGregor and Hampton.
Well, it is a list of good pitchers (not sure McGregor, at career 98 OPS+ really qualifies there, Shantz’s story is complicated), and in that sense it may prove its own worth as diagnostic of future success, but I’m not sure whether W-L is a particularly useful tool here if our interest is the quality of age 25-26 seasons. Cliff Lee had a fine career, but these two .711 W-L seasons were mediocre, judging by ERA, ERA+, FIP, and IP (his age 25 season included a 5.43 ERA, 80 OPS+, but a 14-8 record).
Rodriguez ranks as a good-not-yet-great young pitcher if you look at ERA and ERA+, but as one who really doesn’t belong on this list according to IP, though he’s just over two times the qualifying minimum–he’s about 15% behind the next trailing pitcher on this list (Lee) in terms of IP.
Agreed it’s more of a mixed bag at the bottom of the list. But, all of the pitchers have name recognition for pitching well for a good chunk of their careers.
I was kind of expecting to see a pitcher or two who is long forgotten and who happened to luck out with a couple of high W-L% seasons. But, on reflection, while lightning may strike twice, it’s pretty unlikely to happen in consecutive seasons.
Doug,
Eduardo must be pitching to the score 🙁
I believe I may have already copied and pasted it, but Charlie Morton is actually 2nd in W-L% from age 33-35 among those with 60 + decisions in the live ball era. Sal Maglie is first
Here’s the age 33-35 list, min. 60 decisions.
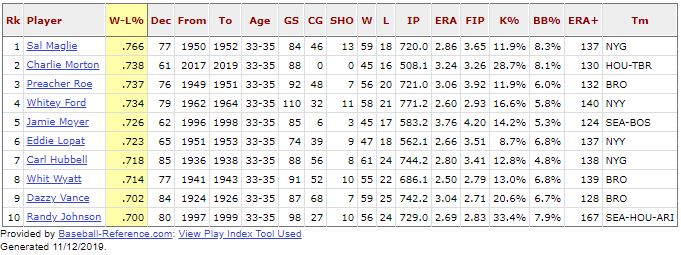
Unlike the age 25-26 list which featured mostly recent players, this list is dominated by pre-expansion pitchers.
1. Verlander
2. Cole
3. Lynn
4. Morton
5. Bieber
Let’s close the polls at 11:59:59 PM on Monday the 18th. Thanks, and happy voting!
1) Cole
2) Verlander
3) Morton
4) Bieber
5) Rodriguez
Some more stats to ponder in your deliberations. Top-ranked AL pitchers (min. 150 P).
http://www.highheatstats.com/wp-content/uploads/2019/11/2019-AL-Pitching-Splits.jpg
Cole and Verlander both appear in 15 of the 18 top 5’s. Next is Morton with 12 placements (or 13 if you give him credit for a T-5th with his .201 BA with 2 Outs).
Doug,
Re “Cole and Verlander both appear in 15 of the 18 top 5’s”, the sum total of the 15 “Top 5” appearances for Cole would be 34 and 35 for Verlander. It’s that close
Here are main stats I used to think about this vote:
……………………WAR……….IP………….WAR/162…………ERA+
Bieber………….5.0………214…………….3.8………………..144
Cole……………..6.9………212…………….6.9………………..185
Giolito………….5.6………177…………….5.1………………..134
Lynn…………….7.6………208…………….5.9………………..141
Minor…………..7.8………208…………….6.1………………..144
Morton………..5.1………195…………….4.2………………..146
Rodriguez……6.0……….203……………4.8…………………126
Verlander……7.8……….223……………5.7…………………179
On Verlander vs. Cole, I began with a predisposition towards Cole because of his tremendous second half, and because there’s something nice about a break-out pitcher. The two are, as others have noted, amazingly close on many calculations, and where they’re not, there are trade-offs: e.g., Verlander’s significantly better in H/9 and Cole is significantly better in HR/9 (and, of course, in the figures above the trade is over WAR and WAR/162).
I wound up tipped towards Verlander for an unexpected reason. I noted his outstanding net WPA mark (5.6; Cole is next at 4.7, and no one else breaks 4.0), and it led me to notice that Houston supported Verlander with “only” 4.98 R/G (AL ave. was 4.88, but Houston’s was 5.68), while Cole received 6.67 R/G in support. So I looked to see how many pitching wins each player had with a margin of >5 (six runs or more), and there was a significant gap: Houston won 9 of Cole’s 20 wins by >5 vs. 5 of 21 for Verlander. Moreover, of Verlander’s six losses, five were by one run (scores: 0-1, 1-2, 2-3, 3-4, 4-5), while only one of Cole’s five losses was by one run (1-2). Cole’s terrific win streak included games of 15-2, 11-2, 11-1, 14-3, and 21-1. He also had wins of 11-0 and 11-4. Verlander had only three such games (12-4, 15-1, 13-5). I was looking for something to tip the scales and that was it: I think it’s simply a little easier to succeed when your team provides runs on the scale that Houston did Cole.
Minor seems solid for a third-place vote and Lynn for fourth, but fifth seems hard. I ruled out Rodriguez because his ERA+ was not CYA quality and Giolito because his IP were significantly lower than the rest of the field, and with MVP, quantity matters (Giolito’s ERA+ fell short too). That left Morton and Bieber, and I’m going with Morton, despite a gap in IP. Don’t like Bieber’s music.
Verlander
Cole
Minor
Lynn
Morton
I was also looking for something to tip the decision one way or the other. One of these is high quality starts (6 IP, 2 ER or less).
24 – Cole
20 – Verlander, Bieber
17 – Lynn
16 – Morton, Gonzales, Berrios
15 – Tanaka, Rodriguez, Fiers
14 – Minor, Giolito
To your point, it’s easier to mow down a dispirited opponent, which could account for a good chunk of Cole’s lead over Verlander.
Surprising to see the WAR leader Minor so far down the list.
Doug, I had Minor in third, after Verlander and Cole. I think Verlander is the fractional WAR leader, no? He’s listed first on the leaderboard. but neither one seems to have the black ink. The reason I put Cole over Minor is that Cole pummels Minor on ERA+, and I balance those two types of stats when I’m doing shortcut calculations like this. I’m sure Minor’s bWAR stat works out, but it is super-reliant on strength-of-schedule calculations, and eyeballing his game log I just don’t see it, so I’m a little uncomfortable with pairing a 7.8 WAR and a 144 ERA+.
By the way, my WAR/162IP figure for Cole was a typo: it should be 5.3, but I did an eye-skip and repeated his straight WAR.
Perhaps you were looking at the stats list. The stats list is organized alphabetically. I hope you weren’t questioning that: I’m an excellent alphabetizer!
Not questioning your numbers. Just remarking that I too was looking for something to tip the Cole/Verlander decision. You decided on run support, accurately reasoning that Verlander had to work harder in his starts. I was leaning towards “how reliable is the starter in giving his team an excellent chance to win?” to which purpose I went with the “6 IP, 2 ER or less” test in which Cole shines and he, Verlander and Bieber seem to have a leg up on the rest of the field. Not saying one way is better than another, just that we both found that we were searching for something to tip the Cole/Verlander balance one way or the other.
Yeah. I saw your major argument and agree it could cut either way. It was the Minor point I was quibbling with.
I took it that Doug was referring to the list in his own post of leaders in high quality starts (6 IP, 2 ER or less) and that he found it surprising to see Minor tied for 11th place with just 14 such starts, yet the AL co-leader in pitching WAR.
If that was a correct understanding, then I agree: it is surprising to see a WAR leader trailing so many others in high quality starts.
…and I totally missed your play on words, Bob, until after I posted my reply. Nice.
You clearly read Doug better than I, Scary. We were writing to cross purposes and you’ve untangled us.
But the solution to the quandary of how low key Minor’s starts were lies in the WAR factor that boosted him: strong opponents. Assuming B-R is right about that, he racked up value in starts where >2 earned runs still counted for “high quality.”
I have a few things to say:
First of all, the actual results of voting are in. Personally, I believe our electorate to be better than the BBWAA’s, so I’m still excited to see how ours comes out.
Second of all, I’m sorry I’ve been absent for a couple of days. I was at a conference in the woods with no internet, so I’m back for the discussion now.
Third and finally, I’ve seen some discussion here about pitching WAR, particularly baseball-reference flavor. There is a FABULOUS twelve-part series that Bill James wrote last year in February and March on his website. It’s all available for free. All the articles happen to be on this page (start from the bottom with the article from 2/14). The gist of it is, baseball-reference is probably double-counting something – most likely, it’s double-rewarding pitchers for pitching in front of good defenses. It’s why you’ll get really divergent answers where my home-brewed, ERA+ based-WAR (Minor was 6th), Fangraphs (8th), and Win Shares (4th) will all agree that Mike Minor was pretty good… but Baseball-Reference will tell you he was the BEST pitcher in the AL (last year, Aaron Nola was the pitcher to get this treatment). It’s made me significantly more skeptical of baseball-reference’s WAR system, and that makes me a little less likely to lean on it.
Doom,
Funny that you mention “double-counting”. Somehow I suspect b-r double counts fielder’s position at the plate and the field. If you’re a SS fielding really well and batting 8th with a 95 OPS+, are you contributing more than an iron-gloved 1B who bats third with a 160 OPS+?
Athletes “play” positions in the field on defense – all of which are of varying relative importance. Are not the batting order positions what differentiates “hitters” and their relative importance? You know, Pete Alonso, when he bats fourth, is a clean-up hitter – not a first baseman. And Ahmed Rosario, when he bats 7th or 8th isn’t a SS, he’s a batter at the bottom of the lineup.
I dunno 🙁
B-ref specifically does NOT double-count fielding position on their WAR. oWAR counts position + offense; dWAR counts position + defense. WAR is NOT equal to oWAR+dWAR; in fact, WAR=oWAR+dWAR-position. If you really wanted a “pure” oWAR, you can find it by just looking at Rbat and dividing by the Runs:Wins ratio. For Pete Alonso, for example, his Runs:Wins ratio this year was 10.8:1. He had a 47 Rbat. You have to add that to Rrep, which is the difference between AVERAGE and REPLACEMENT. So that means his offensive WAR would be (47+22)/10.8, or 6.4 (4.3888, really). That’s his oWAR, if you’re not counting position.
If you want to read a nearly-a-decade-old fight about whether position should be included in oWAR or dWAR, go ahead and read this old post from the baseball-reference blog. This was a LONG time ago, but I remember the discussion well. Plus, for those who’ve been with us a long time, you get to see some old names (Johnny Twisto, DavidRF, Kds). Anyway, this was a discussion for a while, but I think the ship has really sailed at this point in regard to baseball-reference reopening that can of worms. So now you have to do it manually, I’m sorry to say. Anyway, that’s the best I’ve got for you!
PS, apparently, I’m in a really link-y mood. I’ve had hyperlinks in all three of my posts today. I guess there’s just been a lot of stuff on my mind. But I have to say, the one in THIS post is from a particularly long time ago. I wasn’t even posting under a screen name at that point; the “David” posting a few times there is me. I’m sure no one else cares about that, but I thought it was funny to look back and see. I guess I went with Dr. Doom once we migrated over to the old HHS blog (the blogspot one). How things change!
Doom, I’m not picking up the specifics of the argument on pitching bWAR, but it seems to me I recall that the speculation was that the double counting occurred when park effects and defense were combined: that park effects impacted defense, but was also being counted separately. I was anxious for this to be the case because of a debate you and I had once had about Mordecai Brown and the CoG. Although my argument may have prevailed, I felt I’d lost the debate, and the double-effect effect promised to make me a winner in retrospect (I guess I’d be raising the trophy behind my back).
However, Sean Smith, who was primarily responsible for developing “pWAR” (to use the lamented but not late nsb’s term), responded to the debate on Fangraphs and said, in essence, What do you think I am, an idiot? Of course I accounted for park effects on fielding and deducted them to avoid double counting. So you still have the trophy and I still grind my teeth at night.
In the Minor case, the reason for the weird bWAR total seems so obviously to be strength of schedule that I don’t think you need to look for a more systematic distortion. Minor’s R/9 is 3.72, and the RA9avg figure is 6.18. Part of that is, of course, park effects, and it’s a striking thing that Minor’s R/9 vs. RA9avg rates show nothing of interest until he moves to Texas, with a PF over 110, at which point he immediately becomes masterful on the RA9avg measure (though not in ERA+, which I would think ought to move up in rough proportion as the RA9avg – R/9 score increases. So I agree that Minor’s pWAR is problematic, but I suspect it may be the specific RA9avg figure that is the source of the problem, rather than a double-counting error that applies to all pitchers (of course, RA9avg does incorporate both the defense and the park, so the error Sean Smith avoided in RA9def per se might, perhaps, have been left uncorrected in RA9avg).
Well, honestly, I think the biggest thing about Mordecai Brown for me is that I see him as a pretty clear HOF pitcher, but not necessarily COG, particularly given the MANY pitchers already enshrined from that period, and my preference for people to be elected from more modern-day periods, particularly when compared to players from the segregated era. But that’s neither here nor there.
The bigger thing is that Baseball-Reference has anomalies in who it considers the best pitcher of certain years. For instance, take this season, and Mike Minor, as I stated above. In <a href="https://www.billjamesonline.com/the_early_cy_young_seasons/?AuthorId=3&pg=8"this article from the Bill James series (scroll down to the 1961 stuff – it starts with the header “On Un-Earned Runs”). As with most of the stuff James writes today, it’s irascible and grumpy. But it’s still pretty good stuff.
Anyway, if you look at Baseball-Reference’s conclusion from that year, Jack Kralick was the American League’s best pitcher and the second-best in baseball (25th in MLB in ERA+). Baseball’s best pitcher was Don Cardwell – 33rd in MLB in ERA+. Now, does that seem a reasonable conclusion on its face? These guys didn’t pitch outstanding numbers of innings that year, so it’s not that. It’s purely that there’s something fishy going on with how baseball-reference is adjusting for defense. Purely by an ERA+-based approach, Don Mossi ranks as the best pitcher in baseball (3rd in ERA+). Kralick rates 17th, and Cardwell 24th. Fangraphs has Kralick 7th and Cardwell 12th. (My personal WAR rankings, which incorporate FIP and ERA, have Kralick 9th and Cardwell 14th.) Fangraphs and I both see Jim Bunning as the best pitcher in baseball that year. Baseball-Reference has him outside the top-10. I just don’t see how, if you examine the record, a reasonable person could come to the conclusion that Cardwell and Kralick were the best baseball had to offer in 1961.
If that were the ONLY anomalous result, honestly, I’d not only accept it, I’d champion it. I’d be glad to see that baseball-reference was capturing something I missed. But when I look at John Montefusco in 1976, or Jim Merritt in 1967, or Britt Burns in 1980, I see seasons that, while very good, simply don’t pass a simply sniff test. Reading the James series, there are years I agreed with his conclusions and years I disagreed. Too often, I think, he was willing to rely on a pitcher’s reputation, rather than their body of work in a single year. But overall, I think his point was right: baseball-reference pitching WAR has something funny going on with it, somewhere in the adjustments (whether park, defense, or opponent, I’m not sure) that seems to skew things just a little further than I’m comfortable with. The main thing is this: if the “traditional” stats are telling you one thing, and FIP agrees… WHY would we take Baseball-Reference’s conclusion that disagrees with those two answers? I’m not really willing to do that, particularly when I can calculate things on my own that look a lot more reasonable to me.
Again, you want to say Mike Minor was the best pitcher in MLB, fine with me. I just don’t see any way that’s true. His BABIP was .288 in a league with a .299 BABIP. I don’t see that as a sign of wretched defense being played behind him. He may have faced the toughest opponents. And he may have pitched in the most difficult parks (he almost certainly did, being a Rangers starter). But I don’t think those things are extreme enough to rise to the level of making him the best pitcher in baseball.
Doom, On this one, I’m not going to have the chance to pursue the James series and your detailed points about B-R now, but I’d like to respond to your final paragraph.
One of the things I find dispiriting is to have an argument refuted by misreading. You write: “Again, you want to say Mike Minor was the best pitcher in MLB, fine with me. I just don’t see any way that’s true.” Having taken some time to explain why I did not want to say what you say I said, I can’t understand why you’d make me a straw man for that position. Not only did I say that I thought Mike Minor was the third-best pitcher, but I explained why, and the explanation rested on skepticism about B-R’s calculation of WAR. Adding to that explanation in my initial response to you, I speculated at the close that B-R’s RA9avg stat, which is what generated Minor’s high WAR, might in fact incorporate the type of systematic flaw you (and James) were looking for. I appreciate all your careful identifications of the problems you see with B-R, but why you seem to present them as if I had been celebrating B-R’s perfection, rather than pointing towards its flaws and their possible sources I do not understand.
My own vote:
1. Gerrit Cole – Incredible finish. FIP loves him, ERA loves him, Strikeouts love him. He was great, and he’s gonna get PAID. On a win-loss scale, I have Cole’s performance as representative of an 18.0-5.6 record; Verlander at 17.7-7.1. With more decisions but fewer wins for Verlander, that makes Cole an easy choice at #1.
2. Justin Verlander – FIP absolutely hates Verlander, simply because of the homers. If you think the homers were a weird fluke – it wasn’t his pitching, but rather just bad luck – then he tops Cole. (There’s evidence to support that theory, btw; see ,a href=”https://blogs.fangraphs.com/the-mystery-of-justin-verlanders-home-runs/”>this article, if you’d like to see the case.) If you think he’s entirely responsible for it, then you simply can’t, I think, consider his season better than Cole’s. I’m pretty agnostic on it. I’d put him here. Without Cole around, I’d have him #1 by a country mile. As things stand, he’s my #2.
3. Lance Lynn – Lance Lynn and Mike Minor get grouped together a lot. Their seasons were NOT the same. In an identical 208.1 innings pitched, Lynn struck out 46 more, walked 9 fewer, and gave up 9 fewer dingers. He had a better WHIP. His FIP is more than one run better. Lynn acquitted himself immensely well. Minor had a fabulous season… but not a top-5 season.
4. Shane Bieber – Do the Indians have a top-5 pitcher every year? It was Kluber for so long; last year, I had Bauer at #1 in the AL. This year, it’s Bieber. You know, if they could’ve mushed all those seasons into the same year, they’d’ve won 110 games one year. Alas, that’s not how things ever go for the Indians, is it?
5. Charlie Morton – Again, just as Bieber took Bauer’s place as an Indian from last year, so Morton takes Snell’s place as a Ray. Not as good of a season, of course, but Morton was good. Morton was the 2nd-most effective pitcher in the AL, per my reckoning, but his dearth of innings really held him back. Of course, more innings may have made him less effective. But as it was, his performance was good enough to rank him 5th on my ballot.
No matter how you slice it, it’s a tossup between Cole and Verlander, so I don’t want to argue that point. But I do want to point out what I see as a weakness in FIP. You accurately point out that FIP sees a vast difference between Cole and Verlander because of HR/9 — obviously key for a TTO-based metric. (Cole’s K-rate was ~15% better, Verlander’s BB-rate was ~15% better; on ERA they are nearly identical, Cole with a ~3% edge.)
But what FIP ignores, because it involves BIP, is that Verlander had the fifth best H/9 record among qualifiers in the past century (the misnamed era of the lively ball), and he’s second in WHIP. To my mind, assessing Cole vs. Verlander involves balancing the two dimensions (HR/9 on one hand, H/9 and WHIP on the other), but FIP simply throws out the H/9 and WHIP elements. Naturally Cole will be loved and Verlander hated if you do that. Moreover, the rationale for tossing H/9 is non-existent in this case, because the defense was constant for Cole and Verlander: you can’t speculate that the difference in BIP results was due to different defenses. When you see that BABIP is .276 for batters against Cole and .219 against Verlander in front of identical defenses (Cole being about ~25% worse, skipping the usual questions about applying team defense metrics, which could cut either way), I think it’s hard to argue that Verlander’s surplus of seven HR should be determinative of anything.
One point: “the defense was constant for Cole and Verlander.”
Well, the OFFENSE was constant for Cole and Verlander. I mean, if the defense was, so was the offense, right? Yet, there’s nearly a two-run difference in support. Thank goodness that’s fiction, since they pitched in front offense.
Thing is, we can’t assume that the defenses played the same, even if the same players were there. Yes, defense is more consistent than offense… but to assume that they were identical, or that any differences MUST’VE resulted from something the pitcher was doing, strikes me as an extremely similar argument to the one people made 40 and 50 years ago about run support: the differences must’ve been down to pitcher hitting, or to how much the offensive players loved their pitcher or something. It strikes me you’re assuming a variation of the same argument. I mean, how do you account for the fact that Verlander allowed only 2 unearned runs, while Cole allowed 7? That doesn’t sound “identical” to me.
The advantage FIP gives you is that it TRULY removes the performance of the fielders by literally removing the performance of the fielders. I mean, you’ve stated it that “BABIP is .276 for batters against Cole and .219 against Verlander.” True, but you could just as easily say, “The defense behind Verlander turned 78.1% of balls in play into outs, while the defense behind Cole turned only 73.4% of balls into outs.” Phrased your way, you’ve taken a conclusion – “the pitcher should be somewhat responsible for BABIP” – in how you phrased your argument. Personally, I’d rather look at both dimensions or ERA and FIP.
To me, there’s not necessarily a reason to rely on FIP information over and against batted-ball information, nor vice versa. If you look both at ERA and at FIP and balance the two, which is my own personal method, you arrive at the conclusion that Cole was the AL’s best pitcher. It’s not by a wide margin, mind you, but over half a win. That’s solid enough to make Cole a clear-cut favorite, by my reckoning. That said, it’s not a travesty for Verlander to have won. Actually there’s no way that ANY of this year’s awards is going to be considered historically abnormal by anyone’s reckoning. Solid choices all around. This just makes up for the 2012 award Verlander should’ve won over David Price… or maybe 2016 over Porcello. I see no cosmic injustice here; just an award I saw differently than the voters.
Doom, We’re on the same page as to the outcome: I think there’s plenty of reason to vote for Cole over Verlander and no injustice would be involved; I just came out tipped the other way.
To respond to your specific points: It seems to me that the offense of teams is not constant largely because it faces different pitchers every day. This doesn’t apply to defense. The difference in defensive performance behind Verlander and Cole may be because the fielders simply played their best behind Verlander and not Cole. But rather than attribute the outcome to eight identical players altering their performance, it is a far more straightforward hypothesis to attribute the difference to two non-identical players: the pitchers. And, yes, I think it should be self-evident that the pitcher is somewhat responsible for BIP.
Cole had a spectacular year, but I’ve heard no one speak about the fact that apart from Pedro-2000, no one has ever had a lower WHIP rate than Verlander-2019, and his fifth-best ever (post-1919; I didn’t run a search with earlier years) H/9, which includes those 36 HR, is terrific as well. In terms of keeping the batters off of the bases, Verlander’s year was historic. Cole has a edge (not large) on K/9, and, very marginally, on ERA (2.50 to 2.58, though not on R/A, where Verlander’s lead, 2.66 to 2.80, is bigger than Cole’s in ERA). And, of course, Verlander gave up 7 more HR than Cole in only slightly more IP. The way I see it, while balancing FIP and ERA helps make up for the artificial (in my view) nature of FIP, it still fails to give adequate credit for Verlander’s historic record keeping batters off the bases and some share of responsibility (substantial, in my view) for their failure to hit unfieldable balls. Given the scale of his success in those areas this season, I prefer to make them part of the equation.
As for offensive variation, a 1.66 run differential means that Houston was facing not just BETTER pitchers every day Cole pitched, but that the difference in pitchers was basically that Cole was facing All-Stars and Verlander replacement-level pitchers EVERY START. I find it utterly inconceivable for that to have been true.
Second of all, it is not at all self-evident that pitchers have some control over BABIP. Well, I shouldn’t say that – “somewhat” responsible is certainly true. But the extent to which it’s relevant is where I’m somewhat dubious. Over and over again, we’ve seen that pitchers aren’t really able to sustain extreme outlier success on BABIP. This is utterly unlike other pitching elements (like HR, BB, or SO rate). It’s also utterly unlike hitters, who have been demonstrated to produce outlier BABIPs year after year, either due to speed, solid contact, or both. (Mike Trout, for example, has a .348 career BABIP.) Five years ago, Verlander’s BABIP was over one HUNDRED points higher than it was this year. Do you think that had more to do with the fact that Verlander was much worse at telling the ball where to go, or that the Tigers defense that year was worse than the Astros’ was this year?
Second of all, and this is just fun with math, let’s say that seven of those Verlander homers stay in the yard. That means that he’s A.) at the exact same homer rate he’s given up for the last THREE years, and B.) he’s right on track with Cole. If we keep 7 homers in the yard, his BABIP goes up to .234. That’s 15 points of BABIP Verlander is receiving as a “reward” because the ball flew out instead of bouncing off the wall. This is a struggle of BABIP. Over a quarter of the BABIP gap between Cole and Verlander is closed, simply by making those homers into doubles.
You are welcome to consider Verlander’s WHIP as part of the equation. It’s immensely impressive. I think I have, in fact, done just that by considering Verlander’s ERA. Purely by ERA WAR, I have Verlander at 7.9 WAR, Cole at 7.8. I think there’s enough uncertainty in terms of crediting/debiting pitchers vs. fielders for batted ball results to be a little bit suspect about whether Verlander was that much better. FIP sees Cole at 7.4 WAR, Verlander at 6.1. (For the record, those WAR numbers I’m citing are my own, not publicly-available ones.) For me, that says that Cole is definitely worth about seven-and-a-half wins. But Verlander? Anywhere from six to eight, depending on how much credit goes to him, how much to his fielders, and how much just to random variation (aka chance, luck, circumstance, whatever – I really don’t want to have that debate again, though). That to me makes Cole the solid favorite.
I’m not saying I couldn’t be convinced otherwise. I’d just have to see a really compelling reason why FIP was doing wrong by these guys. For me, at least a part of the question is this: if we re-played the whole season over again 1000 times, whose performance, given their underlying ability, would be best over those 1000 seasons? I think it’s Cole’s. Now, it’s perfectly rational to say that such a criterion is bad, unfair, stupid, or silly, because what we’re supposed to be doing is awarding the individual season, not 1000 hypothetical ones. Fair enough. But when you’re dealing with these fine, fine degrees of difference, I think repeatability is a perfectly reasonable criterion. So I’m going to say it’s Cole, and that, while it’s close, it’s not that close.
Doom, A detail first: in your first paragraph, I think you’ve reversed Cole and Verlander. (It doesn’t affect your basic argument.) Now substance: The point I’m making does not involve an All-Star/Replacement-Level contrast. The Astros scored an almost-league-average number of runs for Verlander (4.9) and an exceptionally high number of runs for Cole (6.7), including 11 runs or more seven times. Given Houston’s overall R/G of 5.7, pitching opponents against the pair certainly pitched like a set of above average and replacement level pitchers. As I understand your argument, the explanation does not lie in daily changes in opposition pitching, it lies in the daily variation in performance of a generally stable Houston line-up: Houston position players batted like All-Stars when Cole pitched and like slightly below average players when Verlander pitched. You find the correlation between super/average pitching against Verlander/Cole to be utterly inconceivable, but not the correlation between average/super Houston hitting. I can’t see why inconceivability would lie on the pitcher side and not the batter side. We could look and see whether the individual opposition pitchers involved in those games were generally different in quality: that’s something we can test. But I don’t see any way to test the idea that the improbable outcome was due to normal, or abnormal, variation in batter performance. Unless you’re up for going through the oppo pitching roster, I think the theory that the variation lies with one player-factor is a lot more probable that one that locates the variation in nine player-factors.
In your second paragraph, you liken season to season BIP result variability to what we see with Verlander and Cole. You suggest Verlander’s poor BABIP 2014 result vis a vis 2019 was due to inferior defense in Detroit. Sure. I’m certain that’s a big part of the picture. But it’s not relevant here because we’re comparing two pitchers who share a single defense. I think we would both agree with the statement: BABIP has something to do with pitcher performance, but it is undetermined how much. If we were to test how much, we’d want to examine seasons like Cole/Verlander-2019, because this is as close to a controlled experiment as we’re likely to get. One season does not make an experiment: we’d want the 1000 you suggest later, and we’d also want to consider any factors that might skew the results (such as one pitcher being a knuckleballer), but the Cole/Verlander disparity on this score is very high. I guess I’d add that although I haven’t tallied all kinds of errors, the ROE counts for Cole and Verlander are identical (5), suggesting that the difference in fielding performance was not very likely to involve fielder flubs, but rather the fieldability of the BIP, for which fielders are likely to bear a smaller portion of responsibility.
Your third paragraph makes a good point: we can convert Verlander’s seven surplus HRs into a different measure in order to balance them against Cole’s surplus BABIP. Once the trade-off is cashed in, Cole’s BABIP is still about 20% higher than Verlander’s, and the thing FIP likes most about Coles-vs-Verlander has largely been eliminated. (Of course, Verlander’s 7 HRs were still HRs, not the doubles you converted them into.) I think the force of your argument actually tends more towards confirming the point I’m making.
Unlike you, I have no clue which pitcher would come out on top if we replayed the 2019 season 1000 times. But it seems to me that there may some circularity to the argument that because FIP favors Cole by a lot and WAR is about even, we should expect Cole to come out ahead in the 1000 replays, because there’s no reason to think FIP is underrating Verlander. I think the key to this argument is buried in the phrase, “given their underlying ability.” I understand you to believe that FIP is the best index for that, but, as you know, I’m not convinced that’s true, so an argument from that premise won’t seem persuasive to me–it is, I think, more or less the point we’re debating.
By the way, I don’t recall anyone 40 or 50 years ago making the arguments about differential offensive support that you refer to. (I do recall something like that in the case of Nolan Ryan, whose huge number of Ks and BBs were said to leave his fielders tired and impatient.) They would not, of course, have been good arguments. I hope the arguments I’m making are not of that quality.
1. Verlander
2. Cole
3. Morton
4. Bieber
5. Minor
Jacob deGrom’s ERA+ of 188 for his age 30-31 Cy Young award winning seasons is 4th in the live ball era amongst pitchers with 300 IP. His 21 wins are 357th.
You didn’t ask this as a trivia question. I chose to interpret it as such.
Lefty Grove (1930-31), 200
Pedro Martinez (2002-303), 206
????Sandy Koufax (1966), 190????
Koufax meets the innings threshold, though it’s only one season. Was he the third? I manually searched, and I got the first two right away (first two guesses). Then I went through like 10 other pitchers before the thought crossed my mind, “Maybe Koufax made 300 innings in his last year!” Not a P-I subscriber, so I’m not sure if that’s who you’re thinking of. Lofty, lofty company, either way.
Doom,
No trivia – just an observation and, IMO, an indication of how the voters are dependent on the new metrics….yes, Koufax is the third despite retiring. I was going to use 324 IP (2 x 162), however, by just a quirk used 300 IP and Koufax, in hindsight, would have missed at a mere 323 IP in his age 30 season.
I did use 22 wins as the cutoff and, yes, 356 hurlers over the last 100 seasons have managed to win 22 or more games in their age 30 and 31 seasons combined.
As far as being without a PI subscription, you can turn the lists upside down and manage to generate a top 10 or 11 (barring ties at 20th) by selecting “use ascending order” after finding out what value is 20th best on the descending list . Just choosing >/= for the stat your searching….sorry, if confusing
If you play your cards right you could go down the entire list on the PI, 10 names at a time.
Richard,
Yes…..framed within the old “greater than or equal to this” and “less than or equal to that”
1. Cole
2. Verlander
3. Morton
4. Bieber
5. Minor
With Verlander and Cole, and Minor and Lynn, the AL has two teams with a pair of 6 WAR pitchers (as measured by B-R). Doesn’t happen that often.
AL – 2019, 2007, 2002, 1993, 1929, 1920, 1913, 1903
NL – 2009 (3 teams), 2003, 1977, 1975, 1969 (3 teams), 1967, 1901
Nice to read the discussion here, I don’t post much but always catch up on all the comments, although rarely with the conflation of being timely enough to be relevant and also feeling like I have something of value to add. But I can always vote!
As has been outlined nicely here in a number of ways, there’s a hairsbreadth between Cole and Verlander in terms of the statistical quality of their season. I am a stats guy, through and through, but I also tend to think that all things being so even from most statistical perspectives, narrative serves as a perfectly valid and excellent tiebreaker. I expect this level of excellence from Verlander, and Cole was a pleasant surprise, so I dunno, that’s enough for me.
1. Cole
2. Verlander
3. Morton
4. Giolito
5. Bieber
FYI, I’m away right now. We’ll keep the polls open until 11:59:59 on TUESDAY night. Sorry for the inconvenience, and thanks for voting!
Here are the (very late) results! As always, presented as such:
Name, Vote points (first place votes)
Here are your AL Cy Young vote recipients:
1. Gerrit Cole, 47 (5)
2. Justin Verlander, 41 (3)
3. Charlie Morton, 19
4. Shane Bieber, 11
5. Lance Lynn, 8
6. Mike Minor, 5
7. Lucas Giolito, 4
8. Eduardo Rodriguez, 1
Cole and Verlander, unsurprisingly, were 1-2 on every ballot. Not much else to say here that hasn’t already been said in the commentary, so I’ll shut up about it.
As always, I like to see who was closest to a “consensus” ballot. Both koma and I named the top five on our ballots. However, only Doug named the top four players, and in the correct order. So he’s the big winner this time. 🙂
Doom,
ehhhh-hemmm. I believe your’s truly named the first four in order as well. Looks like Doug and I will have to share that carton of rotten grapefruit. However, it appears that Doug wins the tiebreaker (and the carton of rotten grapefruit) with Minor finishing 6th and my pick for 5th, Eddie Rodz, finishing 8th. So much for pitching to the score……