
This post is for voting and discussion in the 140th round of balloting for the Circle of Greats (COG). This is the last of three rounds of balloting adds to the list of candidates eligible to receive your votes those players born in 1979. Rules and lists are after the jump.
The new group of 1979-born players, in order to join the eligible list, must, as usual, have played at least 10 seasons in the major leagues or generated at least 20 Wins Above Replacement (“WAR”, as calculated by baseball-reference.com, and for this purpose meaning 20 total WAR for everyday players and 20 pitching WAR for pitchers). This group of 1979-born candidates, comprising those with R-Z surnames, joins the eligible holdovers from previous rounds to comprise the full list of players eligible to appear on your ballots.
In addition to voting for COG election among players on the main ballot, there will be also be voting for elevation to the main ballot among players on the secondary ballot. For the main ballot election, voters must select three and only three eligible players, with the one player appearing on the most ballots cast in the round inducted into the Circle of Greats. For the secondary ballot election, voters may select up to three eligible players, with the one player appearing on the most ballots cast elevated to the main ballot for the next COG election round. In the case of ties, a runoff election round will be held for COG election, while a tie-breaking process will be followed to determine the secondary ballot winner.
Players who fail to win either ballot but appear on half or more of the ballots that are cast win four added future rounds of ballot eligibility. Players who appear on 25% or more of the ballots cast, but less than 50%, earn two added future rounds of ballot eligibility. One additional round of eligibility is earned by any player who appears on at least 10% of the ballots cast or, for the main ballot only, any player finishing in the top 9 (including ties) in ballot appearances. Holdover candidates on the main ballot who exhaust their eligibility will drop to the secondary ballot for the next COG election round, as will first time main ballot candidates who attract one or more votes but do not earn additional main ballot eligibility. Secondary ballot candidates who exhaust their eligibility will drop from that ballot, but will become eligible for possible reinstatement in a future Redemption round election.
All voting for this round closes at 11:59 PM EST Sunday, February 25th, while changes to previously cast ballots are allowed until 11:59 PM EST Friday, February 23rd.
If you’d like to follow the vote tally, and/or check to make sure I’ve recorded your vote correctly, you can see my ballot-counting spreadsheet for this round here: COG 1979 Part 3 Vote Tally. I’ll be updating the spreadsheet periodically with the latest votes. Initially, there is a row in the spreadsheet for every voter who has cast a ballot in any of the past rounds, but new voters are entirely welcome — new voters will be added to the spreadsheet as their ballots are submitted. Also in the spreadsheet is a column for each of the holdover candidates; additional player columns from the new born-in-1979 group will be added to the spreadsheet as votes are cast for them.
Choose your three players, for both the main and secondary ballots, from the lists below of eligible players. The current holdovers are listed in order of the number of future rounds (including this one) through which they are assured eligibility, and alphabetically when the future eligibility number is the same. The 1979 birth-year players are listed below in order of the number of seasons each played in the majors, and alphabetically among players with the same number of seasons played.
Holdovers:
| MAIN BALLOT | ELIGIBILITY | SECONDARY BALLOT | ELIGIBILITY |
|---|---|---|---|
| Dick Allen | 9 rounds | Billy Williams | 5 rounds |
| Vladimir Guerrero | 6 rounds | Bobby Abreu | 4 rounds |
| David Ortiz | 4 rounds | Ken Boyer | 4 rounds |
| Gary Sheffield | 3 rounds | Richie Ashburn | 2 rounds |
| Luis Tiant | 3 rounds | Stan Coveleski | 2 rounds |
| Bobby Wallace | 3 rounds | Andre Dawson | 2 rounds |
| Ted Lyons | 2 rounds | Don Drysdale | 2 rounds |
| Willie Randolph | 2 rounds | Andruw Jones | 2 rounds |
| Scott Rolen | 2 rounds | Monte Irvin | 2 rounds |
| Todd Helton | this round ONLY | Don Sutton | 2 rounds |
| Minnie Minoso | this round ONLY | Reggie Smith | this round ONLY |
| Ted Simmons | this round ONLY | ||
| Chase Utley | this round ONLY |
Everyday Players (born in 1979, R-Z surname, ten or more seasons played in the major leagues or at least 20 WAR):
Juan Uribe
Jayson Werth
Ramón Santiago
Carlos Ruiz
Josh Willingham
Kevin Youkilis
Pitchers (born in 1979, R-Z surname, ten or more seasons played in the major leagues or at least 20 WAR):
Rafael Soriano
Chris Young
Johan Santana
Wandy Rodríguez
Brad Ziegler
Juan Rincón
Brandon Webb
As is our custom, here are quiz questions for each of the new players on the ballot.
1. Juan Uribe played over 15 post-season games at both SS and 3B. Which other player has done the same? (Manny Machado)
2. Jayson Werth posted 1.361 OPS for the Phillies in the 2008 World Series. Which Phillie outfielder posted a higher OPS in a single World Series (min. 15 PA)? (Lenny Dykstra, 1993)
3. Ramón Santiago’s 59 OPS+ in 2003 is tied with several players for the lowest mark by a Tiger in a qualified season (modern definition). Which of those players recorded the lowest career OPS+ among All-Stars with 5000+ PA careers? (Ed Brinkman)
4. Carlos Ruiz teamed with Cole Hamels to form the most durable battery in Phillies history, with 207 regular season starts together. Whose franchise record did Ruiz and Hamels break? (Pete Alexander/Bill Killefer, 191 starts)
5. Josh Willingham recorded 5 qualified seasons in his career, all of them with 20 HR, 25 doubles, 50 walks and 10 HBP, and is the only player to post such seasons for four different franchises. Which player recorded the most such seasons in a career? (Carlos Delgado, 1998-2007)
6. Kevin Youkilis recorded consecutive 400+ PA seasons (2009-10) slashing .300/.400/.500 for Boston. Which player recorded the longest streak of such seasons by a Red Sox first baseman? (Mo Vaughn, 1996-98)
7. Rafael Soriano is one of seven pitchers to record a 40 save season for three different franchises. Who was the first pitcher to do this? (Jeff Reardon, 1991)
8. Chris Young is one of eight Padre pitchers to record consecutive seasons with 30 starts and 3 WAR. Which two of those pitchers accomplished this feat in the same seasons? (Bruce Hurst/Ed Whitson, 1989-90)
9. Johan Santana is the only pitcher with three consecutive seasons (2004-06) leading his league in WHIP, ERA+ and SO/9. Which pitcher recorded the most seasons leading his league in all three of those categories? (Pedro Martinez, 5 seasons)
10. Brad Ziegler is the only pitcher with top 10 career ranks in ERA, ERA+ and HR/9, among retired relievers with 500+ game careers. Ziegler’s 390 ERA+ in 2008 is the best in any 50+ IP debut season. Which pitcher has the top ERA+ in a 50+ IP rookie season? (Rob Murphy, 1986)
11. Wandy Rodríguez recorded a 37 point improvement in his ERA+ from his first three seasons to his next three campaigns, the fourth largest such increase among starting pitchers with 300+ IP in both periods and with ERA+ under 90 in the first. Which of those pitchers recorded the largest such ERA+ improvement? (Jake Arrieta, 73 points)
12. Juan Rincón recorded four straight 70+ IP seasons (2003-06) for Minnesota. Which pitcher recorded the only longer streak of such seasons by a Twins reliever? (Al Worthington, 1964-68)
13. Brandon Webb posted a qualified 125 ERA+ in each of his first six seasons. Which other modern era pitcher did the same? (Mordecai Brown, 1903-10)
And, a couple of unanswered quiz questions from last week’s post.
14. Dan Johnson posted 7 consecutive seasons (2008-15) of 40 or fewer games, playing first base in all of them. Which player has the only longer streak of such seasons? (Russ Morman, 8 consecutive seasons 1988-91, 1994-97)
15. Jon Garland was a CG winner in his first post-season game, allowing 2 runs on 4 hits. Who is the last pitcher to allow more than 2 runs in a CG win in his post-season debut? (Gaylord Perry, 1971 NLCS)
I propose that after this round, we have a 2nd Chance round. A ballot where anyone who has ever stayed for more than one round on the main or secondary ballots is given a chance to get back into the discussion.
Just in the last two weeks we have lost Berkman and Nettles.
Perhaps the system is perfect as it is, and the guys who have fallen off are right where they should be.
But as we are not as active as we used to be, it would give us something to do, while we still have the momentum of this year’s COG voting…
Yes, we could do that. Would like to keep the Secondary ballot to 15 or fewer players, so we do have room to add a few names.
I’ve been thinking that perhaps we should give Holdover players demoted to the Secondary ballot at least two seasons of eligibility on that ballot, rather than the current one. Basically, give them some credit for making it onto the Primary ballot, and more opportunity to get back there. Any thoughts on that?
Johan certainly has a case for the COG, even with 51.7 WAR.
Averaged 7.1 WAR over his 5 year peak.
23rd in WAR7adj, tied with Spahn and Vance
(Top 7 seasons, stat maxes out seasons at 250 IP, to neutralize the 19th century innings monsters).
Only 16 pitchers have more top 5 CY votes.
In his peak from 2004-2008, he was arguably the greatest pitcher in the world, as that half decade was at the tail end of the careers of Clemens, R Johnson, Schilling, and Pedro.
Here is the bottom of the WAR list for our COG Starting Pitchers:
57.2 Mordecai Brown (58.3 incl offense)
53.5 Edward Ford (57.0)
53.1 Sanford Koufax (48.9)
51.1 Johan Santana (51.7)
48.8 Wesley Ferrell (60.1)
47.0 Leroy Paige (47.0)
On Santana:
A quick glance at his career and stats makes him appear superficially similar to Koufax: Not as erratic early on, breakout season as a starter at age 25, performing exceptionally for seven years to Sandy’’s six, career truncated by injury. Lots of strikeouts, excellent FIP and WHIP.
He was a better pitcher in his early twenties than Koufax was, but went out with his career in somewhat of a decline, whereas Koufax retired at his peak.
The fact that he spent just one year in the HOF ballot sweepstakes strikes me as an absurdity, even given the relative shortness of his career, which is not to say that he is necessarily Hall of Fame worthy.
Despite all that, it’s hard to consider the two as really similar pitchers. A subject I don’t recall ever being addressed years ago, even though Koufax wasn’t the COG shoo-in one might have expected, was that his Dodger Stadium stats are unreal: in 86 games, all but one as a starter, his ERA was 1.37. His away ERAs during those five years were 3.53, 2.31, 2,93, 2.72, and 1.96. All the noise made by the detractors of Whitey Ford because he was a lefty in Yankee Stadium—career Home/Road ERAs, 2.58/2,94—seems a little overblown given Koufax’s domination at the LA venue. As for Santana’s ERA splits, they aren’t far off from Ford’s, 3.04/3.39, although he pitched for two teams and in four stadiums as a Met.
Another huge difference one has to consider is that Koufax in his maturity played in an era of pitching dominance. Santana had no such luck. To counterbalance that, however, Koufax started every four days in his prime and was expected to go deep into the game if not to complete it. Santana started every five days and seldom went past the seventh inning, often not past the sixth, even when he was ahead, thanks to pitch count theory.
Does this ambiguity indicate that that Santana might be a superior COG candidate to Lyons or Tiant or at least of equal consideration?
The problem, despite the supposed bullet-proof reliability of modern statistical approaches like WAR and ERA+, is that baseball players are or were living, breathing individuals, not robots off an assembly line, and they each played in situations and environments unique to themselves. Lyons did remarkable things late in his career; Tiant reinvented himself after nearly dropping from sight; for five years Santana shone like a nova in the Minnesota sky. Does that relatively brief brightness equal or better the duller but more prolonged illuminations of the other two? Do his 2025 innings match the 3486 of Tiant or best the 4161 of Lyons in terms of quality? And what about ambient circumstances, such as the fact that Lyons played most of his career for teams with losing records, some of them abysmal? WAR, I believe, is supposed to have that issue all figured out, no ambient circumstances need apply, but I don’t think that’s a realistic assessment. It’s an assessment made by people who have a great deal of experience with numbers, but who probably have never played team sports like baseball much, if at all.
Santana’s uniqueness makes him interesting enough to look at seriously at least.
Wonderful analysis, nsb, as usual. It’s good to see you and Voomo going at in-depth analysis and advocacy, which is what made CoG voting strings so interesting.
Santana definitely requires you to think whether “greatness” is best measured by peak value or cumulative career value.
Adam Darowski’s Hall of Stats uses a methodology to distinguish these two components of greatness, and then combines the two into a single score. In Santana’s case, that score is 108 (where 100 = HoF-worthy), with 64% of the score resulting from peak performance. Sandy Koufax scores 102, with 54% resulting from peak performance.
Adam announced at the end of December that he will no longer be updating the Hall of Stats database. The above link is a database archive current to the end of the 2022 season.
# 4) Robin Roberts/Stan Lopata ? (Carlton didn’t like pitching to Boone and preferred McCarver – I just don’t think McCarver played enough with the Phillies)
Here’s what I came up with:
Carlton/Boone 146 games
Roberts/Lopata 136 games
Roberts/Seminick 126 games
It’s none of those.
How about Lonborg/Boone, 155 games?
Not them.
Pete Alexander and Bill Killefer 1911-1917? (and then some more with the Cubs)
Well done, Paul. You can read more about Alexander and Killefer in my post about 200 game batteries, now updated to show Wainwright and Molina as the most prolific battery of the modern era.
In unloading Alexander and Killefer to the Cubs, the Phillies were evidently following the example of the other Philadelphia team in trading away their best players after winning a championship, albeit two seasons removed. In exchange for those two, the Phils got immortals Pickles Dilhoefer and Mike Prendergast. They got one season of league average pitching from the latter, and all of five games from the former before packaging him with Milt Stock and Dixie Davis for three players. Stock was just entering his prime and gave the Cardinals 5 solid seasons at 3rd base, and Davis provided the Browns with 6 seasons of slightly above league average pitching. The only value for the Phillies from the three players they received was when one (Doug Baird) was traded to the Cardinals for Lee Meadows who would give the Phillies three seasons of 110 ERA+ pitching.
The Phillies threw away Jenkins and Sandberg. And, their hands were sort of forced when they dealt Allen and Rolen to the Cards….
Doug: I came up with 199 games for Alexander/Killefer.
These are the games I found on B-R.
I did more research and then realized that 199 games is in error and the answer is what you found. I created a spreadsheet that identifies starting batteries but something is awry.
I found 149 games for Carlton/McCarver
Tuna,
All with the Phillies? or some STL?
Only with the Phils.
Yes, as Doug mentioned, I only looked at their time together with the Phillies.
#2) Lenny “Nails” Dykstra in 1993 (1.413)
For #7 I got Jeff Reardon who did it while on the Red Sox in1991
Reardon is correct, recording 40 save seasons with the Expos, Twins and Red Sox. In his last season in Boston (1992), Reardon passed Rollie Fingers for the career saves record. The next season, Lee Smith passed Reardon.
Answer to #12 is Al Worthington with 5 straight seasons.1964-1968.
Worthington, who celebrated his 95th birthday last week, posted those seasons aged 35-39. For his career, Worthington recorded 8 seasons with 75+ IP in relief, including two (1957-58) in which he also logged 60+ IP as a starter.
#10: Jonathan Papelbon
You would certainly think Papelbon’s 517 ERA+ would have to be the best. But there’s another rookie season even better.
Finally found it: Rob Murphy in 1986.
#9: Pedro Martinez with five? Walter Johnson is the only other pitcher I have found with even three such seasons.
Pedro is correct. I think the totals are:
5 – Pedro
3 – Santana, Walter Johnson
2 – Vance, Seaver, Randy Johnson
1 – Waddell, Alexander, Grove, Newhouser, Koufax, Kershaw, Dutch Leonard, Hippo Vaughn, Harry Brecheen, Mike Scott
#6) Mo Vaughn 1996-98 (with a 152 OPS+ to boot)
Vaughn is correct.
Which contemporary of Vaughn bested his feat as a first baseman, with 5 such consecutive seasons including, like Vaughn, 150 OPS+ and 35+ HR each year?
Frank Thomas?
Thomas posted those seasons from 1993 to 1997, thus including two short seasons (one that was really short) in which he still managed to swat 35+ dingers.
Frank Thoams was doing a Ted Williams imitation for a while there. Interesting that both 1995 league MVP’s, Vaughn and Larkin, had better seasons in 1996 and didn’t get a single first place vote for MVP between them
Nothing against Vaughn. He had a fine season in ’95, but had no business beating out Thomas and, especially, Albert Belle for MVP.
Thomas was the 2-time defending MVP and, since his numbers were down from ’94 when he just plain unconscious, I can sort of see why voters would shy away from him. But, Belle? 103 XBH, 377 TB, only 50 double/50 HR season ever, and all in a short season, and he was even almost league average defensively (-1 Rfld). So, maybe he was a bit of a jerk, but is that a reason to jerk him around in the MVP vote! Hope not, but I suspect his personality certainly influenced more than a few voters.
In 1995, Jayson Stark (who’s actually a real nice guy and fan of the game) wrote sort of a “Nah-Nah” article about Albert’s “pretty numbers” and his failure to treat people (i.e. Sportswriters/The Voters) in a humane fashion and the apparent consequences.
Supposedly, Belle was very intelligent but was either on a steroid cycle or just had a loose screw…..”but, hey, I’m no doctor”. He had a few years putting up incredible numbers with the Tribe – and at least one with CWS as well
#5) Anthony Rizzo with six (?)
Not Rizzo.
How about Frank Robinson?
Not Robinson.
Hint is that the player you’re looking for was a contemporary of Willingham, playing against him in over 40 games. In those head-to-head tilts, Willingham had the edge over the career leader in HR, 2B and BB.
I was surprised that someone had more than Robinson’s seven. But Carlos Delgado had far more, with ten consecutive seasons.
Delgado is correct.
Certainly some similarities between Delgado and his 2009 Mets teammate Gary Sheffield. Both defensively challenged sluggers, they put up similar career rate stats and power numbers (stolen bases are a notable and significant difference in Sheffield’s favor):
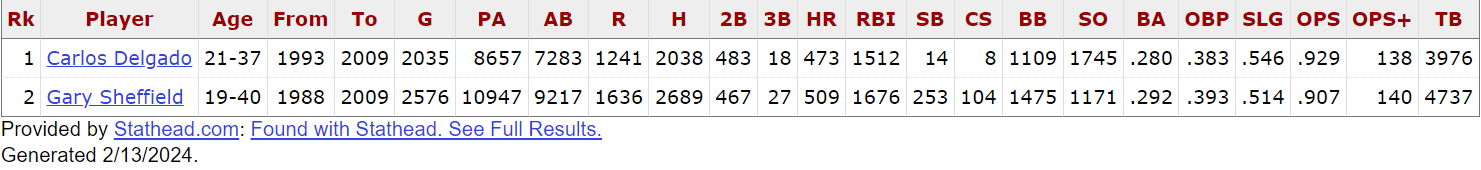
They also had very similar peak WAR for 5 years (26.1/25.9, Delgado first) and 10 years (41.8/41.1). But, Sheffield logged about ⅓ more career WAR with about 25% more games, starting his career earlier and finishing later. Here are their PA and WAR:
Thru age 24 – Delgado: 823/0.4, Sheffield: 2419/7.6
Age 35+ – Delgado: 1405/2.1, Sheffield: 2912/11.8
Answer to #1: Manny Machado
Doug mentioned Adam Darowski’s Hall of Stats rankings in a great discussion thread on Johann Santana above, with arguments from Voomo and nsb. Adam (who posted here a few times, as I recall) evaluates players on the basis of a formula weighing peak measures against cumulative statistics, arriving at a single number, as Doug mentions. For context of scale, Ruth is at the top with 399. Six players break 300; 25 more break 200; 36 more break 150. Anyone with a score of 100 or more is in Adam’s “Hall of Stats” and has a ranking. There are 242 members. (The CoG is more exclusive, with 140 current members.)
Here are Adam’s ratings for all the players on the holdover ballot, plus Johann:
Wallace 146 (Rank: #76 all time)
Rolen 143
Utley 135
Tiant 128
Randolph 125
Lyons 124 (Rank: #141 all time — with 141 = the size of the CoG after this round)
Helton 121
Allen 116
Sheffield 116
Simmons 113
Guerrero 112
Minoso 111
Santana 108 (Rank: #200 all time)
Ortiz 95
Last round I voted for Wallace, Lyons, and Rolen, with the first two based on a concern that they would fall by the wayside because of distance in history, rather than merit, and Rolen based on WAR (although these three are indeed the top three in WAR on our list too). This time I’m going to add in reflection on Adam’s figures too before voting, along with thought of Doug’s very good discussion of Tiant last round.
And I’d urge every one to read nsb’s discussion of Santana (and Koufax, etc.) because of his very nuanced view of how it’s important not to ignore the contexts of the specific skills of these players and the eras they played in. It’s what makes CoG voting a complex pleasure–and difficult.
Bob:
One of the unfortunate results of baseball fandom turning blindly to interpretive statistics as the ultimate source of judgment—an awkward beginning, but let it stand—one of those results is that reasoned discussion and arguable disagreement are stifled. Don’t have to look at the details of a player’s career, don’t have to judge him critically, don’t need to know his biography or his teams’ histories during his playing career, don’t need even to know the difference among eras, dead ball, live ball, steroid, and all the others. Just need to know WAR.
Somewhere in the works of Thomas Wolfe there’s a vignette about an old crippled Confederate Civil War veteran who silences all discussion about the conflict by pointing to the site of his wound and saying “Look ye thar!” I’m not saying —or maybe I am—that Baseball Reference, FanGraphs, et al try to do the same thing concerning the vast intriguing, complicated subject of Baseball, but my impression is that because of their efforts to quantify overall performance into one number, far too many casual followers of the game have no interest in the specifics that used to fuel the reasoned discussion and arguable disagreement mentioned above.
In extra innings when the game was on the line Mickey Mantle batted .361 with an OPS of 1.305. Don Drysdale’s W/L percentage against teams that finished above .500 was .495. His teammate Sandy Koufax’s was .651. Ron Santo played his entire career without allowing it ever to be known that he suffered from diabetes. Hoyt Wilhelm’s knuckler resulted in at least 271 passed balls. Mariano Rivera’s battery mates allowed 14 in about 55% as many innings.
Each of these facts has meaning. Each bears upon how we assess or ought to assess the value of the players to which they are attached. They aren’t just trivia, factoids to amuse.
So—yes, more discussion, less quick judgment in the COG voting would be welcome.
Can you re-write that line about Mariano? I don’t understand..
I think nsb’s point is that, great as Wilhelm’s knuckler was, it had an enormous downside (so to speak) in terms of generating PBs that affected game outcomes, whereas Rivera’s cutter did not.
I remember that the Orioles provided Wilhelm’s catcher, Gus Triandos, with a hugely oversize mitt at one point. The goal wasn’t to catch the knuckler, just to block it.
Great stat on Drysdale vs. Koufax. Fans of Brooklyn–even once they started playing home games away–were well aware of this contrast.
Got it. It was a comparison to Wilhelm.
Voomo:
Wilhelm’s passed ball numbers, according to observers during his career (although admittedly, I have no source for this observation except my own aged memory) were understated, but even given the data as is, Rivera’s battery mates allowed a mere10.9 percent as many. I just picked Rivera for comparison because he’s regarded as the premier reliever of all-time by numerous informed observers. Gossage may be a better match. In 1800 innings he suffered 17 passed balls compared to 271 in 2250 for Wilhelm or 9.4 percent.
All three were relief pitchers (although Wilhelm and Gossage each spent one season as a starter).The point, of course is that relievers spend much of their time on the mound with runners on base. Their job is to prevent those runners from advancing. Passed balls allow runners to advance. Wilhelm’s percentage of inherited runners who scored was .35, Rivera’s .29, Gossage’s .33, Reardon .30, Hoffman .20, Smith .28.
Wilhelm recorded an abnormally high number of wild pitches too, probably owing to the knuckler. The knuckler took away, but it also gave.
Great comment. Couldn’t have said it better myself.
For the unanswered question 14 of the prior posting I came up with Gaylord Perry in game 1 of the 1971 NLCS as the Giants defeated the Pirates 5-4.
#3 above sounds an awful lot like Eddie Brinkman at 65 OPS+ (also, he had a 59 OPS+ TWICE with the Tigers in qualified seasons). But, just a guess, as I couldn’t recollect any hitters in Tigers’ history that bad…..
Brinkman is correct. His 65 career OPS+ is the lowest among all players with 5000+ PA careers who were ever selected to an All-Star team. That mark is lower even than Alfredo Griffin (67 OPS+) whose only All-Star appearance resulted from being plucked from the stands (literally) as an emergency replacement for Alan Trammell, who was injured in pre-game warmups for the 1984 game (Trammell didn’t return to the Tiger lineup until the end of July; they were still 13-5 without him, en route to their first pennant and WS title in 39 years).
#8) Bruce Hurst & Ed Whitson in 1989 , 1990.
Whitson led the NL in pitching WAR (7.0) in 1990 while going 14-9…. he was no match for Doug Drabek at 22-6 and garnered ZERO votes let alone any first-place votes
Hurst had a nice career, with 34 WAR and ten straight seasons with double-digit wins. Will always remember his 1986 World Series for which, if not for Buckner’s famous miscue, he might well have been named MVP, pitching 17 innings (the first 15 scoreless) to win games 1 and 5. Instead, he comes back on short rest in game 7 and stakes the Red Sox to a 3-0 lead after 5 innings. But, he was left in the game one inning too long, and the Mets completed their improbable comeback.
I’m sure you all know this but it’s amazing enough to bear repeating.
Hurst was the first left-handed Red Sox pitcher to win a world series game since Babe Ruth.
And an anagram of his name is:
B Ruth Curse
Never heard that one – Thanks!!
Vote:
Minnie Minoso
Willie Randolph
Johan Santana
Vote:
Secondary
Ashburn
Covlelski
Andruw Jones
Andruw Jones had an 11 year peak in which he averaged
157 Games
33 HR
100 RBI
5.5 WAR
22 rField
Arguably the greatest defensive CF ever.
For the 1979 – Part 3 election, I’m voting for:
-Vladimir Guerrero
-Todd Helton
-Willie Randolph
Other top candidates I considered highly (and/or will consider in future rounds):
-Rolen
-Utley
-Tiant
-Allen
-Wallace
-Lyons
-Sheffield
Quick Note: Should Brandon Webb have been listed as one of the new candidates for this selection? I would not be voting for him, but it looks like he had a 33.0 WAR.
Thanks!
You’re absolutely right, Opal. Brandon should be on the list. Sorry I missed him.
I’m guessing Webb would not have been the winner of the round but, since he arguably could have attracted a vote with that WAR total, I’ll keep him on the ballot for our next round.
For the Secondary Ballot, I’m voting for:
-Don Sutton
-Andre Dawson
-Andruw Jones
Thanks!
For reasons discussed above, I’m going to vote the Modified-Historical Party ticket:
Bobby Wallace
Ted Lyons
Luis Tiant
nsb has been calling for nuance in CoG decisions, and I’m going to be singlemindedly focused on nuance in presenting another iteration of The Case For Bobby Wallace.
1) My nuanced case for Wallace’s stats: Among eligible candidates he’s at the top of the WAR chart (76.4 — better than half the CoG membership) and the top candidate according to The Hall of Stats (see above).
2) My nuanced case for Wallace within his era: a pretty-good-pitcher-turned-virtuoso-shortstop (and above-average-batter), Wallace is the man who invented the modern shortstop scoop-and-throw, a highly nuanced motion. Wallace is the font of virtuoso shortstopism, whose image we see replicated in every routine 6-3 out.
3) My nuanced case for Wallace in history: He has (and I know this because I am making it up) the all-time highest Achievement/Recognition Ratio (ARR). This is a highly nuanced stat. Barney Dreyfuss said in 1911, “The best player in the American League, the only man I would get if I could, plays on a tail-end team, and few people pay any attention to him. I mean Bobby Wallace of St. Louis. I wish I had him.” At that time, Wallace’s ARR was already, as Dreyfuss clearly realized, an MLB-leading 54.6. But, as you know, lifetime ARR shifts even long after the lifetime ends, and Wallace’s ARR is now approaching 8-digit range, #1 on the B-R charts for players with more than 100 PA. There are of course, players with 50 or 60 PA whose ARR is infinite, because no one even remembers how to spell their names, if they actually had names (for example, Scott of the 1884 Baltimore Monumentals, whose last name is unknown, or whose first name is unknown, who hit a home run, and who some researchers believe was probably John Doe or his grandfather in witness protection).
Wallace has been spinning in the candidate circles of limbo or lower for years and years, his WAR steady, his ARR growing, and the time has come to lift him from those circles to the Great One, the CoG, where all nuance fades into the simple unity of The Elect. There may Wagner and Appling, Reese, Jeter, and Smith all scoop down in homage to the Paradigm of their Position and throw up their arms in welcome.
And also I’m stickin’ with Lyons, and Doug’s case for Luis last round earned him my vote.
Bob,
Quite nuanced, indeed.
I have to belive that “Scott” of the 1884 B’more Monumentals refers to a surname. The “Scott” moniker as a first name really has only caught hold in the last 60 years or so. Beam me up….
Paul, I’m sure you’ll recall that the 1871 Rockford Forest Cities were managed by the 24 year-old Scott Hastings, said to be the inventor of catcher hand signals. Hastings was still playing professionally as late as 1887 and could easily have been the Monumental Scott of 1884, especially if he’d shaved his prominent moustache in order to play in the Union Association incognito.
This is certainly a topic worthy of further research. Since Hastings’s first name was officially Winfield (the things we do to children!) I have to acknowledge a lapse in not considering the possibility that “Scott” was neither a first nor last name. (And had he been listed merely as “Winfield” I imagine many of us would have been egregiously misled.)
Interesting that Dreyfuss made the remark in 1911. As the Pirates owner, he presumably had not seen much of Wallace’s play since his NL days, which had ended ten years earlier. I suppose since his man Wagner was still going strong at 37, he assumed the same of Wallace, who was the same age.
Main Ballot;
Vladimir Guerrero
David Ortiz
Minnie Minoso
Secondary Ballot:
Bobby Abreu
Ken Boyer
I sort of forgot about this site for a while. I’m happy to see the COG is still going.
Main Ballot: Ortiz, Sheffield, Santana
Secondary: Sutton
Welcome back Chris.
On the subject of reducing everything to one statistic, here is a stat I created called PaWaa (Plate Appearances per Win Above Average).
It another way of looking at WAR,but Ive also broken it down in to PaWaa2000, PaWaa5000, PaWaa7000, PaWaa8000, PaWaa9000, PaWaa10000, and PaWaa11000…
…as a way of looking at players in the first xxxx# of PA in their career. This is to give perspective to careers like Albert Pujols, whose perceived greatness was diminished by longevity.
This list is probably not complete. And I just updated it for the first time since 2015, without going through Every one of the great players from this decade…
PaWaa – Career – Minimum 2000 PA
84.4 … (10622) Babe Ruth
97.2 … (9480) Rogers Hornsby
102.1 … (12606) Barry Bonds
102.5 … (6521) Mike Trout***
104.0 … (9788) Ted Williams
113.5 … (12496) Willie Mays
118.5 … (5404) Jose Ramirez***
122.2 … (3619) Aaron Judge***
124.0 … (5757) Mookie Betts***
123.1 … (9663) Lou Gehrig
125.7 … (9907) Mickey Mantle
127.7 … (11748) Honus Wagner
128.5 … (13084) Ty Cobb
135.8 … (11992) Tris Speaker
137.3 … (10062) Mike Schmidt
138.9 … (2084) Red Ruffing
140.5 … (7673) Joe DiMaggio
141.3 … (5695) Joe Jackson
147.3 … (5804) Jackie Robinson
150.7 … (13941) Hank Aaron
153.8 … (9676) Jimmie Foxx
155.8 … (12717) Stan Musial
160.7 … (11348) Melvin Ott
161.1 … (12207) Alex Rod
163.3 … (7722) Arky Vaughan
164.5 … (7370) Johnny Mize
164.8 … (6097) Hank Greenberg
166.4 … (7024) Lou Boudreau
166.6 … (8030) Larry Walker
172.4 … (10100) Eddie Mathews
176.2 … (6537) Joe Gordon
176.8 … (2033) Yordan***
179.3 … (11329) Joe Morgan
179.8 … (10211) Roberto Clemente
181.5 … (11742) Frank Robinson
182.1 … (9431) Jeff Bagwell
186.5 … (8674) Johnny Bench
187.5 … (3375) Juan Soto***
188.4 … (10740) Wade Boggs
189.4 … (8220) Bobby Grich
190.0 … (6443) Nolan Arenado***
192.2 … (7863) Chase Utley
194.5 … (13346) Rickey Henderson
209.7 … (11596) Al Kaline
212.1 … (6874) Manny Machado***
214.6 … (9057) Barry Larkin
215.9 … (13041) Albert Pujols
216.9 … (7745) Mike Piazza
223.6 … (7065) Bill Dickey
225.9 … (8674) Edgar Martinez
226.6 … (9019) Gary Carter
229.3 … (10550) Rod Carew
230.7 … (11625) George Brett
232.7 … (8237) Duke Snider
233.2 … (9376) Alan Trammell
234.5 … (9967) Lou Whitaker
241.8 … (9235) Kenny Lofton
242.6 … (12883) Cal Ripken
243.1 … (11304) Ken Griffey
243.6 … (9282) Ryne Sandberg
246.3 … (8840) Joe Cronin
247.1 … (10254) Luke Appling
247.2 … (6454) Bryce Harper***
247.3 … (8359) Yogi Berra
256.0 … (9397) Ron Santo
257.0 … (10075) Frank Thomas
259.1 … (10778) Ozzie Smith
262.9 … (8098) Fred Freeman***
280.4 … (13992) Carl Yaz
280.7 … (9853) Carlton Fisk
281.1 … (10232) Tony Gwynn
287.8 … (7712) Minnie Minoso
289.8 … (8143) Joe Medwick
296.0 … (10359) Tim Raines
297.5 … (11782) Brooks Robinson
298.7 … (9470) Pee Wee Reese
306.7 … (4815) Roy Campanella
318.8 … (9692) Willie McCovey
322.0 …(10400) Roberto Alomar
324.4 … (11418) Reggie Jackson
328.0 … (12167) Paul Molitor
331.0 … (12249) Robin Yount
350.0 … (9833) Harmon Killebrew
364.7 … (10394) Ernie Banks
413.2 … (12602) Derek Jeter
435.7 … (12504) Craig Biggio
474.8 …(12817) Eddie Murray
521.4 …(12358) Dave! Winfield
555.6 … (15890) Pete Rose
PaWaa 2000
74.3 … Babe Ruth
104.5 … Mike Trout
105.9 … Joe Jackson
109.1 … Stan Musial
111.6 … Ted Williams
113.2 … Willie McCovey
116.2 … Rogers Hornsby
113.7 … Willie Mays
127.3 … Kenny Lofton
127.6 … Lou Gehrig
133.4 … Red Ruffing
135.4 … Aaron Judge
135.6 … Bobby Grich
136.1 … Cal Ripken
137.0 … Johnny Mize
137.4 … Mookie
137.5 … Mike Schmidt
139.5 … Albert Pujols
142.5 … Mike Piazza
143.4 … Wade Boggs
146.5 … Alex Rod
147.5 … Jimmie Foxx
154.4 … Chase Utley
155.5 … Carlton Fisk (took him 7 years)
157.1 … Tris Speaker
158.7 … Rickey Henderson
159.5 … Frank Thomas
164.0 … Arky Vaughan
164.3 … Mickey Mantle
164.4 … Eddie Mathews
171.3 … Joe DiMaggio
173.7 … Johnny Bench
176.8 … Yordan
178.0 … Barry Bonds
178.3 … Edgar Martinez
178.9 … Juan Soto
179.5 … Mel Ott
183.3 … Craig Biggio
186.4 … Willie McCovey
188.4 … Manny Machado
189.1 … Frank Robinson
189.4 … Hank Greenberg
192.0 … Ken Griffey
199.3 … Jackie Robinson
200.5 … Joe Gordon
202.0 … Al Kaline
206.5 … Reggie Jackson
210.9 … Ty Cobb
210.9 … Barry Larkin
212.9 … Nolan Arenado
214.2 … Ernie Banks
215.1 … Honus Wagner
219.8 … Jeff Bagwell
233.1 … Gary Carter
235.6 … Larry Walker
237.3 … Jose Ramirez
238.2 … Hank Aaron
239.1 … Tony Gwynn
241.1 … George Brett
249.9 … Lou Boudreau
252.0 … Ryne Sandberg
255.6 … Derek Jeter
258.9 … Joe Morgan
288.7 … Rod Carew
289.4 … Paul Molitor
291.7 … Yogi Berra
292.2 … Tim Raines
300.6 … Lou Whitaker
365.9 … Duke Snider
433.6 … Pee Wee Reese
451.1 … Carl Yaz
508.6 … Alan Trammell
614.8 … Ozzie Smith
1117.2 . Pete Rose
3368 . Brooks Robinson
Negative … Roberto Clemente
Negative … Ron Santo
Negative … Robin Yount
PaWaa 5000
77.6 … Babe Ruth
93.8 … Ted Williams
96.0 … Mike Trout
97.9 … Rogers Hornsby
103.0 … Mickey Mantle
108.5 … Ty Cobb
109.8 … Willie Mays
111.8 … Barry Bonds
116.5 … Stan Musial
116.8 … Albert Pujols
117.6 … Lou Gehrig
118.5 … Jose Ramirez
118.7 … Tris Speaker
120.8 … Jimmie Foxx
121.1 … Mike Schmidt
121.8 … Wade Boggs
126.1 … Honus Wagner
128.0 … Ken Griffey
128.8 … Alex Rod
129.8 … Chase Utley
130.9 … Joe DiMaggio
133.7 … Johnny Mize
136.4 … Rickey Henderson
138.1 … Arky Vaughan
140.8 … Jackie Robinson
141.0 … George Brett
142.5 … Hank Aaron
143.8 … Joe Jackson
147.1 … Mike Piazza
148.3 … Ernie Banks
148.3 … Jeff Bagwell
148.9 … Eddie Mathews
154.6 … Mel Ott
155.5 … Frank Thomas
157.4 … Bobby Grich
158.4 … Johnny Bench
159.5 … Gary Carter
159.7 … Kenny Lofton
160.5 … Frank Robinson
161.8 … Hank Greenberg
162.8 … Lou Boudreau
164.8 … Reggie Jackson
165.2 … Joe Gordon
168.9 … Carl Yaz
169.4 … Larry Walker
172.7 … Barry Larkin
174.8 … Al Kaline
176.7 … Duke Snider
176.8 … Cal Ripken
178.3 … Edgar Martinez
184.0 … Carlton Fisk
186.4 … Willie McCovey
188.1 … Nolan Arenado
189.2 … Joe Morgan
195.4 … Tim Raines
196.3 … Rod Carew
197.0 … Ron Santo
210.1 … Willie McCovey
210.5 … Manny Machado
221.7 … Yogi Berra
240.8 … Lou Whitaker
243.0 … Derek Jeter
243.2 … Tony Gwynn
252.7 … Alan Trammell
255.4 … Pee Wee Reese
256.0 … Paul Molitor
262.9 … Robin Yount
266.9 … Craig Biggio
298.5 … Ryne Sandberg
324.0 … Ozzie Smith
333.3 … Brooks Robinson
349.2 … Pete Rose
468.8 … Roberto Clemente
PaWaa 7000
77.1 … Babe Ruth
94.0 … Rogers Hornsby
97.0 … Ted Williams
102.5 … Mike Trout
104.2 … Ty Cobb
105.6 … Mickey Mantle
106.8 … Willie Mays
107.9 … Honus Wagner
108.1 … Barry Bonds
111.2 … Albert Pujols
117.1 … Stan Musial
117.3 … Lou Gehrig
117.6 … Mike Schmidt
124.5 … Rickey Henderson
125.3 … Tris Speaker
125.4 … Alex Rod
135.2 … Joe DiMaggio
135.3 … Jimmie Foxx
135.4 … Hank Aaron
136.4 … Wade Boggs
139.6 … Joe Morgan
142.4 … Ken Griffey
143.4 … Mel Ott
145.7 … George Brett
150.6 … Eddie Mathews
151.9 … Cal Ripken
153.5 … Arky Vaughan
155.3 … Jeff Bagwell
157.8 … Johnny Mize
157.9 … Frank Robinson
160.0 … Larry Walker
160.8 … Gary Carter
161.3 … Johnny Bench
165.3 … Barry Larkin
166.0 … Lou Boudreau
166.3 … Bobby Grich
168.9 … Carl Yaz
174.9 … Rod Carew
177.8 … Al Kaline
179.5 … Reggie Jackson
185.3 … Edgar Martinez
193.2 … Frank Thomas
197.3 … Duke Snider
198.8 … Mike Piazza
199.6 … Kenny Lofton
203.0 … Ron Santo
203.6 … Ernie Banks
208.9 … Alan Trammell
210.1 … Willie McCovey
214.3 … Craig Biggio
217.2 … Carlton Fisk
220.7 … Yogi Berra
227.8 … Ryne Sandberg
231.5 … Tony Gwynn
233.6 … Tim Raines
236.2 … Eddie Murray
237.4 … Minnie Minoso
240.9 … Joe Cronin
244.0 … Brooks Robinson
245.6 … Robin Yount
246.1 … Paul Molitor
248.0 … Lou Whitaker
254.4 … Harmon Killebrew
254.6 … Pee Wee Reese
255.1 … Ozzie Smith
264.5 … Joe Medwick
271.5 … Roberto Clemente
274.4 … Derek Jeter
287.0 … Roberto Alomar
288.6 … Dave Winfield
295.6 … Luke Appling
302.4 … Pete Rose
PaWaa 8000
79.1 … Babe Ruth
93.7 … Rogers Hornsby
96.1 … Ted Wiliams
101.5 … Willie Mays
103.9 … Ty Cobb
108.6 … Mickey Mantle
109.2 … Barry Bonds
109.2 … Honus Wagner
115.4 … Lou Gehrig
121.0 … Stan Musial
121.5 … Albert Pujols
123.4 … Mike Schmidt
124.7 … Tris Speaker
128.7 … Rickey Henderson
132.4 … Alex Rod
133.4 … Jimmie Foxx
133.8 … Hank Aaron
141.7 … Joe Morgan
142.5 … Mel Ott
148.3 … Eddie Mathews
155.0 … Wade Boggs
156.3 … George Brett
157.2 … Ken Griffey
161.6 … Cal Ripken
161.9 … Frank Robinson
164.3 … Johnny Bench
164.8 … Jeff Bagwell
166.6 … Larry Walker
175.4 … Barry Larkin
175.9 … Al Kaline
178.4 … Carl Yaz
184.4 … Bobby Grich
187.7 … Reggie Jackson
190.7 … Rod Carew
197.9 … Gary Carter
199.6 … Edgar Martinez
201.9 … Alan Trammell
212.3 … Kenny Lofton
213.0 … Roberto Clemente
213.3 … Ryne Sandberg
216.2 … Ron Santo
219.3 … Duke Snider
219.6 … Frank Thomas
224.1 … Willie McCovey
225.3 … Tim Raines
231.1 … Craig Biggio
232.9 … Lou Whitaker
233.0 … Yogi Berra
240.1 … Ozzie Smith
241.1 … Tony Gwynn
245.5 … Luke Appling
246.6 … Paul Molitor
246.8 … Joe Cronin
250.5 … Eddie Murray
251.2 … Pee Wee Reese
251.5 … Brooks Robinson
257.1 … Roberto Alomar
257.2 … Robin Yount
257.6 … Ernie Banks
264.0 … Carlton Fisk
264.8 … Pete Rose
268.7 … Derek Jeter
270.8 … Harmon Killebrew
282.1 … Joe Medwick
314.6 … Dave Winfield
PaWaa 9000
79.4 … Babe Ruth
94.9 … Rogers Hornsby
97.0 … Ted Williams
98.3 … Willie Mays
109.2 … Honus Wagner
110.3 … Ty Cobb
110.7 … Barry Bonds
115.7 … Mickey Mantle
116.4 … Lou Gehrig
123.4 … Tris Speaker
123.9 … Stan Musial
126.1 … Mike Schmidt
128.9 … Alex Rod
131.2 … Hank Aaron
132.0 … Rickey Henderson
134.5 … Albert Pujols
140.6 … Jimmie Foxx
151.5 … Mel Ott
156.0 … Eddie Mathews
157.7 … Wade Boggs
158.0 … Frank Robinson
158.8 … Joe Morgan
170.0 … George Brett
171.5 … Ken Griffey
173.9 … Cal Ripken
173.9 … Al Kaline
179.7 … Jeff Bagwell
187.6 … Carl Yaz
192.6 … Roberto Clemente
195.9 … Rod Carew
207.0 … Reggie Jackson
212.7 … Alan Trammell
214.6 … Barry Larkin
225.6 … Ron Santo
226.6 … Gary Carter
227.4 … Ryne Sandberg
229.1 … Frank Thomas
230.1 … Lou Whitaker
232.5 … Ozzie Smith
241.4 … Roberto Alomar
241.8 … Luke Appling
241.8 … Kenny Lofton
247.8 … Paul Molitor
250.8 … Carlton Fisk
252.2 … Tony Gwynn
252.9 … Brooks Robinson
253.6 … Willie McCovey
255.9 … Tim Raines
263.3 … Robin Yount
266.3 … Pete Rose
268.4 … Eddie Murray
269.2 … Pee Wee Reese
272.8 … Craig Biggio
275.1 … Ernie Banks
293.0 … Harmon Killebrew
294.3 … Derek Jeter
342.4 … Dave Winfield
PaWaa 10,000
82.0 … Babe Ruth
101.6 … Willie Mays
106.0 … Barry Bonds
112.4 … Honus Wagner
112.7 … Ty Cobb
115.7 … Mickey Mantle (9907)
125.5 … Tris Speaker
129.3 … Stan Musial
132.4 … Hank Aaron
136.6 … Alex Rod
137.3 … Mike Schmidt
137.9 … Rickey Henderson
156.5 … Mel Ott
165.3 … Frank Robinson
168.4 … Joe Morgan
169.0 … Wade Boggs
171.4 … Eddie Mathews
174.7 … George Brett
180.2 … Al Kaline
183.8 … Roberto Clemente
187.8 … Cal Ripken
198.2 … Carl Yaz
202.9 … Ken Griffey
213.0 … Rod Carew
234.5 … Lou Whitaker (9967)
239.8 … Ozzie Smith
241.3 … Luke Appling
253.2 … Pete Rose
257.0 … Frank Thomas
257.9 … Robin Yount
261.2 … Brooks Robinson
264.2 … Reggie Jackson
269.1 … Paul Molitor
275.7 … Tony Gwynn
279.5 … Derek Jeter
280.7 … Carlton Fisk (9853)
281.7 … Tim Raines
288.8 … Craig Biggio
294.1 … Eddie Murray
303.9 … Roberto Alomar
329.7 … Ernie Banks
357.3 … Dave Winfield
PaWaa 11,000
99.8 … Barry Bonds
106.0 … Willie Mays
119.7 … Honus Wagner
120.1 … Ty Cobb
128.3 … Tris Speaker
133.2 … Hank Aaron
140.1 … Stan Musial
144.0 … Alex Rod
153.6 … Rickey Henderson
155.3 … Mel Ott
172.9 … Joe Morgan
173.0 … Frank Robinson
193.7 … Al Kaline
202.5 … Cal Ripken
208.5 … Carl Yaz
208.6 … George Brett
234.7 … Ken Griffey
264.7 … Brooks Robinson
267.0 … Pete Rose
278.1 … Paul Molitor
297.0 … Robin Yount
300.9 … Reggie Jackson
317.2 … Craig Biggio
332.0 … Derek Jeter
345.3 … Eddie Murray
402.3 … Dave Winfield
PaWaa 12,000
99.8 … Barry Bonds
108.6 … Willie Mays
122.3 … Ty Cobb
134.7 … Hank Aaron
135.8 … Tris Speaker (11992)
147.7 … Stan Musial
170.0 … Rickey Henderson
217.1 … Cal Ripken
230.3 … Carl Yaz
288.3 … Pete Rose
328.0 … Paul Molitor
331.0 … Robin Yount
368.8 … Craig Biggio
369.4 … Derek Jeter
385.7 … Eddie Murray
454.2 … Dave Winfield
PaWaa 13,000
128.5 … Ty Cobb
137.8 … Hank Aaron
189.0 … Rickey Henderson
251.6 … Carl Yaz
327.5 … Pete Rose
PaWaa 14,000
150.7 … Hank Aaron (13941)
280.4 … Carl Yaz (13992)
391.7 … Pete Rose
PaWaa 15,000
478.3 … Pete Rose
Voomo:
A Herculean accomplishment. And the result shows players from all eras sprinkled through the ascending ratings.
If you tried this with pitchers, it would not be so. Owing to the current trend of pulling starters in the sixth inning more or less, the figures skew in their favor dramatically, at least in a simpler formation of pWAR/ IP. Dead ball era pitchers also have an advantage.
In other words, your version for position players is useful as a means to evaluate players across eras, but I think that if you would apply it to pitchers, you would find that dead ball and recent pitchers hold most of the top positions.
This brings me to the point: WAR was originally designed, I think, for batting stats. The pitching and fielding applications came later, and instead of developing new ways of looking at entirely different sets of raw stats that would account for cross-era shifts, the developers adapted the formulas they had.
Bob Eno, will probably disagree.
Of course I disagree! . . . But I need a while to figure out some basis for it. I just hope the reason you expected me to wasn’t because of my comic distortion of your term “nuance” to try to spice up repeating my same old arguments for Bobbly Wallace. We should absolutely go beyond single-stat reductions and look at complexes of skills and contexts. I wasn’t making fun of you, I was making fun of how much I’ve been repeating myself (and to such little effect!).
I was once on top of what WAR crunched but those days are long gone. It seems to me that the specific adaptation to pitching was justified by assessment of the weights given to its various components together with the empirical fact that the pitching/position player numbers lined up pretty well intuitively. But pWAR and bWAR are different things, and we used to make that distinction in CoG discussions–we’d routinely look at separate lists for position players and pitchers when the WAR figures were listed. (When I put Wallace on those lists, I always extracted his pitching years and added an asterisk.)
Within traditional roles, I don’t think there’s really anything that undermines WAR when it comes to cross-era comparisons because all the components are relative to the individual seasons in which they were compiled. WAR measures relative to the context of the season for all seasons, so I can argue that Bobby Wallace is better than Willie Randolph, even though Randolph would objectively make Wallace look like a high schooler if both were 25 today.
But the specific point you make about six-inning starters belongs to a different category–the one that makes WAR so unsuited to relief pitchers. The quantity element of the WAR components does depend on having a common general expectation, and while the PA/bWAR may work for position players, the IP/pWAR/ doesn’t work because of the intensity of pitching and exaggerated effects of ordinary fatigue. Within a single season, this is why pWAR can’t cross the starter/reliever divide, and I think you’re right that it will present a distorted view across eras because starters will have much lower quantity within components and will have elevated quality factors because the parameters of fatigue have changed.
I’m not sure, however, that deadball era starters actually have an advantage in pWAR. I’d want to check it out. As a quick test I did a Matty/Maddux comparison, and found that Mathewson and Maddux–two pitchers who seem fairly comparable, but in radically different eras–have identical IP/pWAR: 5.31. (Snell, btw, comes in very close at 5.22.)
Bob:
Your screed on Wallace had nothing to do with my closing remark. We’d sparred about WAR applications in the long ago past, so I took a preemptive shot, rather than waiting.
PART ONE
Ed Lopat versus Johan Santana: Both were successful playing for good teams. Lopat was successful playing for some bad White Sox teams before going to the Yanks, and Santana was successful for some bad Mets teams after leaving the Twins.
IP 2439—2025
W 166—139
L 112-78
ERA 3.21—3.20
ERA+ 116—136
GS 318—284
CG 164—15
H/9 9.1—7.7
HR/9 0.7—1.0
SO% 8.4—24.1
BB% 6.4—6.9
pWAR/ IP: .0116—.0251
Question: Santana was better, true, but if he was more than twice as good, why doesn’t his W/L record show it? Or could it be that throwing complete games using junkballs and letting the fielders have a little say works well too? If so, then the ideal 81-pitch, 27 strikeout game may not be the only option. What about the 27-pitch, twenty-seven putout game as an alternative ideal?
PART TWO
Here are all the 2000+ IP starters I could find who spent the majority of the careers pitching in the 1950s. I may have overlooked one or two. The figure after each name is pWAR/innings pitched.
R. Roberts .0177
W. Spahn .0176
W. Ford .0169
B. Pierce .0162
N. Garver .0157
J. Antonelli .0157 (1992 IP)
M. Dickson .0152
M. Garcia .0141
F. Lary .0136
H. Haddix .0134
D Newcombe .0134
B.Lemon .0132
B. Friend .0130
C. Simmons .0128
E Wynn .0113
V. Law .0098
L. Burdette .0083
For contrast, here is a list of starters, basically from the 1990s through 2023, some still active, almost all with 2000+ innings. Again, the figure after each name is pWAR/ innings pitched.
Verlander .0245
Kershaw .0284
Scherzer .0265
Greinke .0214
Degrom .0310 (1356 IP and probably not many more, I suspect.)
Hamels .0215
Halladay .0238
Santana .0251
Clemens .0282
Maddox .0209
R. Johnson .0250
P. Martinez .0305
Mussina .0232
Schilling .0247
Brown .0209
Pettitte .0183
Glavine .0167
Moyer .0123
What bunch of losers those earlier guys must have been.
A continuation of the above:
PART THREE
Dead ball circa 1890-1919
C. Young .0225
K. Nichols .0229
C. Mathewson .0209
E. Plank .0195
R. Waddell .0206
J. Mcginnity .0180
A. Joss .0205
M. Brown .0180
E. Walsh .0215
W. Johnson .0258
G. Alexander .0224 (Half dead ball, half live ball)
Live ball circa 1920-1950 notables
U. Shocker .0205
D. Vance .0212
L. Grove .0287
D. Dean .0223 (1967 IP)
H. Brecheen .0217 (1907 IP)
C. Hubbell .0192
H. Newhouser .0201
R Faber .0156
T. Lyons .0161
L. Gomez .0173
B. Feller .0170
R. Ruffing .0127
W. Ferrell .0186
W. Hoyt ,0144
T Bridges .0183
B. Newsom ,0136
M. Harder .0142
B. Grimes .0112
B. Shawkey .0159
H. Pennock .0125
D. Luque .0136
C. Passeau .0160
B. Walters .0150
D. Trout ,0166
M. Cooper .0173 (1841 IP)
F. Fitzsimmons .0104
L. Warneke .0151
Remarks: Shocker, Dean, and Brecheen had short careers, Brecheen’s and Newhouser’s figures are boosted by WWII. Lefty Grove and Dazzy Vance are the only enduring pitchers of the era who best the .0200 mark, and Vance was something of an anomaly.
PART FOUR
The 1960s through the 1980s produced far too many pitchers with 2000+ innings to list them all here, so you’ll have to trust my judgment about inclusions and exclusions. No one who has a really high WAR/ IP rating will be left omitted. There are so few.
Seaver .0222
Koufax .0228
Gibson .0210
Blyleven .0199
Stieb .0195
Reuschel .0192
Jenkins .0183
Tiant .0188
P. Niekro .0179
Drysdale .0178
Marichal .0176
G. Perry .0174
McDowell .0173
Palmer .0171
Gooden .0171
Viola .0166
Carlton .0161
L. Jackson .0161
Bunning .0160
Ryan .0155
Koosman .0148
Pappas .0145
Tanana .0136
John .0135
Blue .0134
Lolich .0132
Sutton .0129
Pascual .0128
Valenzuela .0127
J. Perry .0117
Morris .0114
Hunter .0107
Osteen .0106
Kaat .0100
Reuss .0089
J. Niekro .0080
TO SUM UP
Pitchers with over .0200 WAR/IP:
8 Dead Ball Era plus Alexander
6 Live Ball Era through 1950s
3 Live Ball Era 1960s through 1980s
15 1990s to date
Too much work. Does anyone care? Only if you want to put a big question mark against the credibility of pitching WAR’s ability to compare eras.
Anyway, I’m done. Rip this if you will. I won’t reply.
No rip! This is great work, nsb.
Here’s a first reaction: It appears from this analysis that the reason starter pWAR is distributed unevenly across eras may be, in part, because of shifts in the distribution of activity on the diamond. That is, in certain eras, because of the style of play, pitchers shoulder more of the work, and thus FIP grabs a larger share of the statistical credit.
You essentially made this point in your Lopat/Santana contrast (what a well chosen match-up!). When Lopat spreads the work among fielders it may yield the same number of wins, but the fielders are gobbling up WAR with each play. Santana is keeping it all on his plate.
So I think your argument does indeed effectively challenge mine that pWAR is relative to season contexts and so can be fairly compared between eras. You get the win!
But . . . (of course) . . .there’s a tension in that unfairness too. The 81-strike perfect pitcher exercises near-complete control over the action on the field, while the 27-pitch perfect pitcher surrenders control to both the fielders and to the batters’ batted balls. It’s also fair to have the pWAR follow skill-exercised control.
Here’s another way to look at it. It seems to me that (excluding career-end seasons) Lopat was pretty regularly about .050 ahead of his teams in W-L Pct.–his W-L was mediocre when his ChiSox teams were bad and were good with the Yankees. Santana was well over .100 ahead of his teams when they were mediocre or good. We don’t give much weight to W-L anymore, but I think you can see here the difference in credit when a good pitcher takes on more control.
I’ll look for more time to pursue this further–you’ve crunched more than a century of stats to explore–but, as always, your point and your evidence are very good.
Using Voomo’s formula for the position players on the current ballot, this is what I get:
192.2 Utley (7839)
193.6 Rolen (8518)
222.3 Allen (7315)
262.1 Randolph (9461)
272.5 Minoso (7712 – MLB only; 290.9 [8232] total)
275.2 Wallace (9631)
283.9 Helton (9453)
307.1 Guerrero (9059)
421.0 Sheffield (10947)
499.6 Ortiz (10091)
509.7 Simmons (9685)
I also tried to level the playing field and ran the figures using Utley’s PA total as a base. I looked for the season cutoff closest to 7839 PA and calculated the number:
180.0 Rolen (7919)
192.2 Utley [7839]
216.9 Helton (7764)
222.3 Allen [7315]
225.4 Wallace (7799)
244.6 Guerrero (7826)
250.3 Randolph (7534)
272.5 Minoso [7712]
302.6 Simmons (7444)
333.4 Sheffield (8035)
525.4 Ortiz (8249)
(Sheffield and Ortiz’s figures improved by choosing the higher of two PA figures.)
Question #11: Not sure if he is first, but one of the three pitchers ahead of Rodríguez is Camilo Pascual, whose ERA+ improved 48 points from his first three seasons to his next three (72 to 120).
Not Pascual. Someone much more recent.
Hint is he logged a bit more than half of Pascual’s innings and earned a bit more than half of Pascual’s WAR. Their career IP to WAR ratios are within 2% of each other.
Another pitcher ahead of Rodriguez, but not first, is Bill Swift who went from 86 to 132 for 46 points of improvement.
I had considered this pitcher previously but apparently neglected to check his numbers: Jake Arrieta improved dramatically upon joining the Cubs once the Orioles traded him after 3-1/2 seasons. His ERA+ went from 79 in seasons 1-3 to 152 over the next three campaigns.
Arrieta is correct. His 12-year career broken down into 3 year chunks looks like this:
Year 1-3, 79 ERA+
4-6, 152
7-9, 120
10-12, 77
So, a 30+ point change in ERA+ each time. Likely very few (if any) similar careers.
My vote:
Main: Utley, Tiant, Wallace
Secondary: Ashburn, Dawson, Jones
I was surprised by how high Utley was ranked in Hall of Stats so, since he is on the bubble, will give him some support.
On the secondary, I’ve chosen three excellent centerfielders, two with a career value case, and one based more on peak value. Possibly one of the three belongs in the CoG.
As it stands now, there are 7 players tied for the lead, but with only two votes. Rather than a 7-way runoff, I’m going to extend the election for another week in the hope that we will get a few more voters to weigh in.
Previously cast ballots may now be changed up until this coming Friday. Note also the addition of Brandon Webb to the ballot, whom I had missed in preparing the post. Thanks to Opal for pointing out this omission.
Doug, as the site admin, do you have access to all the emails of folks who have voted over the years?
And if so, it it in integrity to message everybody that we are having an active vote? We dont have a “subscription” option on this site.
I have some Admin rights. but Andy is the ultimate site admin.
I do have access to comments, over 80,000 of them going back to 2012. But no easy way to extract them to strip off the e-mail addresses.
But, I’ll see what I can do.
Wow. Say hi to Andy! It’s been a long time.
Main: Allen, Rolen, Simmons
Secondary: Williams, Coveleski, Reggie Smith
Since we’ve got some extra time, I thought I’d do a version of something I used to do back in the day and list all of our candidates—on both lists—according to a formulation that’s a little different from usual. In this case, for position players, the candidates are listed according to PA/WAR (productivity)—lower numbers better, as in Voomo’s PA/WAA—and their career magnitude, expressed as “Irvins”—that is, their total PAs expressed as a multiple of Monte Irvin’s total PAs, the lowest magnitude on the list (this includes all of his PAs, including his ten Negro League seasons, but because the Negro League stats are very incomplete, those ten years comprise less than 30% of his total PAs).
Here’s the position player list:
PA/WAR…Irvins
110………1.0…Irvin*
121………2.4…Rolen
122………2.2…Utley
125………2.1…Allen
125………2.3…Smith*
132………2.3…Boyer*
133………2.0…Minoso
133………2.7…Wallace
138………2.5…Jones*
144………2.7…Randolph
151………2.8…Ashburn*
153………2.6…Guerrero
153………2.7…Helton
165………3.0…Williams*
166………3.1…Dawson*
167………2.9…Abreu*
181………3.1…Sheffield
182………2.9…Ortiz
193………2.7…Simmons
The asterisks are for Secondary Ballot candidates. I think it’s interesting that there’s really no clear division between members of the two ballots. That goes for straight WAR too. If you set aside Irvin, whose stats are very incomplete so his WAR is artificially low, then the lowest-WAR Secondary candidate (Abreu) has a higher WAR total than five of the primary ballot candidates (in descending order, Guerrero, Allen, Ortiz, Minoso, and Simmons), with Sheff just edging Abreu out. And on the Primary ballot, only three candidates top Drysdale’s WAR: Wallace, Lyons, and Rolen.
Note that Minoso, like Irvin, has Negro League seasons (three, in his case), plus a break as he moved into MLB that took productivity away during his peak period, so, like Irvin, he’s working with a handicap, but still doing ok. For Wallace, I need to note that I removed the PAs for his three pitching years, since we don’t measure pitcher careers in PAs (those years show up below), which works in Wallace’s favor, but I retained his bWAR for those seasons, which was -1.2, which works against him. Wallace also appears with the pitchers below.
Here are the pitchers, with career magnitude expressed in terms of Johans.
IP/WAR…Johans
39………1.0…Santana (newly eligible)
50………1.5…Coveleski*
51………1.7…Drysdale*
53………1.7…Tiant
59………2.1…Lyons
67………0.2…Wallace
79………2.6…Sutton*
You can really see the trade-off between career magnitude and productivity with Johan, and the contrast with Sutton is particularly stark. It’s pretty striking to me that Wallace, who was ordinary enough to be moved to the field, looks ok next to Sutton, who’s in the Hall. If you threw in Wallace’s pWAR with his bWAR and added back in the PAs for his three pitching years, his career length would still be 2.7 Irvins, but his productivity would improve from 133 to 126. (I am, of course, always shilling for Wallace! His productivity/magnitude figures seem to stand out if you look at his total figures.)
I think the most noteworthy thing about looking at candidates this way is how arbitrary our Primary/Secondary ballot distinctions appear. This where we might want to take up nsb’s theme of nuance. Can we state clearly why it would be that, say, we have Drysdale on the secondary list and Tiant on the primary? Or, more obviously, why we have Sheffield, Ortiz, and Simmons on the primary ballot while Irvin, Smith, and Boyer are not—Smith, in fact, is tipping towards oblivion. There must be reasons beyond the stats, and if we could state them, we could assess whether or not they’re valid.
With this in mind, I’m going to cast a Secondary Ballot vote:
Irvin, Jones, Smith
Just to augment your pitcher list to include Brandon Webb, nearly as efficient as Johnan in WAR production.
39………1.0…Santana (newly eligible)
42……..0.7…Webb (newly eligible)
50………1.5…Coveleski*
51………1.7…Drysdale*
53………1.7…Tiant
59………2.1…Lyons
67………0.2…Wallace
79………2.6…Sutton*
Webb accumulated all of his positive WAR through his age 29 season (and all of his WAR, period, before his 30th birthday). He and Santana are two of only 10 modern era pitchers with IP per WAR as low as Webb’s in 1000+ IP through their age 29 seasons.
30…..Pedro
32…..Clemens
33…..Kershaw
35…..Sale
35…..Walter Johnson
36…..Santana
37…..Appier
37…..Seaver
38…..Oswalt
40…..Webb
Seaver and, especially, Johnson stand out as pitchers with low IP per WAR ratios, despite pitching longer into games than the rest of the pitchers on the list.
FWIW, Bill Foster checks in just behind Pedro, with 31 IP per WAR. Foster compiled 39.2 WAR in 1234 IP over ten Negro League seasons (1923-33), completing 108 of his 136 starts.
Thanks, Doug. Didn’t think to add him.
The super-efficient pitchers are top relievers:
23……..0.6…Mariano
33……..0.4…Wagner (not Honus)
One more chance for Wagner with the BBWAA, after two ballots north of 65%, including an ever so close 73.8% this year.
Only two “modern” relievers (i.e. primarily 9th inning only relievers, so careers since ~1990) in the Hall, so Hoffman is obviously the minimum Hall benchmark. He and Wagner had virtually the same WAR, but Hoffman logged 20% more IP and 42% more saves, so definitely has prettier numbers. Still, seems like there ought to be a place for a left-handed closer, who could put up comparable numbers to the best righties, despite a more challenging platoon environment.
While I have some time, I’m going to point out something that Bob Eno, for all his enthusiasm about Bobby Wallace, has somehow not exactly downplayed, but mentioned only in passing. Wallace was a darn good hitter for his era. His 56.8 Batting WAR in the dead ball era is a commendable in ways we may not really grasp now, or not easily. He was anything but a power hitter, and was middling at best at working the pitcher for a walk. Nevertheless he had 6 top-10 finishes in the offensive WAR category and 8 top-10 finishes in RBIs. Hitting in the clutch has been downplayed by the statistical wizards, and RBIs belittled as a function of batting order position, but I at least am still impressed by the fact that he led his own teams in RBIs nine times in an era, at least after 1901, when runs didn’t grow on trees like bananas.
He produced runs when they were scarce, he prevented runs to make them scarcer for his team’s opponents, and he did these things laboring in obscurity for the better part of his career.
He may not stand head and shoulders above the other candidates on this particular ballot, but he’s at least a couple of inches taller. That’s a metaphor, guys.
To your point, for the 16 years he played regularly (1897-1912), Wallace ranked 4th in oWAR, 3rd in WAR and 2nd in dWAR. So, not just a defensive wizard. Here’s the list.
I generally don’t vote, preferring to be a commentator, although I did vote once in order to break a senseless impending tie.
That being said, I would like to vote for Wallace. Problem: the rules require a ballot of three choices, and I don’t have strong positive opinions about anyone else listed. Negative opinions, several: Simmons, Ortiz and all of the first timers except Santana. Sentimentally, I’d love to vote for Minoso, but I can’t see him as being any better than his contemporary Larry Doby, who isn’t even on the secondary ballot. I would vote for Ashburn, Irvin, or Smith, but they’re not on the primary ballot. Thus, against my principles, a strategic vote:
Primary ballot:
Wallace
Allen
Rolen
Secondary ballot:
Ashburn
Irvin
Smith
I remember that previous departure from form, nsb, and I appreciate the vote for Wallace.
I hadn’t registered that Doby was now absent. I’d like to propose a particular form of a Redemption Round that would apply to him.
B-Ref has now incorporated Negro League stats with MLB ones (I don’t know how Stathead and FanGraphs handle this, cause my stat nerd days are over). The Negro League stats don’t represent full value because the records are only partial, but that may be ok because we don’t have clear measures of quality for Negro Leagues either. When we initially assessed players like Irvin, Minoso, and Doby, their stats were MLB-only and the case for them relied in part on the valid but very general argument that we weren’t seeing their full career accomplishments. Now their figures for WAR, etc., have changed. Doby’s WAR, for example, has risen from 49.2 to 56.8–still probably an underestimate, but you can now see how Doby belongs on the candidate list straight out. His WAR is higher than Ortiz or Simmons (and Minoso’s), and his PA/WAR matches Rolen’s.
So perhaps a round to reexamine the leading transitional Negro League/MLB players is in order.
Looking at this question when the Negro League stats first started showing up on B-R, I was surprised how few transitional players there really were who had any appreciable amount of WAR in both the Negro leagues and the major leagues. Perhaps those WAR totals have fleshed out a bit more for the former, but I expect it will still be a pretty short list.
Yeah, after doing a check I see you’re right. Some guys I thought might do well didn’t have the MLB minimum for the Circle, and the Negro League WAR numbers are partial enough that they can only supplement a case. Paige and Campanella benefit a lot, but they’re already in. Irvin and Doby are the only ones I found where the numbers really make a difference for a qualifying player. Jim Gilliam might have, but his Negro League records are too fragmentary. (Maybe Hank Thompson.)
Anyway, Doby’s case for redemption is still strengthened by the new numbers.
Is #13 Clay Kershaw? He had a non-qualified season to start his career of 98 ERA+ and then reeled off seven in a row at a 162 clip
It looks like it’s Mordecai Brown.
My mistake. I took “modern era” to be post-deadball (1920-present) – as opposed to 1900-present.
Brown is correct. He extended that streak beginning his career to 8 straight qualified seasons (1903-10) with 125 ERA+.
One more quiz question on the board, concerning Dan Johnson. Not surprised it’s the last question, since this player’s career was so inconsequential it seems a miracle he lasted 10 seasons, especially since the last six were in his 30s.
Johnson’s counting stats are underwhelming, as would be expected from a career of fewer than 500 games and 1500 AB. But he does seem to have had a few valuable skills, with a career 13% walk rate and 4% (of AB) homer rate, the latter translating into a blast every week to 10 days if he were playing everyday. He also struck out less than a lot of players from the recent past, with a 15% (of PA) whiff rate. Johnson also had a propensity for delivering sac flies, one of only 9 retired players with SF numbering more than 1.5% of AB in a 1000+ PA career. Altogether, works out to a 99 OPS+, so maybe the question should be not how he lasted so long, but, rather, why he played so little?
Ralph Houk spent 7 consecutive seasons with the Yankees with fewer than 30 games played and he had 6 consecutive seasons with fewer than 10 games played.
Funny, the first guy I checked was Charlie Silvera. Charlie got some WS $$ 1949-1953
During Silvera’s tenure with the Yankees (1948-1956) his career BA was .291. The only AL catcher with a higher BA with at least 400 plate appearances was Yogi with .294.
For the record, the answer to question 14 is Russ Morman, with 8 straight seasons of 40 or fewer games, including one or more at 1B. Morman played from 1986 to 1997, for the White Sox, Royals and Marlins.
15 years at AAA. Over 5,000 PA. .302 / .376 / .495 / .871
Morman must have wondered what coulda been had he been given the chance.
He was blocked in Chicago by a rapidly declining Greg Walker, blocked in KC by the tail end of Brett, then continued to mash at AAA, but even the expansion Marlins didnt see investing time into a mid-30s journeyman…
Main: Wallace, Randolph, Santana.
Secondary: Ashburn, Coveleski, Irvin.
It looks to me as though Wallace has entered the Circle and we’ve likely completed our work with regard to the Deadball Era.
Perhaps we’re through.
There are still a few players from the dead ball era that could perhaps be considered in our next redemption round. See the lists below:
Everyday players
Pitchers
Half a dozen guys on those lists with as much argument as most of our current group.
I agree, Voomo. I somehow had a comment deleted just now, but the gist was that although there are viable candidates on Doug’s list, the nature of the conversation here has changed. It used to be that the old-time players came to our attention in the context of their birth-year pool. Wallace came up when HHS was focused, round after round, on late 19th century / early 20th century players, so Wallace’s career had context.
And conversation was much more detailed then. I went back to look at the 1873 round when Wallace appeared, that was in 2015. You were first to comment on him, and the reply from one poster was, “Despite my best efforts, I can’t get too excited about Wallace. Basically, I can’t see where all that WAR is coming from. I’m going wait to vote, but I think I’m going to move on from Wallace.” But Doug began advocating for Wallace as a viable candidate and as the conversation went on and on, Wallace’s credentials kept coming under examination (along with others’) — by the end that skeptic wound up voting for Wallace! (Who was that, now? Someone with the ridiculous handle e pluribus munu. . . . Wonder what became of him.)
Wallace gained more rounds by staying in the conversation while the obvious deadball stars moved into the Circle, but then he began to lose ground (like Luis). I’m pretty sure Wallace would have disappeared amidst the light discussion of recent rounds if I hadn’t made a complete pest of myself pushing him forward until four old-timers here shoved him across the finish line. To get a deadball era star in the running from a standing start now would take an even bigger pest, and I’m not sure anyone can outdo me in that category.
I’m kind of lukewarm about the prospect of an additional number of, at best, borderline names on the COG candidate role. Fred Clarke is actually a superior candidate to any we now have, according to YT, but otherwise . . . ?
In its inception, the COG was supposed to be more selective than the HOF. That’s one point. A well-known weaker one—but I’m mentioning it anyway—is that the HOF has done a miserable job in its selection, which irks the heck out of me.
This is no solution, but I’m going to name the players currently in neither Circle nor Hall whom I think belong in Cooperstown, at least, whether they pass the COG test or not, and I invite anyone else to make their own suggestions.
Sherry Magee
Wally Schang
Urban Shocker
Ken Boyer
Dick Allen
Luis Tiant
Reggie Smith
Dwight Evans
Keith Hernandez
Thurman Munson
Rick Reuschel
Interestingly enough, the careers of the last seven overlap. What does that say about the blindness of the baseball writers to the players of the 1970s and 1980s?
To respond to your last question, nsb, and granting your premise that all of these players deserve to be in the Hall (which is reasonable), I wonder whether a contributing reason is the growth in the overall size of the player pool. In 1960 there were 16 teams; by 1978 there were 28. That’s a pretty sudden increase of ~75% in the number of regulars playing. I think Hall judgments are, in practice, about both absolute and relative quality, and the relative elements kept many BBWAA voters from expanding their ballots towards the full ten available slots. It’s only recently (in the 30-team era) that we’ve had frequent years with 3-4 inductees, and the players you list have long been off the ballot.
Bob,
Not to be that guy but, the NL didn’t expand to 14 teams until FLA and COLO were brought in 1993….. I can’t disagree with NSB’s picks. Just wondering if Boyer is on the list if Allen (or Callison) wins the NL MVP award as a rookie in 1964 in lieu of Ken. You know, if Mauch doesn’t panic and pitch Bunning and Short every other day, the Phillies probably take the pennant and Kenny finishes behind Callison or Allen. Also, without the advanced defensive metrics we have today, is Hernandez considered a Hall of Famer by the balloteers when he was immediately eligible? – kind of hits for average, great fielder by the eye test, takes a walk, played on good teams but, did he hit enough (w/o the fielding metrics)? BTST, Allen’s offensive prowess is really brought to light by all the ‘exotic’ stats but who knew he was that great a hitter 40 years ago when first eligible? Not to say they were going to ignore his ‘foibles’….
Right, Paul. I was moving fast and my mind is slow. So a ~62.5% increase.
My girlfriend in ’64 was from Philly. Man, that was painful! In the losing streak Callison batted .275 and Allen .415, but Callison surely did lose to Boyer because of the streak. (The entire MVP vote looks awful, though, as MVP votes sometimes do. You may not like WAR, but the fact that Mays had almost twice the WAR of both Boyer and Callison, the 1-2 finishers, says a lot.)
Yes, Callison (20) and Boyer (22) had about 40% of the Rbat of Mays (53), Allen (52), and Santo (52). You really gotta believe in the power of the glove to justify Boyer and Callison as 1-2 in the MVP voting. Like, was Boyer getting to 6 batted balls/9 innings? hahaha. Did Callison throw out 40 baserunners? They were both great fielders but, obviously, pennant standings and RBI won the prize
Yup. Boyer was particularly known for his fielding. It surely made a difference in the voting. As it happens, both Boyer at third and Callison in right had 1.0 dWAR that year. Fine figures. Mays’s dWAR in center that year was 2.0 (but who’s counting?).
Basically, Mays won two MVPs instead of ten because his consistency blinded voters. If Mays had had some bad years to highlight his good ones he’d have won more. He led the Majors in WAR eight times, and six of those were with >10.0.
same deal with Mantle. Best player in the AL from about 1954 – 1964 and won 3 MVP’s. Mays definitely should have won in 1962 but sportwriters were thrilled with Wills stealing bases
Well . . . Mantle was terrific. But he had a total of 5 seasons above 7.0 WAR (1955-61) to Mays’s 13 (1954-66), and Mantle led the AL 6 times while Mays led the Majors 8 times (with 2 more in just the NL). Yet Mantle out MVP’d Mays.
The BBWAA ignored one of Mantle’s >10.0 WAR seasons because Maris hit 61 HRs, just as Wills’ 104 SB season put Mays’s >10.0 WAR in the shade. But the writers passed Mays by for three other such seasons (all Majors-leading).
Here’s a fun fact I just discovered. Mays finally won his second MVP in 1965, the year after Boyer and Callison outpaced him with 6.1 WAR each to Mays’s 11.2. In ’65, Mays was about the same level (11.0) and so was Callison (6.1 again), but Mays won while Callison came in tied for 24th with Lou Johnson (2.4 WAR).
I think we may have already had the Mantle vs. Mays discussion a few years back. IIRC, I believe the Runs Created per 27 Outs Made favored Mantle to such an extent that you may have been incredulous? A team of Mantles versus Willies? On another note, Mantle has three seasons of oRAR of 108 or greater; Mays has zero greater than 90….But, alas, Mays had the good fortune of never being seriously injured. Mantle’s injuries were legendary
You may be right, Paul. I don’t recall (correctly or incorrectly), but it sounds like me. And it’s absolutely true that the endurance of Mantle’s dominance was limited by his injuries. Mays stayed healthy (alas?–I was a Brooklyn fan and I was glad to admire Mays), although he lost more than a season and a half to military service.
But I don’t think the comparison holds up in the context of the MVP discussion. MVPs are about total contribution, not hitting alone. Mantle was a below average center fielder with only five seasons of positive dWAR and never above 1.1; Mays was terrific, with four seasons above 2.0.
Moreover, Mantle was rewarded for his three 100+ oRAR seasons with two MVPs (Maris bumping him in ’61), as well he should have been. When you leave those three seasons, his top oRAR figures were 90, 83, 76 (MVP), and 67. Mays never tops 89, but he also has six other seasons in the 80s and four in the 70s, with eight of those eleven total seasons adding 1.1-2.1 in dWAR.
Bottom line: From 1954-66, thirteen seasons, Mantle and Mays led the Majors in WAR every year but one: Mays 8 times and Mantle 4 (1955-57 and 1961). Mays received two MVPs and Mantle three. In 1959, Ernie Banks broke the duopoly–the only other person to lead the Majors in WAR over that span. He wound up with two MVPs, same as Mays.
Replying to my own message because one point really has been bothering me. I wrote, “Mantle was a below average center fielder . . .” Mantle’s Rfield and dWAR numbers are negative, even if you isolate his peak career (1952-64). He places in the top-ten in Total Zone runs for OF only once–5th in 1955–while Mays is a perennial top-five, second lifetime in CF to Andrew Jones (Mantle isn’t on the top-400 list).
But here’s the thing: I saw Mantle play dozens of times and he was terrific in center field. When I report that he was a below-average fielder it feels like I’m lying to win an argument.
For this reason, I have a hard time buying into defensive arguments for old time players based upon the advanced numbers we have, which are mostly based on total chances, total put outs.
These involve some factors beyond the player’s control.
I trust Bob’s eye test more than DRS.
Yeah, but then I lose the argument!
I’ve worn glasses since I was eight. Maybe that was actually Bauer. The sun was in my eyes.
The problem I have with the current fielding metrics is the fact that someone is watching somewhere deciding whether that ball that Alec Bohm didn’t get to is a ball that Chapman or Austin Riled field cleanly. It just seems a little too subjective to me.
On the other hand, Runs Created or Offensive Winning Percentage (and most of the offensive stats) seem like pretty clear-cut, verifiable, makes-sense kind of calculations.
If you took the worst fielders at each position with over 7,000 career plate appearances and they played the best fielders at each position with a neutral pitching staff, how many games would a team with the likes of Frank Howard (LF), Dick Allen (3B), Prince Fielder (1B) win versus Brooks Robinson, Ozzie Smith, Bill Mazeroski, etc…over the course of 162 games (playing against each other)?
I just don’t think bad fielders who hit the ball well hurt a team as bad as great fielders who can’t hit
I think this is intuitively obvious, Paul, but not necessarily correct. Towards the end of my immersion in stats (probably around early 2019) I became very interested in the value of fielding that contemporary stats seemed to reveal. I was on this site pushing out stuff I was reading in annual editions of The Fielding Bible (which I gather has since become a fully web-based entity). The methodologies were rapidly advancing with statcast replacing more subjective measures.
While we can’t read back what these measures do when applied to the bare stats of historical players, what they do illustrate is the value balance between offensive and defensive skills, and I became convinced that fielding skills were highly undervalued. I’m going to take a quick shot at making the case by some ad hoc thought experiments, rather than by trying to envision a valid methodology and work through it.
Here’s thought experiment #1. Compare Ozzie Smith and Derek Jeter, a great shortstop/poor hitter and a below average shortstop/excellent hitter. As a hitter, Smith produced only 1.23 total bases per game. Jeter produced 1.84. But in the field, Smith absorbed 5.03 chances/outs per game vs. Jeter’s 3.90. In general, each extra ball Smith reached and converted into an out was worth at least one base. On this simple (and not very accurate) thought experiment, Smith’s fielding advantage more than overcomes the difference between Jeter’s 115 OPS+ and his 87. (I hope I’ve constructed this comparison in a valid way . . . I’ve been out of the game for quite a while and the last time I tried this you caught me in a basic error.)
The balance can go the other way. You mentioned Dick Allen and Brooks Robinson, and when I compare Allen’s performance at 3B (which was awful) to Brooks’ and their entire hitting careers, where Allen’s OPS+ outpaces Brooks’ by 51 points, Allen produces 0.46 more runs/game on offense and Brooks saves only 0.34 more on defense. So it would take a lot more work to figure out the most valid way to do a comparison. But I think overall this still suggests a value for the fielding component much higher than what intuition tells us.
Now an even sloppier thought experiment: I think I can guarantee you that if you had eight positional equivalents to Smith on your team and eight positional equivalents to Frank Howard, the Smiths would overwhelmingly run the Howards out of town, assuming pitching competent enough to limit the Howards’ HRs to 8 good Howard seasons. The Howards would score ~300 runs on home runs–perhaps ~500 total RBIs on TTO outcomes–but would have a hard time getting a rally going any other time. I think the Smiths would bunt and slap hit the Howards to exhaustion–not to mention the pitchers.
The way teams traditionally flourished was through emphasizing fielding through the center of the diamond and hitting on the sides. The liabilities of the Howards tend to be minimized that way (and obviously more so with the advent of the DH). Moreover, the advantages of good fielding are the results you don’t see: hits eliminated, in contrast to long balls that make the stands erupt. Obviously, the more the game tilts towards TTO outcomes the more value becomes maximized in pitching and hitting.
Bob,
Hornsby or Maz?
Frank Thomas or Keith Hernandez?
Mike Piazza or JIm Sundberg?
Allen or Brooks?
Mantle or Garry Pettis, Devon White?
Frank Howard vs. Roy White?
I’ll take Chipper Jones and you can have Chapman….Though, I really do like your Ozzie vs. Jeter comparison – anything to knock the halo off that guy’s head.
You do realize the hitters would score seven runs/game versus league average pitching, right?
Paul, I think you’re just building on the traditional view.
Hornsby or Maz is super easy: Hornsby was a good fielder and Maz was a lousy hitter. Hernandez was an average fielder at a low-impact position; of course you’d take Thomas. Piazza was a slightly below average catcher and Sundberg a lousy hitter.
Here’s a better comparison: the Boyer brothers. Ken had a 115 OPS+ Clete 86 OPS+: about equidistant in opposite directions. Both were third basemen. Ken was a very good fielder but Clete was state of the art–Clete produced about 1.1 more dWAR per 162 games. How much did the difference between very good and state of the art make when there was a ~30 point OPS+ difference? By the formula I used above (TB/G vs. Chances/G at Third) Ken produced 0.45 more bases per game in hitting and Clete made up 0.33 in bases saved per game. So by this rough measure, an advantage of about 1.1 dWAR per season will make up about 70% of the difference in a gap of about 30 OPS+. Would intuition have told you that Clete was within that range of Ken in total value? Clete had a total Rfield of 159, Ken had 73. Drive Ken down to an average fielder and total value would be a wash. And that’s just figuring bases saved–Clete was also creating outs: calculating that effect is beyond what I can do.
And there’s another dimension. Consider Hornsby and Maz. If you try to estimate how bad Hornsby’s fielding would have to be to create a value balance you realize it’s meaningless–no fielder that bad would be at second base. Hornsby would have been a first baseman or left fielder if he’d been a bad fielder. That’s where you’ll find the Prince Fielders and Frank Thomas’s. But then you’ve got to go out and find a competent infielder to take Hornsby’s place. You gain Hornsby’s batting at first but have to prioritize fielding at second.
Bottom line (I think): the point isn’t that fielding is as important as hitting, it’s that its importance is greatly undervalued. Going back to the original issue, if we compare Mantle and Mays and grant that Mantle is the superior hitter, it would not be at all surprising if the excess value he accrued from hitting were more than canceled by Mays’s excess value in fielding on the sort of scale that advanced stats indicates. Every added catch made or error avoided is bases saved equal to somewhere between a single and double. If Mays added, say one extra ball reached every ten games it would add the equivalent of about 20 TB to his value (that’s just bases saved, outs added would be on top of it). It’s more value than we intuitively realize. (But, again, I’m not sure we really know Mays did that.)
To your point that the trend towards TTO is diminishing the value of fielding, teams struck out once more per nine innings in 2000 than they did in 1985, which has to be accounted for in the Jeter/Oz comp.
That number has, of course, skyrocketed since then. There are simply fewer opportunities to go around.
True, Voomo. That won’t apply to Mays vs. Mantle, but you’re correct that there was about a 10% rise in the number of strikeouts from the heart of Oz’s career to the heart of Jeter’s, so that’s not the best comparison.
Let’s do this comparison. Oz vs. Barry Larkin, rough contemporaries. Larkin’s OPS+ is 116, Oz’s is 87 (just the difference between the Boyer brothers). Larkin was an average-fielding shortstop (lifetime Rfield +18) and Ozzie was the best (+239).
Using the rough measure of TB/G, I find Larkin producing 0.42 more bases per game. Using the rough measure of Chances/G*Pct I find Oz preventing 0.70 more bases per game (not considering added outs)–and I’m counting every added productive chance as a prevented single; some were surely prevented doubles.
This is like the Boyer comparison, with Oz having about twice the increment in fielding skills over Larkin that Clete had over Ken.
In 2024, that increment would result in a smaller effect due to increased TTOs, as you point out. But it should still illustrate how our intuitions underestimate the impact of fielding excellence. If MLB becomes all TTO fielding will be worthless, but its basic importance to the game historically is why MLB should do all it can to limit further growth in TTO outcomes.
Well, 0.70 per game is significant. If 2 out of every three games Ozzie prevented a single (maybe double) that Barry let slip through, that is huge.
Lets look at their teams’ pitching stats.
Ive picked Ozzie’s 1989 (his best defensive year, with 32 rField), and Barry’ 1990 (also a good year, with 10 rField). They both played 150+ games in those years.
Ozzie had 483 assists
Barry had 469 assists (leading the league)
Ozzie was part of 73 double plays.
Barry, 86
So, already, Im not clear how Oz gets a 32 and Larkin only a 10.
Let’s look at the opportunities their pitchers gave them.
The 1989 Cardinals struck out 884 batters.
The 1990 Reds struck out 1029.
Fewer balls in play for the Reds’ fielders.
The Cardinals induced 2245 ground balls.
The Reds, 1933.
Aha, there it is.
300 more chances for St. Louis, X# of which were hit in Ozzie’s direction.
So, again, not clear how Ozzie, with many more opportunities, can be rated that much higher than Larkin, with comparable assist/DP stats.
Voom,
Thank you for explaining, in a nutshell, HTF we are supposed to have faith in any defensive metrics beyond assists, putouts, and double plays.
Paul, The only stats I’m using are chances, consisting of assists, putouts, and errors.
Very interesting, Voomo. Where did you find that ground ball data? I’m unable to locate it. That’s a big discrepancy. It’s also true that Ozzie had fewer, not more, chances in 1989 than Larkin had in 1990.
There are two aspects to the argument you make: 1) Rfield/Rtot are not transparent and don’t seem to make sense; 2) Ozzie’s range factor superiority is due, in substantial part, to playing behind ground-ball, lower-K pitchers.
My comparison between the two players was for lifetime measures concerning TB and Chances*Pct. If you use those calculations for OZ-89 vs. Larkin-90, Larkin comes out ahead. So you selected ~5% of each player’s careers that are atypical for my comparison. You chose them because of the profiles they more or less share in Rtot–that’s perfectly reasonable, but since neither of us can account for the Rtot figures, it’s not really relevant to the comparison as I’ve set things up.
Assuming your ground-ball data is accurate (and I always assume you’re accurate; I just can’t locate the data so far) it’s a mystery to me why Rtot would rate Ozzie so high. There would be a presumption of more ground balls towards SS that Ozzie’s lower total chance figure suggests as poorer range than Larkin those chosen seasons. I’m not trying to explain Rtot, though. I think I once understood it, but now I have no clue.
If the pattern of the seasons you chose were representative of the career patterns, I’d be stumped. Overall I’m still seeing Larkin with far fewer chances per game, and I can’t yet see whether the groundball discrepancy you found holds over time.
One further thing that’s of interest. As it happens 1989 was a pretty good year at the plate for Oz and 1990 was an unusually weak one for Larkin. The discrepancy there is only 0.15 bases/game. So even though, unlike Rtot, I calculate Larkin’s fielding as having the edge, the two players in those two seasons are still not far apart in value. (It doesn’t really have anything to do with my general argument, though; just a fun fact.)
Team Pitching Splits:
https://www.baseball-reference.com/teams/split.cgi?t=p&team=STL&year=1989#traj
Thanks, Voomo. I remember seeing these pages now, but I don’t even know how to navigate to them properly.
It seems to me that the key figure to look at would be the number of balls hit up the middle by a right-handed batter; that is, towards SS. Ozzie ’89 still gets more than Larkin ’90, but the margin is small: 1182 to 1136.
Bob,
Just a few thoughts:
1) There wasn’t a GM alive who would trade Ken Boyer for his brother
2) Hernandez was probably the greatest fielding 1B of the last 50 years
3) Piazza vs. Sundberg? Yes, that was the whole idea of the discussion – the best hitting piss-poor fielder vs. the best-fielding piss-poor hitter at each position
4) If the average 3B gets 4.25 PA’s/game vs 3.25 chances/game, which is more critical to team success? Then throw in a .920 FP for the hitter versus .960 for the Gold-Glover and you’re talking about 22 chances that are errors while the hitter is hitting 22 more home runs per 162.
You may recall Bill James remarking that he would have kept Ryan Braun on 3B with Prince on 1B and let the other team try to outscore the Brewers?
How about this: We agree to keep a team full of the best hitters at each position and replace them with the glove guys in the 9th inning if we have a lead?
Well, let me try to reply in series, Paul.
1) Yes, my whole point is that we’re now able to understand the importance of fielding far better than GMs could in the 1960s. You’re articulating the traditional judgment (which I shared till a few years ago) and I’m trying to challenge it, so invoking the traditional judgment isn’t actually relevant.
2) Ok. I passed over 1B simply because I think fielding is much less important there. I don’t know to what extent I’d press the argument for 1B.
3) That’s not the argument I’m making. I’m making the argument that fielding impact is much underrated, and that in a match up like Mantle vs. Mays fielding quality can override discrepancies in hitting. I know you were arguing about the worst hitters vs. the worst fielders, but I don’t really think that makes any sense because the worst hitters may not be the best fielders–they may just be on weak teams–and vice versa. I gave my response to that in my team of Howards/Smiths thought experiment. I think what’s interesting is that when we match up players usually think of fielding as an afterthought–an “all things being equal” factor to consider–and advanced fielding stats do not bear that out at all.
4) Chances are balls that players get to when an out is still possible with normally skillful play. Incremental chances are hits that are turned into outs–poor fielders don’t generally accrue those chances at all; they’re not like PAs. If a superior fielder gains one chance every fourth game (a meaningful figure because I picked it out of my hat) that would be the equivalent of adding 40 PAs and batting 1.000 in them. An inferior fielder will not only miss those chances, he will miss some number of chances an average fielder would accrue and also fail to turn some added number of chances he does receive into outs by generating errors (which could lose multiple bases)–let’s say losing a total equivalent to 67 PAs, slugging 1.108 compared to a top fielder. I think that could balance 22 HRs (a meaningful figure because you picked it out of your hat)–remember, the 22 HRs occur in a context that generates many offensive outs, which each incremental chance removes an out from the opposition.
Bob,
1) In Clete’s best stretch of 1157 games/4532 plate appearances he accumulated 3.3 WAR per 650 plate appearances. Ken managed a stretch of 1084 games/4634 plate apearances that averaged 6.3 WAR per 650 PA’s. If you wish to do Clete’s peak, in 306 games/1212 PA’s, he average 4.5 WAR per 650 PA’s. Ken averaged 5.0 WAR for every 659 PA’s for his ENTIRE career….So, as mentioned previously, NO genearl manager in his right mind would trade Kenny for Cletis.
2) Yes, and my point is 3B isn’t as important as anyone thinks either. Take the hitter…
3) If you want to say fielding is ‘nuanced’, perhaps so. I watched Chase Utley for many years look like he was struggling in the field. dWAR does not bear that out. He had great range, apparently, or he was constantly out of position and just making it look difficult.
4) as far as the arcane stats for fielding, I understand the Voomo argument for the SS’s in 1990 and how it, basicaly, blows up the accuracy of Rtot. Does Smith’s “appearance” of greater range account for what appears to be some hypothetical number superior to Larkin’s? I dunno…
1) I completely agree that no GM would have traded Kenny for Clete and have already said as much.
2) I understand what point you want to make.
3) Ok.
4) Well, the difference Voomo cited turned out to be not quite the scale his initial stat indicated. As I wrote in a reply to you above, I’m not basing anything I’ve written on arcane stats. I’m using PO+A+E (Chances and Fielding Pct.).
Paul, my thinking was identical to yours until I began reading in detail about these issues in 2018. I suppose I could go back and search for the material I introduced on this site then, but I’m not going to. If you think the whole “Fielding Bible” advanced stats thing is a load of nonsense you’re entitled to think that. I changed my mind when I was engaged in this stuff. You’re saying to me now the sorts of things that I’d have said before I looked into the details (spelled out in four large books collecting dust on my dusty baseball bookshelf). I understand your skepticism completely and I’m sorry I’ve left all this stuff too far behind to offer more statistically nuanced arguments now, and better descriptions of the methodologies I found persuasive. I’ll just add that the person most behind the Fielding Bible studies was John Dewan, who is one of two founders of Sports Info Solutions, the parent company. The other was Bill James, who introduced the first volume and contributed articles to the series, and whose endorsement opened me up to rethinking, since he had done that thirty-five years earlier.
Yankees up the middle during their 4 Championships in 5 years:
rField
-6, 7, -4, 1 Girardi/Posada
-3, -4, -15, -10 Duncan/Knoblauch
-14, 2, -11, -23 Past A Diving Jeter
-14, -14, -16, -3 Bernie
I guess the bats carried the day…..
I’ll take umbrage at Piazza’s defense described as piss-poor.
If you wanted a proper comparison, you should have provided Victor Martinez v Sundberg.
While Piazza was overall just below league average in b-r stats (career 1.5 dWAR), he was a good defender as a Dodger. Look at 1993: 1.8 dWAR. He twice led the league in assists, and 4 times in putouts, once in C range factor, once in fielding %, and even in caught stealing (1993).
Yes, he was terrible at throwing out runners, but that is just one phase of a catcher’s job. He was outstanding at several important parts of a Catcher’s job: game calling; blocking the plate (when catchers still did that); preventing passed ball and wild pitches; and framing.
Over the course of his career, with Piazza behind the plate, his teams’ pitchers allowed an OPS 25 points lower, and an unintentional walk rate 10 percent lower, than they did while throwing to different catchers.
Tom,
Umbrage noted. I believe, like Ted Simmons, Piazza’s offense was so superior that he was perceived as below average behind the plate. But, yeah, Piazza, is by any measure, the greatest hitting catcher of all time. I would have traded Karros and put Piazza on 1b to make sure he played 155+ games every year…..
Remember that as a Dodger rookie, Piazza had an outstanding defensive season. His throwing problems got exploited after the season, but throughout his Dodger years, the other aspects of his defense were good to outstanding. Dodger pitchers loved throwing to him, and not just because of his offense.
Piazza was a first baseman in college. His pre-draft scouting report said that “he had “very little defensive ability at that position.” He was famously drafted only as a favor to Tommy LaSorda, who promised the FO that Piazza could catch. Piazza did play some 1B in the minors, but not nearly well enough to threaten Karros.
And, don’t forget that Karros was a golden boy at the time. He was something of a hometown boy, a UCLA alumn; he was the one bright spot in the miserable 1992 season; and he and Piazza were literally the poster boys for Dodger baseball in the mid 90s.
Tom,
regarding the ‘poster boy’ thing, did not Piazza sing in a metal band that played the California beach towns bars in places like Manhattan Beach, Huntington and Long Beach? Don’t recall if Karros fancied himself a musician as well.
With the way the LAD spend money nowadays, what were they thinking when they couldn’t extend Piazza? Was that his agent’s doing?
I’d venture a guess that if you’ve got an average defensive catcher who is a well above average hitter, you’re gonna be better than .500 year-in/year-out through out that receiver’s career…..I certainly thought Piazza would have won an MVP award at some point and may have taken it in 1995 if he hadn’t missed some time (112G out of 144).
For a while, Piazza constantly popped up on metal shows, singing backup or playing drums for a song, he even sang backup vocals on a Black Label Society song – Stronger Than Death. In New York, he was a frequent guest at rock radio shows.
I never heard of Karros doing anything like that.
Both sides are to blame for that contract fiasco, Fox didn’t want to be the first to sign a player to a 9 figure deal. SoFox execs bypassed the GM and made that huge trade. Then a few months later, they signed a pitcher to the first 9 figure deal.
Piazza did not do himself any favors. At the end of 97, he and his agent imposed a deadline of March 15 to make a deal. When the deal didn’t happen, he blasted the team in an LA Times article. After the article, he appeared for an interview with Vin Scully, where Vin asked him about the deadline and the negotiations. In his biography, Piazza blamed Vinnie for turning fans against him, saying that Vinnie blindsided him at that interview, and was “crushing him” when he didn’t take a Dodger offer of $76 mil for 6 years. And, that Dodger fans booed him at Vin’s prompting.
SB nation took a look at those claims: https://www.sbnation.com/2013/2/15/3992740/mike-piazza-book-vin-scully-crushed-controversy
Piazza should have won an MVP sometime in the mid 90s, maybe if the Dodgers had won the division in 96, or 97?
Thanks – 7 years, $ 91M seems relatively fair since a few of those seasons were top 5 in salary per B-R. I can only imagine what he may have hit in a bandbox…in lieu of Dodger Stadium or Shea
Actually, .321/.388/.572 on the road versus .294/.364/.515 in places like LA, Shea, Oakland
Fascinating discussion here. I’m certainly in the “fielding is undervalued” camp. The logic seems inescapable, ergo you can only score if you get on base, so every extra out not only eliminates the possibility of that player scoring, it also eliminates or significantly reduces the probability of scoring for runners already on base and for batters still to come in the inning.
More subjectively, if you watch a team everyday or nearly so, the difference between an elite fielder and an average fielder becomes very obvious, and the difference between the former and a poor fielder is massive.
The other way fielding is undervalued is that, unlike offense, fielding is, generally speaking, slump-proof. So, a better fielder can help you win every day while even the best hitters are likely not going to be providing above average offensive contributions even as little as half the time. To illustrate, in 59 full seasons since 1961, these are the number of player seasons having RE24 of 0 or more in:
100+ games: 22 (0.2%)
90+ games: 254 (1.9%)
81+ games: 1163 (8.8%)
The % number indicates those player seasons as a percentage of all possible player seasons (i.e. no. of teams x no. of offensive positions x no. of seasons) since 1961, omitting 1981, 1994, 1995 and 2020. Bear in mind that RE24 of 0 is what a league average hitter would do. Thus, in only 8.8% of possible opportunities do players contribute offensively at a league average level or better in at least half of their team’s games. Certainly a huge difference in consistency compared to defensive contributions.
I would argue against Fielding being slump-proof.
That hitter who is in a slump because:
… All of these factors dont go away when that same guy puts down the bat and puts on a glove.
Point taken. OTOH, a player might respond to a batting slump by saying to himself “I’m not helping the team with my bat right now, so I’ll bear down and really keep my head in the game to try to help more with my glove”. Would be interesting to do a study and find out if there is a significant correlation between fielding and hitting slumps.
Subjectively, just based on observation, if there is such a correlation, it doesn’t seem very strong. Hitters rarely go on hot streaks for more than a couple of weeks before cooling off; if a player’s fielding took a dive that often, he wouldn’t be playing at all. A fielding slump, especially a throwing slump, seems more likely to simply result from a missed play. For example, a player air mails first base with a throw and, in his next chance, he over-corrects and short-arms a throw into the dirt.
I think there’s more to Doug’s observation than a matter of funk-related slumps. Batting skills are fundamentally different from fielding and baserunning skills. The latter have more to do with trained athleticism: speed, arm strength, agility. These tend to be relatively invariable. There’s certainly overlap: both batters and fielders need concentration and quick reflexes, and batters benefit from intrinsic qualities like size and strength. But I think a much larger proportion of fielding skills involve fluid adaptations of basic trained motor modules in a context that allows more time for action adjustment.
Moreover, a batter swings and fails to put the ball in play more often than he puts it in play, even in many at bats where he does put it in play–and then often it’s not well hit. Fielders generally succeed within their range of coverage >95% of the time–even poor ones–although their ranges vary. Fielding is usually a story of success, which is self-reinforcing. Batting is generally a story of breaking through failure. The psychologies are different, both in terms of conscious effort and trained reflexes, which is why I think “fielding slumps” are very rare.
Having said that, ever since I read Doug’s post hours ago I’ve been thinking about Chuck Knoblauch. On a trip back to New York, I took my boys to their first game at the Stadium when they were Little League age, and in the middle of the game, Knoblauch smoothly fielded a grounder to second and threw an eephus into the middle tier of box seats. The older boy turned and said, without sarcasm, “Dad, what was that?” I’d read about Knoblauch’s adventures but hadn’t expected actually to see anything like that. There are exceptions to Doug’s rule. But I thought Doug’s initial post had two really novel lines of thought.
Yes, I actually agree with all that. I’ve mostly been taking an opposing argument to keep this conversation going.
And Ive been thinking about Knoblauch, too.
Still bothers me, 22+ years later, that in what was to be the final at bat of his career, in Game 7 of the World Series, that Paul O’Neill was pinch hit for………… by Knoblauch.
And by the way, the year before, 2000, when Knobs last played 2nd base and had those Yips, according to DRS he was still better than Jeter.
Voomo,
“And by the way, the year before, 2000, when Knobs last played 2nd base and had those Yips, according to DRS he was still better than Jeter.”
You are officially the world’s finest “Halo Knocker-Off-er” on the surface of planet Earth. Thanks again for keeping it very real
Don’t forget the Yips.
They can seemingly strike out of nowhere.
nevermind, didn’t see the conversation below.
Doug,
I would suspect that fielding skills don’t age as well as batting skills. I’d be willing to bet that young elite fielders at critical positions (SS, 2B, CF) become league average at their position way sooner than elite hitters (at corner OF and IF) become league average (if ever). Further, an investment in a slugging 3B in free agency at say age 29 or 30 is a better buy than the Chapman-type who hits OK and , supposedly, fields well. Chapman, however, is a bad example as his skills at the plate are dissipating rapidly….How many fans can take a 198K/162G .230 ‘slugging’ corner infielder?
Another good point. Suspect you’re right about skills dissipation being more pronounced defensively than offensively. Will try to buttress that suspicion with some stats.
I can still hit the crap out of a pickleball, but I can get up off the ground without using my hands anymore.
I’m not sure I see the relevance of any of this. We’re talking about the importance of fielding, not particular position players. If a good young fielder becomes a bad old fielder it has no implication for the importance of fielding, same for poor fielders who become worse. If his bat is good, move him to LF, 1B, or DH. If his bat isn’t good and no other team would find him an upgrade it’s time to audition for ESPN.
Doug’s point about consistency was clearly in a single-season context.
Bob,
GM’s make investments in players. The point is that if a player’s skill set fades sooner than another’s (like fielding faster than slugging), he’s not worth the investment or as large an investment as the other player.
I understand that, Paul. And you’ve used the GM perspective several times. I just don’t see the relevance to the general question of the value of fielding skills in baseball. We began by talking about their impact on post facto MVP assessments, and the only issues concerning long term value were also retrospective: e.g., whether Mays’s overall value was boosted enough by fielding to overcome Mantle’s. Our conversations on HHS are almost always retrospective, about actual stats, not prospective.
Which isn’t to say your point isn’t interesting in itself. But there’s no contradiction between the Fielding Bible premise that fielding value is vastly underrated and a claim that GMs are right to discount it intuitively because it generally decays more rapidly than hitting value (which may be true or not). However, in the case of, say, GMs choosing between Mantle or Mays after the 1961 season, that general rule would have led them to a misguided choice.
Moreover, even if you did find a correlation showing that batting skills decline more slowly than fielding skills, you’d still need to assess whether that sum was reflecting a regular and predictable curve or was just a sum of individually variable records. It’s easy to think of examples where it doesn’t hold: e.g., a great fielder like Brooks Robinson or a poor fielder like Derek Jeter. If you show that the majority of cases are different it would have to be a large majority to have justifiable impact on a GM’s thinking when he assesses individual players.
Bob,
It’s nuanced. Who else would really have a ‘dog in the hunt’/’skin in the game’ other than GM’s, ownership/management? As fans we are mere pimples on the gluteae maximae of a long history of obeisance being totally subject to the whims and decisions of management /ownership.
As far as Mays and Mantle, Mick was significantly better as a hitter due to the extent of their differences in OBA. Mays was a better fielding CF than everyone from about 1954-1970 and was probably unmatched in sheer efficiency until guys like Maddox and Gary Pettis came along.
As far as hitting skills versus fielding skills dissipating in the case of Mantle, while crippled in his last four seasons totaling 518 games and 1928 PA’s, through the power of the base-on-balls, Mick managed a 149 OPS+. In 1971, a 40-year old Mays took 112 free passes (slowing reflexes?) and managed 35 Rbat-a total he had not surpassed since 1966. But, to be certain, Mick was walking more frequently throughout his career and that’s what made him the superior hitter.
On another note, try figuring out the Gold Glove voting when reviewing Callison versus Clemente for the period 1962-1965. I guess you get points for “graceful”?
GMs and owners are asking different questions from the ones we ask, Paul. It’s fine to consider their perspective, but those perspectives are based on future bets; we assess outcomes. I don’t have any objection to your interest in the GM perspective; it’s just not relevant to the issues I was raising. And as far as relative importance of GMs and fans: no fans, no GMs. (And you, after all, are making your judgments as a fan, not an actual GM, who would be factoring in budgets, pre-existing player contracts, draft-pick tradeoffs, regular-season/post-season strength, and, of course, the market implications of getting rid of fan-favorites, among many other things.)
I don’t disagree with anything you’ve written on Mays and Mantle. Williams was the master at BB, and if he’d fielded like Mays he’d have Mays’s WAR totals despite those years lost to the military.
Callison vs. Clemente: did you mean 1963-64? 1962 seems a toss-up and in ’65 I’m not sure why you’d choose Callison. I never paid any attention to GGs because I thought they were entirely subjective. I suppose now they use advanced stats to guide them, but back in the day it seemed to be mostly the usual suspects. It’s one item on B-Ref I entirely ignore.
Rfield….dWAR…..Assists……Rtot…….Errors…….Putouts 1962-’65
55…………3.3………91………….55……….19…………1263……Callison
40…………1.9………59………….42……….39…………1086……Clemente
I imagine one could make the argument that the assists totals reflect the “newness” of Callison to the NL and the “fear” of Clemente’s arm but, the other stuff, I dunno
GGs are awarded on an annual basis, Paul.
Rfield 62 / 63 / 64 / 65
Callison……15 / 18 / 15 / 7
Clemente….15 / 0 / 8 / 17
I asked you whether you meant 63-64 rather than 62-65, and said ‘62 seems a toss-up and in ’65 I’m not sure why you’d choose Callison. As that indicates, I think the evidence says Callison should have won GGs in 63-64, not in ’65, and I have no idea about ’62. I also have no idea why you’ve conflated the four years. But, as I also wrote, I think the GGs were a nonsense award and I believe you can find more egregious mistakes than NL ’63. (I don’t think this is in any way relevant to the question of whether fielding is undervalued, only whether fielding awards are overvalued.)
Conflated to emphasize Callison’s statistical superiority to the legend….
but, alas, here’s 1965 broken out beyond “Rfield:
Innings….Assists….Errors….Field%….RF/9…..NL%….NL RF/9
1,390……..21………….6……….983……..2.19….975……..1.95…Callison
1,264……..15…………10………967……..2.09….975……..1.95…Clemente
Somehow, Clemente garners more Rfield (17-7). Perhaps, PIT had a ground-ball inducing staff? Clemente took fly balls from Virdon? Or, vice versa? This, to me, seems a lot like Voomo’s Larkin 1990 vs. Ozzie 1990.
Don’t know if it explains anything, but here are some pitching comparisons for the 1965 season.
Ground Outs to Air Outs: PIT 1.34 (1st in NL), PHI 1.13 (T-5th)
HR%: PIT 1.5% (1st – lowest), PHI 1.9% (2nd)
XBH%: PIT 5.1% (1st – lowest), PHI 6.4% (6th)
XBH/H: PIT .24 (T-1st, lowest), PHI .28 (4th)
Balls in Play%: PIT 75% (T-1st, highest), PHI 71% (T-8th)
SO%: PIT 14.4% (8th – highest), PHI 17.2% (4th)
Double Play%: PIT 14% (1st – highest), PHI (11%, T-2nd)
Unaccounted PA: PIT 348 (10th – lowest), PHI 0 (T-1st)
In lieu of percentages, are there any specific numbers associated with these events available? Forbes Field was 457′ to CF and Connie Mack Stadium was 447′ IIRC. I believe, off the top of my head 366′ to RF at Forbes and 329′ to RF at Connie Mack. But, I don’t know how, exactly, that would impact Rfield 🙁
Those numbers are from B-R (not Stathead) so visible to all. Go to https://www.baseball-reference.com/leagues/NL/1965.shtml and hover over “Pitching” and you’ll see a bunch of options that you can click. The above numbers were from “Pitching Ratios”. Raw numbers are under “Batting Against”. Park-level data can be found under “League Splits”.
Park factors for all games pitched (Home and Away) are under “Value”, The Phils and Bucs ranked 3rd and 4th in most pitcher-friendly environs, behind the Dodgers and Astros.
Speaking to subject of whether WAR is an effective stat for Pitchers, it would seem that park factors and defense influence this number significantly.
Here are three AL Pitchers from 2023 with similar IP:
3.5 Brayan Bello
3.5 Eduardo Rod
2.2 Jon Gray
This would suggest that Bello was as good as Eduardo (the Red Sox might agree, as they just gave him an extension)
Here are the RA/9 numbers for each:
4.41
3.48
4.29
Doesnt begin to make sense until you plug in their RA9def and PPFp:
-0.12 / 106.2
0.13 / 102.0
0.24 / 103.2
These def and park factors make Bello and Eduardo equal despite Bello giving up .93 more runs per 9?
RAOPP is a factor, as well, as the Red Sox opponents scored .23 more runs than did the Tigers’.
Do they somehow factor in that Bello is an extreme ground ball pitcher, and thus was even-more affected by Boston’s crappy infield?
There is so much to unpack, and I think WAR has become normalized to the point that most casual (and some slightly obsessive) fans are conditioned to simply accept the number without question.
Yet just looking at their WHIP slashes, who would say that these two guys were equal?
1.338 / 9.5 / 1.4 / 2.6 / 7.6
1.153 / 7.5 / 0.9 / 2.8 / 8.4
Voomo, I’m not really sure which direction you’re taking here. We’d expect RA9def and PPFp to have an impact in a case like this. The B-R WAR formulas are applied to all pitchers. You indicate that the large scale of impact in this comparison seems excessive, but I’m not sure whether the flaw you suspect has to do with the whole enterprise of appropriately weighting pitching components and applying ground-leveling standards across teams and fields, or whether you think the counterintuitive result in this case means there must have been an error specific to this case.
FanGraphs WAR for Rodriguez is almost twice that of Bello’s; the two systems don’t track closely in general. Maybe you want to argue for hedging by, say, using an average of the two systems to buffer the possible unidentified defects of each. But the alternative, which was what I grew up with, was to say, “Wow—look how much better Rodriguez was than Bello! Of course, Bello was in Fenway that that defense sucked, but since we can’t measure that, ‘Wow’ is the last word.” Part of the interest of advanced stats is precisely that they produce counterintuitive results that make us think harder about the data.
Bob, It was you or somebody else who recently put forward the opinion that WAR is better suited for hitters than hurlers.
I’m just wrapping my head around that concept.
The fact that b-r and fangraphs are far from consensus speaks to the one point I did make, which is that we should probably resist the lazy impulse to treat Pitching WAR as gospel.
That was nsb, Voomo. His point was that WAR was developed for hitters and then adapted for pitchers, which might have made it less well grounded. (I knew you were picking up on that issue because I’d mis-remembered you as the person who had brought it up.) It’s a very good point to which I wrote a reply that was as long as it was uninformed.
In my distant memory I seem to recall that when it came to pitching, the chief difference between WAR outcomes for B-R and FanGraphs concerned the weight given to FIP (FanGraphs gave much more). I wonder whether anyone else can confirm or refute that notion. My recollection is that for a while I was including both forms of WAR when making tables to compare CoG candidates, and that I stopped after I did a shallow (but deep for me) dive into the issue and found that the FanGraphs formula simply didn’t seem convincing to me. (Also, I was anxious to be lazier, which is basically what you and nsb have been cautioning about with respect to overuse of WAR.)
Voomo:
I’m the villain of the piece.
Bob’s the defender of what, in a very short time, has become the status quo. All the numbers are on his side because his side defines what numbers are right or relevant, not to mention how to interpret them,
The Lopat-Santana comparison above basically says one of two things, that Santana was nearly two and a half times the pitcher Lopat was, or that pWAR has a lot of trouble with evaluating the true worth of pitchers who don’t meet its definition of what a pitcher ought to be, i.e., someone who’s raison de etre
is to strike out the side on nine pitches. A simplification, maybe, but, if you could go back in time to ask American League batters of 1946-1953 about the toughest pitchers they faced, Lopat would be mentioned over and over, despite his abysmally small percentage of strikeouts. All those slow rollers to the infield didn’t happen by accident, but they weren’t Ks, so they show a deficiency of what? Intelligence? Technique? Philosophy? They ain’t the way the game ought to be played, anyhow, according to pWAR.
If I were in charge of a team today, I’d go against the current stream and get low strikeout pitchers.
I’d build a spectacular infield defense, and get groundball pitchers who try to induce contact early in the count.
The goal would be fast, fast innings. Ive never seen this studied, but I think that Time of Possession can be a factor in baseball.
Meaning, just like in football, if you can keep the other team’s defense on the field, as the game wears on you gain an advantage.
This may seem obvious, but I’d love to see the effects of it taken to its extreme.
Hi nsb. It sounds to me as though you’ve actually cast a different villain, but, as I wrote before, I thought your Santana / Lopat comparison was excellent work.
As Voomo says in response, it’s a great idea to have pitchers like Lopat together with spectacular defense. I absolutely agree that the 27-pitch perfect game is a better ideal than the 81-pitch version. Baseball is a team sport. But to get that result you need Lopat plus a bunch of good fielding position players, and they will deservedly share the credit for every play. A successful power pitcher may fail to make use of his good fielders, but he also shields his poor fielders. In general, power pitchers take on more of both the positive and negative credit because they’re doing a greater share of the work, for better or worse. For the 81-pitch perfect game, the only competent fielder you need is the catcher.
So all those slow Lopat rollers to the infield show no deficiency at all, so long as the fielding is adequate to exploit them. It’s just a matter of multiple people sharing credit for a single out. In your Santana / Lopat comparison you listed the variety of traditional statistics that present a mixed picture of which player was superior and asked whether it made sense that Santana was credited with over twice as much pWAR on a per inning basis. Credit sharing is an important element underlying that result.
I also pointed to very basic non-advanced stat: W-L above team levels. Lopat’s teams during his prime years (1944-54) had a total winning percentage of .575; Lopat was at .614 for +.039. Santana’s teams during his fewer years as a regular (2003-10) went .523, while his W-L was .670, for +.147 (he and Lopat both averaged 209 IP over their prime years, with Lopat contributing about one additional decision per year). That’s a *really* crude measure, but the scale of it says something. If you take the simple measure of how much each pitcher raised his team’s success rate you’d get an even larger difference than pWAR/IP yields. (Of course, Santana paid in burning out.)
To conclude with an nsb-like perspective, I think there are a lot of ways of looking at value in baseball, and some are simply not crunchable with others. pWAR envisions the game as outcomes divided by a fixed number of divisible game units. That’s a framework that allows you to generate measurable and mutually comparable contribution shares. The fact that the 27-pitch and 81-pitch perfect games may involve comparably skillful contributions by the pitcher is simply not commensurate with a model that requires that every player making a contribution get credit. It can’t be done. So pWAR is fundamentally incomplete and we need to supplement it with other information, including narratives.
That’s my defense of the status quo, villainous reactionary that I am.
Bob:
You’re not a villain here, certainly not THE villain.
I don’t think there’s villainy involved, in fact, just the obsessive nature of people who think that the map is the territory, that the figures define the game, that the schematic outline is the living reality, and that that perspective is the true one because it’s quantifiable. Reality is defined by the numbers.
Biology students in high school no longer study plants and animals; they study biochemistry. They don’t learn to appreciate birds or trees or even fungi; living creatures might as well be rocks or gasses. Science and technology, using mathematics, have explained away so much of what was from time immemorial viewed as wonderful or dreadful and made it instead banal, commonplace, and uninteresting, that I find it only sad that the same thing appears to be happening to baseball.
Which game is more interesting to watch? Twenty-seven strikeouts on each side or a 5-4 nail biter with runners on base every inning? Which is more interesting to play? It’s important to understand the consequences of one’s beliefs. After the last baseball game, when the 27 K approach drives all the fans and all the players away out of boredom, what will the stats guys have to say? “In order to save this village we had to destroy it?”
It’s not as bleak as that, nsb. I’m sure of it. In the late ’50s and early ’60s, when I’d actually go to the park to watch the Yankees and later the Mets (Brooklyn abandoned me after a single trip to Ebbets Field), feeling that my spiritual welfare depended on the outcome of each game and shouting myself hoarse, what I’d do on the other days is probably what you did too: pore over the daily box scores, tables of league leaders, or, on Sunday, the wonderful, endless stats of every player on track for a qualifying season. I’d fill up yellow pads with calculations or fantasy figures, constantly rearrange my baseball cards, re-reading the comments, cartoons, and stats on the back of each one, read over and over books of anecdotes and statistics, and, of course, play baseball, stepball, or just catch whenever I could. There’s more–tv, radio, and later (wonderfully) radio broadcasts of games while driving aimlessly down country roads on summer nights . . . and the Macmillan Encyclopedia of Baseball (still sitting to my right, in reach if I lean). The game and the stats are all part of one fabric. It’s not a pattern I relate to anymore: the game has changed, the special effect-leaded broadcasts are exhausting to me, and the stats that have simply gone beyond my capacity to retain and manipulate, but I think kids still get a complete package to grow into.
And we’ve had these alternative qualitative/quantitative ways of looking at the world for a very, very long time. It’s not just a product of the modern age. One year when my kids were young, I’d take them to the still rather novel mall, where they could play the latest video game machines at an arcade, and I’d keep giving them small sums to buy tokens because I’d found that the white noise of the seating area at the center of the mall was the perfect place for me to focus on my professional work, which at that time was reading and analyzing a calendrical text from the first century that was attempting to reduce and comprehend the meaning of all experience through an endless calculation of overlapping astronomical cycles–the twelve year procession of Jupiter, the twenty-eight lunar mansions, the sexegenary cycle of days, the five-century gaps in grand conjunctions of the visible planets, the patterns of intercalary months to align the seasons: if it could all be reconciled then human governance could order the world and we could live in the grand harmony of Heaven like the Garden of Eden (of which my authors had never heard). The followed the same compulsive quantitative impulses that had produced the programmers who had enabled American corporations and small businessmen in malls to hypnotize my kids until their tokens were gone and they had to run out to make me take a break and give them more change. The Chinese calendrical astronomers didn’t take the wonder out of the world with their obsessions; they added a mythological layer to it in the quantitative science of their day, and I think the early obsessive statisticians who somehow latched onto baseball in a way that no other sport had ever invited created a mythological layer beyond the game on the field that has been essential to what it means ever since. I think of watching the perfect beauty of a Ted Williams home run rising and falling in perfect parallel to the right field foul line and it is always paired with the exquisite form of .388, his beautiful batting championship number the same year. Somehow the rise and fall of that ball in the real world and the curves of those numbers on the page are two facets of one complete expression–as different and complementary as a subject and a verb.
When the game becomes unbalanced with the times it changes, as it did in 1893, 1911, 1920, 1968, and last year–it has to or it will die. And the statistical doppelganger keeps changing too, always shadowing and influencing the game on the grass. Biochemistry can enhance our experience of biology, neuroscience can expand our experience of thinking and feeling, and . . . WAR and endless arguments about its defects can enhance our experience of baseball–and keep us from getting too upset about the runner sitting on second base when the tenth inning starts, which is the greatest American abomination since the abolition of slavery.
What I see as different today is that those who control the game want to change it. Like much else, tradition is in their crosshairs. So, sadly the game we grew to love may be gone for a very long time; maybe forever.
Those who think “the map is the territory” have been promoted to the default position. It didn’t happen by accident. De-humanizing the game is the intent.
I think it’s an error to think of this as a matter of dehumanizing or of losing the game as it should be. Baseball has never been perfectly designed. Owners have always looked for ways to draw more people to it, teams and players have always searched for undiscovered ways to gain advantages (to game the game) and some of these lower the interest of the game on the field, and this is a see-saw process.
The game began with an emphasis on fielding: pitchers were restricted in their motion and the underhand throw was mandated so batters could put a rather mushy ball in play. Pitchers gradually figured out how to get around that and the rules were redesigned to recognize that high pitcher-skills were a value in play that enhanced the game, and by the time MLB begins in the 1870s pitchers are dominant, runs are increasingly scarce. In time the imbalance lowers game interest. In 1893 owners move the mound back to generate interest through more balls in play and higher run totals. They get their boom, but owner adjustments run immediately into team/player strategy discoveries. In the 1890s, teams figure out the high percentage returns of “inside baseball” (sharply improved fielding, base running, and exploitation of the scratch hit, HBP, and BB), and the high offense game of 1893-94 turns into the deadball era. Owners respond in 1911 with the cork ball and offense jumps. Pitchers respond with the spread of the spitball, emery ball, and other variants allowed by the rules of the game and deadball stats quickly return. Owners change the game by banning those pitches in 1920 and teams turn to Ruth-style slugging as a higher percentage approach to exploiting the cork ball, etc., etc.
At every turn, old-timers (like me) decry the changes, but interest in baseball continues to grow. In this century, advanced stats fostered a turn much like 1890s inside baseball, exposing that the game’s design could be best exploited through TTO strategies and shifts. That’s not the fault of the stats, it’s a flaw in the design of the game. The drop in interest was dramatic–attendance fell from about 79m to 68m in the pre-pandemic decade, and when it reemerged even lower a couple of years ago, the game was redesigned to correct those flaws (and attendance soared). Once this round of changes is through teams and players will search out new ways to game the game, and if some of those make the game less interesting to fans owners will start on a new round of changes.
My own worry is that changes can make statistical records incommensurable over different eras, and given baseball’s unique reliance on its statistical history for interest that seems to me a way to undermine it. That’s why I like WAR–it tries to translate all eras into a common language so we can read them side by side and make value judgments on common ground. One of nsb’s very valid counter-points, as I understand it, is that the languages of these eras were in fact very different, and we can’t understand and fully evaluate any one of those eras unless we learn its particular language. I hope these two views are not actually mutually exclusive, because part of the interest of baseball is exploring the varieties of its generations, and another part is the unifying form of that history.
https://www.retrosheet.org/boxesetc/1961/B04300MLN1961.htm
Off the beaten path here but, in the above referenced game, Mays, Aaron, and Cepeda struck seven (7 !!) homers between them. Is this, by any chance, the most home runs hit by Hall of Famers in a single major league contest?
Not sure if this is the most, Paul, but when the A’s hosted the Yankees at Shibe Park on 06/03/32, all nine home runs were hit by current Hall of Famers: Gehrig (4), Ruth, Combs, Lazzeri, Cochrane, and Foxx.
https://www.baseball-reference.com/boxes/PHA/PHA193206030.shtml
Tuna,
Thanks ! Per SABR: “In Gehrig’s sixth at-bat, Al Simmons robbed him of a potential home run with a leaping catch in deep center field.”
I believe Shibe Park may have been close to 450′ to dead CF
Maybe 468
http://www.andrewclem.com/Baseball/ShibePark.html#diag
SABR also cites the 468’ distance Voomo found:
https://sabr.org/gamesproj/game/june-3-1932-lou-gehrig-hits-four-home-runs-tony-lazzeri-hits-for-cycle-in-yankees-romp/
FWIW, none of the other four homer games came close to 9 HR by future HOFers (including recent occurrences, as none had many home runs from stars who might yet end up in the hall).
Had Simmons not caught up to that last drive and Gehrig recorded a 5 HR game, I wonder if another player might have equaled that total by now. With 18 four homer games, perhaps someone would have pushed further to reach five HRs, too.
Just saw some great Nolan Ryan stats:
He had 198 games in which he pitched a Quality Start but did not get the win.
In those starts he was 0-107 with a 2.27 ERA, with almost 10k per 9.
____
From 1973-1991 there were 300 games in which a pitcher went 9 or more innings and allow 2 or few hits. Nolan Ryan had 26 of those.
Saw this:
There were 8 hitters with at least 40 PA against Ryan and an OPS over .900. Here they are:
DICK ALLEN FOR THE HALL….CIRCLE OF GREATS….HALL OF STUPENDOUS 🙁
Quite the list. Cream really does rise to the top.
And yet, Voomo, Ryan’s lack of run support wasn’t the only plague he suffered. He holds the career record (2795) for walks, 950 more than his nearest competitor. He also threw the most wild pitches (277) since 1900, his nearest competitor tossing 51 fewer in about the same number of innings. Spot checking, I can’t find any modern era pitcher with close to as many stolen bases allowed, and his stolen base percentage, 75%, is stratospheric. Another interesting stat: grand slam opportunities allowed: 509, and he apparently walked in the runner from third 47 times. Of his contemporaries with approximately the same number of innings pitched,Gaylord Perry had 331opportunities (11 BB), Carlton 378 (19 BB), Phil Niekro 351 (28BB). His FIP (2.97) is very good, but his ERA+ of 112 is not at all.
He just reared back and throwed.
NSB, Voomo,
Nolan Ryan may have had the greatest “12 to 6” curve ball of the last 50 years. Mike Krukow? Doc Gooden?
Ryan’s high number of bases on balls is offset by his having the lowest H/9 in history.
A walk is less damaging than a single, in that baserunners can only move up one base. Zero bases if there is no force.
In 1977, Ryan gave up more walks than hits, which is preposterous.
204 free passes and 198 hits in 299 innings.
How do his overall numbers compare to the AL averages that year?
2.77 ERA – 3.31 RA9 – 1.344 WHIP – 0.4 HR/9 – 10.3 SO/9
4.06 ERA – 4.53 RA9 – 1.377 WHIP – 0.9 HR/9 – 5.0 SO/9
Despite having a WHIP below, but near league average, he gave up significantly fewer runs (the most objectively important stat).
I’ll take the walks if my guy is giving up less than half the Home Runs while striking out more than double the batters than the rest of the league.
Voomo:
No one would disagree that Ryan was good at what he was good at. My point was simply that blaming his mediocre W/L record in close, low scoring games entirely on lack of support doesn’t give the whole picture of Ryan in action.
And as impressive as the 107 tough losses seems, it is 37% of his total losses, whereas Whitey Ford’s tough losses comprise over 39% of his total, Warren Spahn’s 40%, Pedro Martinez’s over 46%. Ryan’s quality start percentage is a fine 62%, but Ford and Spahn clock in at 64% and Martinez at 67%. The more telling point is actually that Ryan’s tough losses aren’t balanced more favorably by cheap wins. His low 9.3 cheap win percentage compares favorably (or un-?) with Ford’s 11.0, Spahn’s 14.9, and Martinez’s 15.4.
I haven’t checked any other pitchers in these categories, but my assumption has to be that while Ryan’s bad luck and high level of starting performance are both unusual, they’re hardly unique.
Excellent. That’s actually why I posted those stats. So that someone’s smarter than me could put them into context.
Voomo:
Sarcasm is always appreciated.
That wasn’t sarcasm. I really just posted that stuff with no agenda. I live that you came up with all that context.
Footage of Honus Wagner talking. And playing at age fifty nine…
https://youtu.be/fUGIA4FLP9s?si=Rx17CakUtlMAQTZE
That’s Traynor leading off 3B….so, two guys from the “All-Time” Centennial Team….and Vaughan and the Waners. And a 2nd place finish in 1933.